APPENDIX B Transportation Assessment - Regional Municipality of Niagara Casablanca Boulevard and GO Station Access Environmental Assessment ...
←
→
Page content transcription
If your browser does not render page correctly, please read the page content below
Regional Municipality of Niagara
     Casablanca Boulevard and GO Station Access Environmental Assessment
                                               Environmental Study Report

APPENDIX B
 Transportation Assessment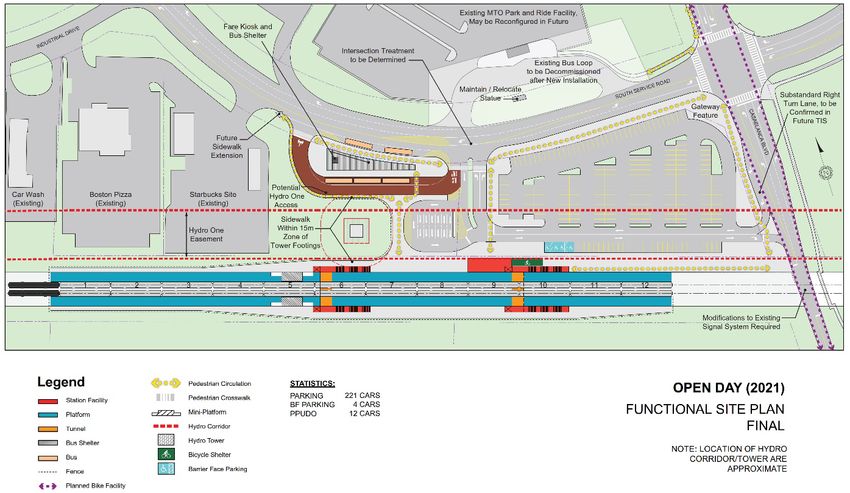
Niagara Region

Detailed Transportation Assessment
Detailed Transportation Assessment and Municipal Class
Environmental Assessment for Casablanca Boulevard, in
the Town of Grimsby

October 2018 - 18-7650

Table of Contents            i

      Table of Contents
1.0   Introduction                                                                                                            1
      1.1      Purpose........................................................................................................ 1
      1.2      Background .................................................................................................. 2
      1.3      Study Area ................................................................................................... 3
      1.4      Existing Transportation Network.................................................................. 5
      1.4.1    Active Transportation Infrastructure ............................................................ 9
      1.4.2    Transit Service and Infrastructure ................................................................ 9
      1.5      Traffic Data ................................................................................................ 10
      1.6      Niagara GO Hub and Transit Stations Study ............................................... 12
      1.6.1    Background Growth ................................................................................... 12
      1.6.2    Local Land Use Growth .............................................................................. 13
      1.6.3    GO Station Ridership Forecasts .................................................................. 15

2.0   Approach                                                                                                              20

3.0   Methodology                                                                                                           21
      3.1      Strategic Screenline Analysis ...................................................................... 21
      3.2      Microsimulation Analysis ........................................................................... 23
      3.2.1    Microsimulation Model Calibration............................................................ 23

4.0   Existing Conditions Analysis                                                                                          26
      4.1      Strategic Screenline Analysis ...................................................................... 26
      4.2      Operational Assessment ............................................................................ 28

5.0   2021 Conditions Analysis                                                                                              29
      5.1      Base Road Network.................................................................................... 30
      5.2      Travel Demand Forecasts ........................................................................... 32
      5.2.1    Background Growth ................................................................................... 32

      Niagara Region
      Detailed Transportation Assessment
      October 2018 - 18-7650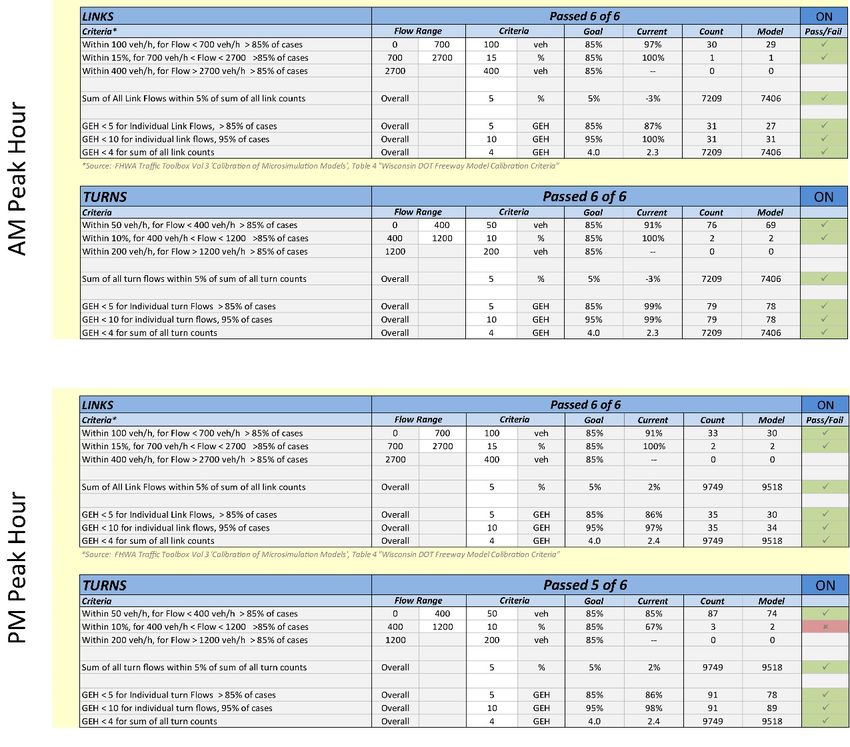
Table of Contents            ii

      5.2.2    GO Station Traffic ...................................................................................... 33
      5.2.3    Traffic Volumes .......................................................................................... 34
      5.3      Strategic Screenline Analysis ...................................................................... 34
      5.4      Operational Assessment ............................................................................ 34
      5.4.1    QEW Interchange ....................................................................................... 34
      5.4.2    Casablanca Boulevard & South Service Road ............................................. 36
      5.4.3    South Service Road & GO North Parking Lot .............................................. 37

6.0   2041 Conditions Analysis                                                                                          39
      6.1      Base Road Network.................................................................................... 39
      6.2      Travel Demand Forecasts ........................................................................... 39
      6.2.1    Background Growth ................................................................................... 39
      6.2.2    GO Station Traffic ...................................................................................... 40
      6.2.3    Traffic Volumes .......................................................................................... 41
      6.2.4    Pedestrian and Cycling Volumes ................................................................ 43
      6.3      Strategic Screenline Analysis ...................................................................... 46
      6.4      Road Network Alternatives ........................................................................ 48
      6.5      Operational Assessment ............................................................................ 49
      6.5.1    South Service Road Analysis ....................................................................... 50
      6.5.2    Casablanca Boulevard & North Service Road Analysis ................................ 50
      6.5.3    QEW Interchange Analysis ......................................................................... 50
      6.5.4    Casablanca Boulevard & South Service Road Analysis ................................ 52
      6.5.5    Casablanca Boulevard / Main Street Intersection Analysis ......................... 54
      6.5.6    South Service Road & GO North Parking Lot Access Analysis ..................... 56
      6.5.7    Active Transportation Assessment ............................................................. 57

7.0   Conclusions and Recommendations                                                                                   60

      Niagara Region
      Detailed Transportation Assessment
      October 2018 - 18-7650
Table of Contents             iii

Figures
Figure 1: Grimsby GO Train Station Conceptual Plan .................................................. 3

Figure 2: Study Area ................................................................................................... 4

Figure 3: Existing Road Network ................................................................................. 8

Figure 4: Existing Traffic Volumes ............................................................................. 11

Figure 5: Strategic Analysis Screenlines .................................................................... 22

Figure 6: 2018 PM Peak Hour Screenline Analysis – North-South Travel .................. 27

Figure 7: 2021 Base Road Network Lane Geometry and Traffic Control ................... 31

Figure 8: 2021 Traffic Volume Forecast .................................................................... 35

Figure 9: 2041 Traffic Volume Forecasts ................................................................... 42

Figure 10: 2041 Pedestrian Volume Forecasts .......................................................... 44

Figure 11: 2041 Cycling Volume Forecasts ................................................................ 45

Figure 12: 2041 Screenline Analysis – North-South Travel ........................................ 46

Figure 13: Alternatives 1A, 1B, 1C, 1D Lane Configuration and Traffic Control ......... 49

Figure 14: 2021 Recommended Lane Configuration and Traffic Control ................... 62

Figure 15: 2041 Recommended Lane Configuration and Traffic Control ................... 64

Niagara Region
Detailed Transportation Assessment
October 2018 - 18-7650

Table of Contents           iv

Tables
Table 1: External Station CAGR by Station Area ........................................................ 13

Table 2: Trip Generation Rates ................................................................................. 14

Table 3: Summary of Land Use Growth and Person Trip Generation ........................ 14

Table 4: Niagara GO Mode Share of Total Travel Demand during Peak Hour in
         “Main” and “Off” Direction ........................................................................ 16

Table 5 – 2041 Peak Hour GO Rail Ridership ............................................................. 17

Table 6 - 2041 Peak Period GO Rail Ridership ........................................................... 17

Table 7: Mode Share and Walking Distance from Existing GO Stations ..................... 18

Table 8 - Mode Share from Existing GO Stations ...................................................... 18

Table 9 - Trip per capita in 800m buffer ................................................................... 18

Table 10: Niagara GO Station Mode Share (High Ridership Scenario) ....................... 19

Table 11: Vissim Model Calibration .......................................................................... 25

Table 12: Existing Conditions Operational Assessment Results ................................. 29

Table 13: 2021 Background Growth ......................................................................... 33

Table 14: GO Station Auto Traffic Forecasts for AM and PM Peak Hours(2021) ........ 33

Table 15: 2021 QEW Interchange Analysis Results ................................................... 36

Table 16: 2021 Casablanca Boulevard & South Service Road Analysis Results .......... 37

Table 17: 2021 South service Road & GO North Parking Lot Analysis Results ........... 38

Table 18: 2041 Background Traffic Volume Growth ................................................. 40

Table 19: GO Station Auto Traffic Forecasts (2041) .................................................. 41

Table 20: 2041 Casablanca Boulevard & North Service Road Analysis Results .......... 50

Table 21: 2041 QEW Interchange Analysis Results ................................................... 52

Niagara Region
Detailed Transportation Assessment
October 2018 - 18-7650
Table of Contents       v

Table 22: 2041 Casablanca Boulevard & South Service Road Analysis Results .......... 54

Table 23 – Casablanca and Main Street West Analysis Results ................................. 55

Table 24: 2041 Casablanca Boulevard & GO North Parking Lot Analysis Results ....... 57

Appendices
A         Existing Traffic Counts
B         Screenline Assessment
C         Vissim Results

Niagara Region
Detailed Transportation Assessment
October 2018 - 18-7650
1.0 Introduction 1

1.0   Introduction
      In 2018, Niagara Region retained Dillon Consulting to provide consulting engineering
      services for the detailed transportation assessment and municipal class environmental
      assessment (EA) for Casablanca Boulevard, in the Town of Grimsby (Town). Situated
      alongside the southern shores of Lake Erie, the Town’s population was approximately
      27,000 1 while Niagara Region’s (Region’s) population was approximately 450,0002 as
      estimated in the 2016 Census. The Region’s employment was approximately 203,000
      jobs 2.

      In support of future population and employment growth within the Town and the
      planned construction at the Grimsby GO Train Station in the southwest quadrant of the
      intersection of Casablanca Boulevard and South Service Road, the adjacent
      transportation network was assessed in terms of traffic operations under existing and
      future conditions. The detailed transportation assessment is documented within this
      report and shall act in support to the Environmental Study Report (ESR) for Casablanca
      Boulevard.

      While this report is focused on the needs of the Casablanca Boulevard corridor, it is
      noted that the transportation analysis completed for this project also considered east-
      west travel needs including the possibility for the extension of Livingston Avenue. The
      results of this parallel work are documented in a separate report in support of the
      Livingston Avenue Extension EA Study.

1.1   Purpose
      The purpose of the EA project is to identify the transportation infrastructure
      requirements, timing, costs and associated approvals to address the area’s projected
      growth and implementation of a GO Station to be located on the south west corner of
      South Service Road and Casablanca Boulevard. This report documents the detailed
      transportation analysis undertaken to identify existing and future problems, assess

      1   Statistics Canada, Census 2016, Census Profile: Grimsby, ON
      2   Statistics Canada, Census 2016, Census Profile: Niagara Region, ON

      Niagara Region
      Detailed Transportation Assessment
      October 2018 - 18-7650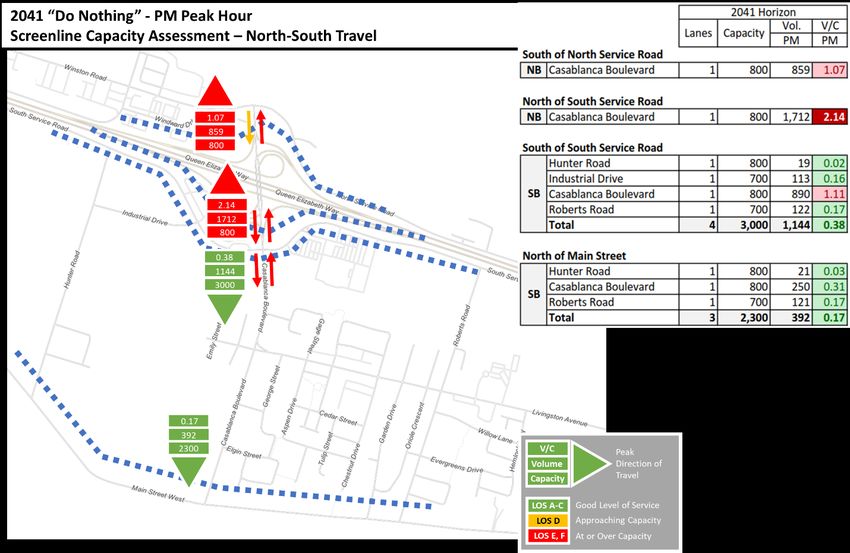
1.0 Introduction 2

      alternatives to address those problems, and identify preferred mitigation strategies for
      creating a sustainable future multi-modal transportation network.

1.2   Background
      Situated immediately south of the Queen Elizabeth Way (QEW), the Canadian National
      Railway (CNR) Grimsby Subdivision divides the town from its waterfront communities
      and its central business district and rural lands south of the Niagara Escarpment. As of
      today, the rail line currently services predominantly freight traffic; however, Metrolinx
      plans to extend the GO Train Commuter Rail service as far as Niagara Falls from the
      existing terminus in Hamilton. As part of the extension, stations are being planned and
      designed for Grimsby, St. Catharines, and Niagara Falls with a potential fourth station to
      be situated in Beamsville, a community located within the Town of Lincoln.

      The Grimsby GO Train Station is to be located in the southwest quadrant of the
      intersection of Casablanca Boulevard and South Service Road; between the QEW and
      the Grimsby Rail Subdivision. The station is expected to interface with the local
      transportation network through the inclusion of active transportation facilities such as
      sidewalks and multi-use path connections, parking facilities, kiss-and-ride facilities, and
      connections to local transit services. Figure 1 illustrates a conceptual site plan for the
      Grimsby Go Train Station.

      Niagara Region
      Detailed Transportation Assessment
      October 2018 - 18-7650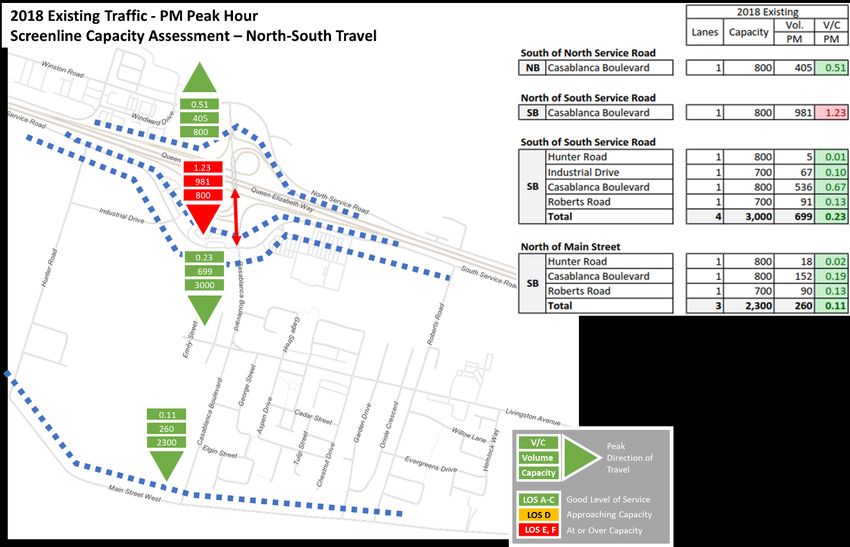
1.0 Introduction 3

                         Figure 1: Grimsby GO Train Station Conceptual Plan

      The addition of the GO Train service and associated connections to the local
      transportation network is expected to impact local travel patterns, including at the QEW
      / Casablanca Boulevard interchange.

      The interchange gives access to developing residential areas north of QEW, and also
      serves to connect those areas to the Town of Grimsby, via Casablanca Boulevard. The
      Town of Grimsby is expected to experience significant population and employment
      growth in the future, putting increased travel demand on study area roadways.

1.3   Study Area
      To capture the impacts of development, the study area under assessment is bounded to
      the north by North Service Road, the east by Casablanca Boulevard, the south by Main
      Street West, and the west by Oakes Road. Contained within these lands are various land
      uses including, but not limited to, medium density residential north of the QEW,
      commercial and industrial south of the QEW, low to medium density residential in the
      southeast, and undeveloped lands with pockets of low density residential in the
      southwest. The study area and associated intersections explicitly assessed are presented
      within Figure 2.

      Niagara Region
      Detailed Transportation Assessment
      October 2018 - 18-7650
1.0 Introduction 4
Figure 2 illustrates the study area and study area intersections.
Figure 2: Study Area
Niagara Region
Detailed Transportation Assessment
October 2018 - 18-76501.0 Introduction 5
1.4 Existing Transportation Network
Streets and roads in the study area include:
Casablanca Boulevard is a minor arterial street running north-south from Main Street
West to North Service Road. The AADT (2017) for Casablanca Boulevard was 12,000
between South Service Road and Livingston Boulevard and 5,400 between Livingston
Boulevard and Main Street West. Casablanca Boulevard is the only road in the study
area that has an interchange with the QEW (Oakes Road—to the west—crosses QEW at
a flyover, but does not include ramps to access QEW). Casablanca Boulevard has a two
lane cross-section, with added turning lanes at North Service Road, the QEW ramp
terminals, South Service Road, and at Livingston Avenue. The posted speed limit is 60
km/h. A sidewalk is provided on the east side from Main Street West to the south ramp
terminal at the QEW interchange. The rail crossing at the Grimsby subdivision has
crossing gates. South of the Grimsby rail subdivision the land along Casablanca
Boulevard is developed with fronting single family homes with driveway access to
Casablanca Boulevard. North of the Grimsby rail subdivision, large parcels are developed
with industrial and commercial land uses. Casablanca Boulevard is also known as
Regional Road 10, but will be referred to simply as Casablanca Boulevard for the
purposes of this report.
Livingston Avenue is a three-lane collector street running east-west from west of
Livingston Avenue through downtown Grimsby and continuing east as Main Street East.
The AADT (2017) of Livingston Avenue is 9,100 to the east of Casablanca Boulevard.
Livingston Avenue has a two-way left-turn lane and painted cycle lanes in both
directions. The posted speed limit is 50 km/h. Sidewalks are provided on both side of
Livingston Avenue through the study area. Lands along Livingston Avenue are developed
with fronting single family homes, many with driveway access to Livingston Avenue.
Livingston Avenue is also known as Regional Road 512, but will be referred to simply as
Livingston Avenue for the purposes of this report.
Queen Elizabeth Way (QEW) is a six-lane divided freeway running east-west through
the study area. The cross-section includes wide, paved shoulders, and a Jersey barrier
median. The AADT (2016) for the QEW was 107,100 and 112,300 to the east and west of
Casablanca Boulevard, respectively. Through the study area, the posted speed limit is
100 km/h. The cross-section includes service roads on each side of QEW. The service
Niagara Region
Detailed Transportation Assessment
October 2018 - 18-76501.0 Introduction 6 roads allow for two-way traffic, with two-lane cross-sections and 50 km/h posted speed limits. Lands adjacent to the service roads are developed with a mix of industrial and commercial developments, with multi-family residential development in the northwest part of the study area. Main Street West is a minor arterial street running east-west from Hamilton, through downtown Grimsby and further east to St. Catharines. The AADT (2017) for Main Street West is 7,000 to the west of Casablanca Boulevard and 7,600 to the east of Casablanca Boulevard. Through the study area, Main Street West has a two-lane cross-section, with paved shoulders and a posted speed limit of 70 km/h between Oakes Road and Hunter Road, 60 km/h between Hunter Road and Casablanca Boulevard, and 50km/h to the east of Casablanca Boulevard. A sidewalk is provided on the north side through the study area. From Casablanca Boulevard to the east, Main Street West runs along the bottom of a steep slope. Lands along Main Street West are developed with backing single family homes on the north side and fronting single family homes on the south side. West of Casablanca Boulevard, Main Street West curves to the north, and development along the road is mostly sparse single family residential, with several parcels used for agriculture or industrial use. Main Street West is also known as Regional Road 81, but will be referred to simply as Main Street West for the purposes of this report. North Service Road is a two-lane minor arterial street running east-west along the majority of the QEW in Niagara Region. AADT was not available for North Service Road. No sidewalk or cycling infrastructure is present along North Service Road within the bounds of the study area. To the east of Casablanca Boulevard, North Service Road provides occasional driveway access to commercial and residential properties and local roads. To the west of Casablanca Avenue, North Service Road is quickly being developed to accommodate a range of commercial and residential development. A traffic control signal was recently installed at the intersection of North Service Road with Casablanca Boulevard. South Service Road is a two-lane minor arterial road that provides access to a significant amount of big box commercial development (highway rest area, car dealers, grocery, home improvement, fast food) and light industrial / warehousing uses within the study area. AADT (2017) on South Service road was 6,700 and 4,100 to the east and west of Casablanca Boulevard, respectively. As with North Service Road, South Service Road Niagara Region Detailed Transportation Assessment October 2018 - 18-7650
1.0 Introduction 7

runs parallel to the QEW along essentially its whole length within the Niagara Region.
Auxiliary turning lanes are provided in the vicinity of major commercial properties and
at major intersections (e.g., Casablanca Boulevard). Within the study area, no sidewalks
or cycling infrastructure are provided along South Service Road.

Oakes Road is a two-lane collector street running north-south from south of Main Street
West to Winston Road, north of North Service Road. AADT was not available for Oakes
Road. A sidewalk is provided on the east side between Main Street West and the CNR
Grimsby rail subdivision. Several single family homes front onto Oakes Road between
Main Street West and the CNR Grimsby rail subdivision. Additionally, Smith School, a
Kindergarten to Grade School, fronts onto Oakes Road North just south of the rail line.
The rail crossing at the Grimsby subdivision has crossing gates. North of the Grimsby
subdivision to the QEW, adjacent lands are largely undeveloped, with the exception of
an industrial development south of the QEW. Oakes Road has a grade-separated
crossing over the QEW, with multi-family residential development to the east on the
north side of the QEW.

Hunter Road is a two-lane collector street running north-south from Main Street West
to South Service Road. AADT was not available for Hunter Road. There are no sidewalks,
and ditches are present on both sides, leading pedestrians to walk on the pavement.
Lands along Hunter Road are developed with fronting single family residential homes at
the south towards Main Street West. Further north to the Grimsby subdivision, adjacent
lands are undeveloped. The rail crossing at the CNR Grimsby subdivision has crossing
gates. Lands north of the Grimsby subdivision to the QEW South Service Road are
developed with industrial and commercial land uses.

Figure 3 illustrates the existing road network, lane configurations at intersections, and
traffic control at intersections under existing conditions.

Niagara Region
Detailed Transportation Assessment
October 2018 - 18-7650
1.0 Introduction 8

                                     Figure 3: Existing Road Network

Niagara Region
Detailed Transportation Assessment
October 2018 - 18-7650
1.0 Introduction 9
1.4.1 Active Transportation Infrastructure
The main walking infrastructure in the study area is the aforementioned sidewalks along
the arterial and collector streets. Additionally, some local streets include sidewalks, and
many neighborhoods include paths connecting streets across park space.
Dedicated cycling infrastructure in the study area is limited to the cycle lanes on
Livingston Avenue. Main Street West has shoulders at least 1.0 m wide in all sections,
with widths over 2.0 m in many sections. This provides some utility to cyclists, especially
given the long extent of Main Street West, from Hamilton to the west to St. Catharines
to the east.
The QEW interchange has several high-speed, free-flowing or yield-controlled ramps
which are intimidating for pedestrians and cyclists. The Casablanca Boulevard &
Livingston Avenue intersection has a westbound right turn channel and the intersection
with two-way stop-control; the westbound right turn channel can be intimidating for
pedestrians and cyclists and the lack of a traffic signal prohibits pedestrians and cyclists
from safely crossing Casablanca Boulevard. The Town of Grimsby has expressed a desire
to improve active transportation connections at these locations.
1.4.2 Transit Service and Infrastructure
In the study area, GO Transit operates a park and ride and bus route 12 between
Niagara Falls and Burlington where it connects to the GO Train. The park and ride is
located on the northwest corner of the Casablanca Boulevard and SSR intersection. GO
bus route 12 operates on weekdays between 4:54 AM and 12:24 AM with service
approximately every 30-45 minutes during peak periods. The route operates primarily
along the QEW and uses Casablanca Boulevard and SSR to access the park and ride lot.
Buses use a bus loop to turn around and access the QEW / Casablanca Boulevard
interchange.
Niagara Region
Detailed Transportation Assessment
October 2018 - 18-76501.0 Introduction 10
1.5 Traffic Data
Niagara Region provided traffic count data to use for the analysis in two forms:
• 8-hour turning movement counts (TMC) - all TMCs were collected on Wednesday,
May 9, 2018
• 24-hour Automated Traffic Recorder data (ATR) – collected between May 5 and May
10, 2018
Figure 4 illustrates the existing traffic volumes used for the analysis. Appendix A
contains the full traffic counts.
In addition, traffic signal timing and phasing plans were received from Niagara Region
for applicable intersections within the study area. Dillon’s previous work in the area
(Niagara Go Hub and Transit Stations Study, 2017) also included field visits in the study
area, which informed the understanding of existing conditions and issues in the study
area.
Niagara Region
Detailed Transportation Assessment
October 2018 - 18-76501.0 Introduction 11
Figure 4: Existing Traffic Volumes
Niagara Region
Detailed Transportation Assessment
October 2018 - 18-76501.0 Introduction 12
1.6 Niagara GO Hub and Transit Stations Study
Dillon completed an analysis of future GO Rail service and mobility hubs in 2017 for
Niagara Region. The study was known as the “Niagara GO Hub and Transit Stations
Study” 3 (herein referred to as NGHTSS). This study examined the expansion of GO Rail
service through Niagara Region connecting Hamilton’s West Harbour GO station to
Niagara Falls. Four proposed stations were included in the study:
• Grimsby GO Station (2021 projected opening)
• St. Catharines GO Station (2023 projected opening)
• Niagara Falls GO Station (2023 projected opening)
• Beamsville GO Station (No official timetable for opening)
The foundations of the NGHTSS report, particularly as they relate to the future land use,
regional and local travel behaviour, and GO Rail service, serve as foundational elements
for the transportation assessment for the Casablanca Boulevard EA. This section
summarises the inputs related to background regional growth, changes to local land use,
and forecasted rail ridership presented in the preceding report. Section 3 of the
NGHTSS report should be referenced for further details.
1.6.1 Background Growth
Background traffic growth in the model represents the change in external-to-external
trips within the region traversing the study area. As opposed to a more generic, regional
growth factor applied uniformly to all sub-area models, a more targeted approach to
background growth was implemented. The purpose was to capture adjacent or external
study area regional growth not explicitly accounted for in the land use concepts internal
to the study area.
Growth in regional traffic in the four individual station study areas was calculated
through examination of outputs from Niagara Region’s EMME travel demand
forecasting model. The external roadway links (i.e., those at the edges of the individual
study areas) were examined to calculate a representative compound annual growth rate
(CAGR) for movement between external stations only (i.e., trips travelling through the
3 Dillon Consulting Limited, Niagara GO Hub and Transit Stations Study (June 2017)
Niagara Region
Detailed Transportation Assessment
October 2018 - 18-76501.0 Introduction 13
study area unrelated to local land use changes). Table 1 below summarises the findings
from Niagara Region’s model. Information for Grimsby is highlighted.
Table 1: External Station CAGR by Station Area
Station Study Area AM Peak Hour PM Peak Hour
Grimsby 2.4% 1.5%
Beamsville 1.4% 1.3%
St. Catharines 1.3% 1.3%
Niagara Falls 2.1% 1.0%
1.6.2 Local Land Use Growth
As part of the NGHTSS, Dillon developed land use concepts for the four station study
areas in consultation with Niagara Region, the local municipalities, and the general
public. The land use concepts specified the magnitude and distribution of population
and employment growth to the 2041 horizon year in the vicinity of the four sub-area
models. The land use concepts used the 2041 population and employment assumptions
developed for the Region of Niagara’s Transportation Master Plan model.
Trip generation rates were developed based on the outputs of Niagara Region’s travel
demand forecasting model to represent the changes in travel demand in the subarea
models created for each of the four study areas. These allowed the forecasted changes
in population and employment in the area to be used to project the growth in local
traffic related to land use changes in the area. The trip generation rates are summarized
in Table 2.
Niagara Region
Detailed Transportation Assessment
October 2018 - 18-76501.0 Introduction 14
Table 2: Trip Generation Rates
Trip Trip
Trip Trip
Productions Productions
Peak Hour Attractions (to) Attractions (to)
(from) (from)
Population Employment
Population Employment
AM 0.1464 0.0686 0.0413 0.2969
PM 0.0646 0.2856 0.1373 0.1384
The trip generation rates were applied to the forecasted growth in population and
employment to project the growth in travel demand related to land use changes in each
of the study areas. Table 3 summarizes the growth in population, employment, and
associated changes in person trips in each of the study areas. Information for Grimsby is
highlighted.
Table 3: Summary of Land Use Growth and Person Trip Generation
Land Use Land Use
AM AM PM PM
Station Study Growth Growth (2011-
Peak Peak Peak Peak
Area (2011-2041) 2041)
Hour Hour Hour Hour
Population Employment
Grimsby 4,750 1,870 988 902 1,009 1,093
Beamsville 1,300 950 307 403 426 372
St. Catharines 1,900 2,300 523 914 936 695
Niagara Falls 2,450 560 477 321 382 497
The person-trips calculated through this process were applied to existing year travel
demands to represent the change in local travel due to changes in land use.
Niagara Region
Detailed Transportation Assessment
October 2018 - 18-76501.0 Introduction 15
1.6.3 GO Station Ridership Forecasts
The final layer of demand representing the future condition were trips related to the
implementation of GO Rail service in the four study areas. These trips were
implemented and integrated with the other layers of travel demand accordingly.
The basis for the ridership forecasts stemmed from Metrolinx’s “Niagara Region GO
Expansion Study, Ridership Forecasts” 4 study, completed in March 2015. The forecasts
were completed using the 2031 horizon year for three GO Stations – Grimsby, St.
Catharines and Niagara Falls. These forecasts did not include a station at Beamsville, nor
did it forecast the potential for intra-regional trips within Niagara (e.g. Grimsby to St.
Catharines).
The Paradigm/MMM report developed Niagara GO mode share targets of total travel
demand in both a low and high scenario. The “low” scenario assumed a “business as
usual” condition with ridership primarily dependent on automobile access to the
stations, with no major local transit service improvements. The “high” scenario assumed
the implementation of Niagara Regional Council’s approved transportation strategic
priorities that included a commitment to strong transit supportive policies being in
place. The “high” scenario was chosen for application in the ridership forecasts and
mode share estimates, given the extended horizon year of 2041.
The mode share for regional rail trips as part of total travel demand determined as part
of the Metrolinx study was examined for reasonableness with respect to the four study
areas, given that the Metrolinx study did not consider intra-regional GO Rail trips (e.g.,
Grimsby to Niagara Falls) and that trips to and from Toronto would experience
significant travel distance without direct service (e.g., especially from Niagara Falls), the
mode share for trips to Toronto was disproportionately high. Table 4 below summarizes
the modified mode shares of overall travel to regional centres from Urban and Outlying
areas of Niagara Region.
4 Paradigm / MMM, Niagara Region GO Expansion Study Ridership Forecasts, March 2015
Niagara Region
Detailed Transportation Assessment
October 2018 - 18-76501.0 Introduction 16
Table 4: Niagara GO Mode Share of Total Travel Demand during Peak Hour in “Main”
and “Off” Direction
Outlying
Origin / Urban Niagara Urban Niagara Outlying
Niagara
Destination “Main” “Off” Niagara “Off”
“Main”
Hamilton 5.2% 4.2% 1.3% 1.0%
Burlington /
2.6% 2.1% 0.3% 0.3%
Oakville
Mississauga 2.6% 2.1% 0.3% 0.3%
Toronto 8.9% 7.1% 2.7% 2.1%
Niagara Region 1.0% 1.0% 0.1% 0.1%
Two estimates for future ridership were forecasted for the four station areas: Base and
High. The Base scenario represented a ‘realistic’ forecast of ridership for the new
service. The High scenario expanded upon the Base scenario to examine potential risks
with the following additional assumptions:
• Utilized the Base Ridership Scenario numbers as basis and doubled ridership to
account for higher quality GO service and other unknowns;
• Modified to more auto-centric mode share to account for less realization of
active mode and transit mode share targets to access / egress each GO Station;
• Increased Beamsville ridership due to likelihood of residents in northeast St.
Catharines adjacent to QEW driving to Beamsville instead of the St. Catharines
GO Station (assumed approximately 27% of St. Catharine GO ridership)
Niagara Region
Detailed Transportation Assessment
October 2018 - 18-76501.0 Introduction 17
Table 5 summarizes the peak hour and peak period travel data arising from this process
for Grimsby.
Table 5 – 2041 Peak Hour GO Rail Ridership
Direction to / AM Peak Hour AM Peak Hour PM Peak Hour PM Peak Hour
from On Off On Off
East 13 11 15 16
West 368 149 184 433
Total 381 161 199 449
Table 6 - 2041 Peak Period GO Rail Ridership
Direction to / AM Peak AM Peak PM Peak PM Peak
from Period On Period Off Period On Period Off
East 36 31 40 42
West 1012 411 496 1168
Total 1048 442 536 1209
1.6.3.1 Station Area Mode Share
Mode share estimates to/from each GO Station where based on experience from other
existing GO Stations in the network, addressing the potential for active modes first, local
transit connections second, and automobile traffic third. Table 7 illustrates the existing
mode share to a number of GO Stations, along with the population within walking
distance of each GO Station.
Niagara Region
Detailed Transportation Assessment
October 2018 - 18-76501.0 Introduction 18
Table 7: Mode Share and Walking Distance from Existing GO Stations
Markham Downtown
Quantity Bramalea Port Credit Burlington Milton Newmarket
Centre Brampton
AM Peak
Period 2,750 1,940 2,420 2,460 600 2,310 2,060
Departures
Pop. within
800 7,800 3,600 4,200 5,100 1,400 6,800
800m walk
People per
4 41 18 21 26 7 34
ha
Table 8 - Mode Share from Existing GO Stations
Markham Downtown
Mode Share Bramalea Port Credit Burlington Milton Newmarket
Centre Brampton
Walk 0% 26% 6% 2% 15% 1% 8%
Drive 66% 50% 70% 71% 50% 65% 53%
Drop Off 20% 10% 10% 18% 26% 17% 26%
Car Pool 2% 2% 2% 0% 0% 3% 2%
Public
11% 11% 10% 9% 7% 14% 10%
Transit
Bike 1% 1% 2% 0% 2% 0% 1%
Total 100% 100% 100% 100% 100% 100% 100%
Table 9 - Trip per capita in 800m buffer
Markham Downtown
Mode Bramalea Port Credit Burlington Milton Newmarket
Centre Brampton
Walk 0.00 0.06 0.04 0.01 0.02 0.02 0.02
Niagara Region
Detailed Transportation Assessment
October 2018 - 18-76501.0 Introduction 19
The characteristics for the existing stations were examined and compared to the four
station study areas to create reasonable mode share estimates. Table 10 shows the
resulting mode share values for the four stations for the high ridership scenario. Values
for Grimsby are highlighted.
Table 10: Niagara GO Station Mode Share (High Ridership Scenario)
Travel Mode to
Grimsby Beamsville St. Catharines Niagara Falls
Station
Drive and Park 74% 71% 69% 67%
Walk 5% 8% 5% 7%
Kiss and Ride 15% 15% 15% 15%
Local Transit 5% 5% 10% 10%
Bicycle 1% 1% 1% 1%
1.6.3.2 Application of Ridership in Station Areas
The person trips generated by the ridership forecasts were applied to the station area
models using the mode share distributions shown in Table 10. The overall level of trip-
making was maintained in the model to avoid any incidence of double counting though
subtraction of an equivalent number of trips for each mode from the background and
land use growth forecasted travel demand, as necessary to represent the likely travel
patterns for each mode, as follows:
• Trips originating/destined within an 800m network walking distance based on
existing pedestrian facilities were assumed to be primarily completed on foot
• Bicycle and local transit trips were assumed to primarily travel to/from the area
beyond the 800m walking buffer, as they are conducive to longer trips
• Auto trips in the area (park, and pick up / drop off) were assumed to generally
maintain existing longer distance trips within the study area (e.g., to/from QEW)
Niagara Region
Detailed Transportation Assessment
October 2018 - 18-76502.0 Approach 20
2.0 Approach
While it was important to understand the current performance of the transportation
network under the existing conditions to set a benchmark for comparison, it was equally
important to understand the performance at key milestones based on growth and
development. The following planning horizons were selected:
• Existing Conditions Baseline (Base Year, 2018)
• GO Station Opening Day (Short-Term Horizon Year, 2021)
• Full-Development of North Grimsby (Long Term Horizon, 2041)
The 2041 horizon was selected to reflect Niagara Region’s intent to design for 2041 to
accommodate all currently planned growth and development to ensure the long term
needs for transportation are met.
Consideration of these three horizons allowed for assessment of strategic and
operational transportation needs to ensure that the transportation network is able to
accommodate the planned growth. Therefore, the study was completed using the
following approach:
• Consider Existing Conditions including street and road characteristics, active
transportation infrastructure, and traffic volumes. Also assess and identify existing
issues and solutions at the strategic level and at the operational level.
• Plan for 2021 Conditions to coincide with the start of GO Train service to and
through Grimsby. Identify the base road network (based on findings from
consideration of the existing conditions), forecast travel demand, and assess and
identify strategic and operational issues and solutions.
• Plan for 2041 Conditions considering continued GO Train service to and through
Grimsby, and future population and employment growth in north Grimsby. Identify
the base road network (based on findings from the existing and 2021 assessments),
forecast future travel demand, and assess and identify strategic and operational
issues and solutions related to the movement of cars, transit, cyclists, and
pedestrians.
• Record Conclusions and Make Recommendations on transportation infrastructure
development for the 2021 and 2041 horizons.
Niagara Region
Detailed Transportation Assessment
October 2018 - 18-76503.0 Methodology 21
3.0 Methodology
Each horizon was examined from two perspectives to determine the transportation
needs for the three analysis years:
• Strategic Analysis: The strategic analysis was conducted through examination of
screenlines drawn across important portions of the study area. The purpose of the
strategic analysis was to determine that the appropriate connections and capacity
are provided.
• Operational Analysis: The operational analysis was conducted using PTV Group’s
Vissim transportation microsimulation software. Microsimulation models are used to
model traffic operations where interaction between intersections and modes of
travel is an important consideration. The purpose of operational analysis was to
determine where intersection-level improvements may be required.
3.1 Strategic Screenline Analysis
A series of screenlines were developed to assess the capacity for vehicular movement in
the cardinal directions across important portions of the study area, as shown in Figure 5.
Niagara Region
Detailed Transportation Assessment
October 2018 - 18-76503.0 Methodology 22
Figure 5: Strategic Analysis Screenlines
Link capacities were assigned with a base capacity of 900 vehicles per hour per lane
(vphpl). The base capacity of 900 vphpl stems from guidance provided by the Highway
Capacity Manual 2010 (HCM2010), which lists the saturation flow rate in a metropolitan
area with population >250,000 as 1900 vphpl 5. This assumes an idealised condition that
“represents the maximum rate of flow for a traffic lane as measured at the stop line
during the green indication. The base saturation flow rate represents the saturation
flow rate for a traffic lane that 12 ft. wide and has no heavy vehicles, a flat grade, no
parking, no buses that stop at the intersection, even lane utilization, and no turning
vehicles.” Assuming a general condition at most intersections where 50% of available
green time (or all-way stop control) is given to each approaching corridor, it is
reasonable to assume that the capacity of a roadway is generally half of the saturation
flow rate, which results in a capacity of 950 vphpl. This should be further reduced by a
nominal amount to account for the presence of heavy vehicles (trucks, buses), mid-block
5 Transportation Research Board, Highway Capacity Manual 2010, p. 18-14, Exhibit 18-28
Niagara Region
Detailed Transportation Assessment
October 2018 - 18-76503.0 Methodology 23
turning vehicles, interaction with active transportation users, and inefficiencies at traffic
controls, all of which are specifically excluded from the HCM’s recommended saturation
flow rate. Therefore, 900 vphpl is a reasonable assumption for a base capacity for this
analysis. Professional judgement was subsequently applied to modify the base capacity
for roads in the study area based on the roadway type, level and type traffic control,
frequency of access, presence of on-street parking, and other factors that were
considered to have an effect on lane capacity.
The existing or forecasted volumes for the individual facilities across the screenline were
subsequently compared to the available capacity via a simple ratio of volume to capacity
(v/c ratio), which provides an indication of the sufficiency of the capacity for movement
across the screenline. Taken together, the facilities that cross the screenlines illustrate
the overall ‘carrying capacity’ for movement across the screenline. They serve to
illustrate where issues may be present for movement across the screenlines and for
individual facilities.
3.2 Microsimulation Analysis
Transportation microsimulation models present a realistic representation of how
various modes of travel will interact with each other, the roadway infrastructure, and
traffic controls present in a transportation network. They focus on the calibration of
behaviour of the various modes in these interactions to allow the individuals in the
model to react realistically as they move through the network in a single connected
environment. For this project, the Vissim microsimulation software was applied.
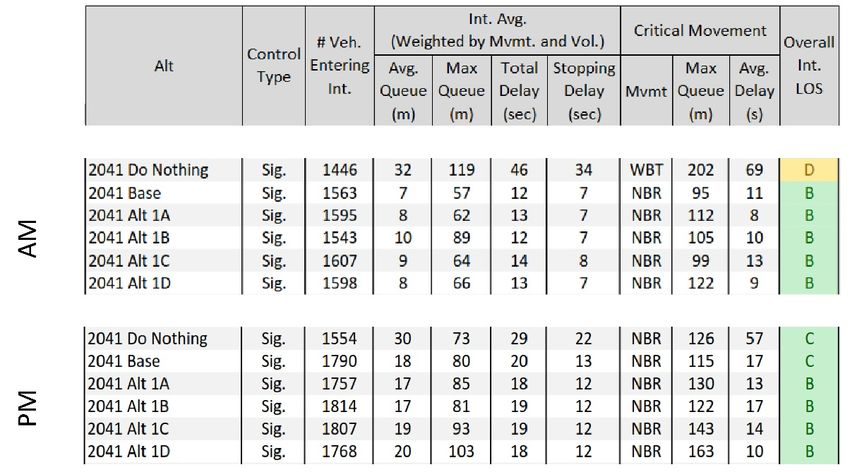
Outputs from the microsimulation analysis for this work included the average vehicle
delay, queuing (average and maximum), and resultant level of service for each turning
movement in the study area. These were compared across a range of infrastructure
alternatives to determine the necessary modifications to infrastructure, controls, or
traffic signal timing that will maintain an adequate level of service in the study area.
3.2.1 Microsimulation Model Calibration
Prior to testing alternatives, the Vissim model was developed and calibrated to existing
conditions. The model was calibrated according to the guidance provided in FHWA’s
“Traffic Analysis Toolbox Volume III: Guidelines for Applying Traffic Microsimulation
Niagara Region
Detailed Transportation Assessment
October 2018 - 18-76503.0 Methodology 24 Modeling Software” 6. Based on the data available from Niagara Region, the calibration involved the comparison of field-observed and modelled turning movement and link level volumes. The industry-standard GEH statistic was applied along with percentage and absolute differences to compare counted traffic volumes to simulated traffic volumes present within the microsimulation model. For the model application in this assessment, the FHWA guidance that a GEH value of 5.0 or less be met for 85% or more of turning movement and link count locations was met. Table 11 shows that this key criterion was met for the model among five other tests. 6 Federal Highway Administration, Traffic Analysis Toolbox Volume III: Guidelines for Applying Traffic Microsimulation Software, (2004), p. 64, Table 4 Niagara Region Detailed Transportation Assessment October 2018 - 18-7650
3.0 Methodology 25

                            Table 11: Vissim Model Calibration

One exception to the calibration of the model is the category examining the percentage
match of volume between 400 and 1200 turning vehicles, as shown in the PM Peak Hour
table, where one of the three records in this range did not match the criteria of less than
10% difference. It was determined that correction of the issue would not be possible
without modification of the zone structure in the model, which would break the
connection with modelling work done on the previous NGHTSS and make future
transfers and comparisons of model data more difficult.

Further investigation of the problematic record showed that the difference between the
modelled and observed values for this record was fewer than 100 vehicles (89) with a
GEH of 4.6. This indicated that the difference for this record was not significant and that
the overall calibration could be considered valid.

Niagara Region
Detailed Transportation Assessment
October 2018 - 18-7650
4.0 Existing Conditions Analysis 26
4.0 Existing Conditions Analysis
4.1 Strategic Screenline Analysis
Existing AM and PM peak hour traffic volumes were compared to the link capacities, and
streets with volume nearing capacity were identified. In nearly all cases the PM peak
hour volume to capacity ratios (v/c ratios) were higher than those in the AM peak hour,
so discussion herein is limited to the PM peak hour.
For the purposes of this analysis, a screenline or individual facility was deemed to be at
a ‘critical’ v/c ratio, when it exceeded 0.85, which indicates that the roadway is
operating at 85% of its available capacity or above and is providing a level of service
(LOS) of E or F to the roadway users. Above this threshold of 0.85, operations along the
road tend to degrade and become unstable, which can lead to fairly common (LOS E) or
chronic (LOS F) congestion issues.
Figure 6 shows the results of the screenline analysis for north-south travel in the PM
peak hour. The colored arrows show particular streets that were nearing or over
capacity. Appendix B contains the full screenline calculations.
Niagara Region
Detailed Transportation Assessment
October 2018 - 18-76504.0 Existing Conditions Analysis 27
Figure 6: 2018 PM Peak Hour Screenline Analysis – North-South Travel
The following points outline the findings for existing north-south travel in the PM peak
hour:
• South of North Service Road, north-south capacity on Casablanca Boulevard was
sufficient, with v/c ratios of no more than 0.51.
• North of South Service Road, Casablanca Boulevard was over capacity in both
directions, with v/c ratios of 1.19 northbound, and 1.23 southbound.
• South of the South Service Road, north-south capacity was sufficient on Hunter
Road, Casablanca Road, and Roberts Road. Each road had v/c ratios of 0.67 or
less.
• North of Main Street West, all streets had significant unused capacity, with v/c
ratios of 0.19 or less.
The screenline analysis of existing conditions showed generally sufficient capacity for
north-south travel, with the exception of hot-spots on Casablanca Boulevard between
North Service Road and South Service Road. These existing issues can be addressed
through the following link-level modifications:
Niagara Region
Detailed Transportation Assessment
October 2018 - 18-76504.0 Existing Conditions Analysis 28
• Casablanca Boulevard widened to a four-lane cross-section from North Service
Road to Livingston Avenue;
• Casablanca Boulevard widened to include a two-way left-turn lane from
Livingston Avenue to Main Street West.
These modifications were included in the base network considered in the 2021
assessment.
4.2 Operational Assessment
The purpose of the operational assessment is to identify issues with the existing road
network that may not be evident during the strategic assessment. Table 12 summarizes
the results of the analysis. Detailed results are available in Appendix C.
The Casablanca Boulevard and south ramp terminal and the Casablanca Boulevard and
South Service Road intersections show long queues and poor level of service. The
widening of Casablanca Boulevard to a four lane cross-section between North Service
Road and Livingston Avenue will assist in mitigating issues at the South Service Road but
this will not mitigate the issues with the south ramp terminal. It is recommended that
the north and south ramp terminals be signalized.
Otherwise, operations at the remaining study area intersections are acceptable and do
not show significant delays or queues.
Niagara Region
Detailed Transportation Assessment
October 2018 - 18-76505.0 2021 Conditions Analysis 29
Table 12: Existing Conditions Operational Assessment Results
*The maximum queue listed in the table may be related to a blocked condition at an adjacent movement
5.0 2021 Conditions Analysis
A 2021 scenario was developed to represent conditions when GO Train service is
extended to and through Grimsby. A base road network was developed based on the
findings from the assessment of the existing road network. Future travel demand was
forecast to represent the addition of GO Train service to and through Grimsby. The base
road network was then considered at strategic and operational levels to identify any
capacity or operational issues.
Niagara Region
Detailed Transportation Assessment
October 2018 - 18-76505.0 2021 Conditions Analysis 30
5.1 Base Road Network
The 2021 base road network included the following modifications based on the existing
conditions analysis and the desire to improve active transportation connections.
• Casablanca Boulevard widened to a four-lane cross-section from North Service
Road to South Service Road;
• Casablanca Boulevard widened to a four-lane cross-section with two-way left-
turn lane (TWLTL) from South Service Road to Livingston Avenue. The TWLTL will
be a short segment between the southbound left turn lane to Livingston Avenue
and the northbound left turn lane to SSR;
• Casablanca Boulevard widened to include a two-way left-turn lane from
Livingston Avenue to Main Street West;
• Traffic signals installed at the north and south ramp terminals;
• Traffic signal installed at the intersection of Casablanca Boulevard & Livingston
Avenue; and,
• Separate southbound left and right turn lanes at the intersection of Casablanca
Boulevard and Main Street West.
The following modifications were included as part of the GO Train station conceptual
plan:
• Access to the GO Train station provided at a signalized intersection on South
Service Road.
Figure 7 illustrates the 2021 Base road network lane geometry and traffic control. Red
arrows or a red border indicate changes compared to the 2018 existing lane geometry
and traffic control.
Niagara Region
Detailed Transportation Assessment
October 2018 - 18-76505.0 2021 Conditions Analysis 31
Figure 7: 2021 Base Road Network Lane Geometry and Traffic Control
Niagara Region
Detailed Transportation Assessment
October 2018 - 18-76505.0 2021 Conditions Analysis 32
5.2 Travel Demand Forecasts
For this study, traffic forecasts were taken from the NGHTSS, as described in Section 1.6.
The NGHTSS accounted for background growth in Niagara Region’s EMME model, land
use concepts in the vicinity of the station area, and GO station ridership forecasts. The
only change to this work was to update the existing traffic volumes and the future
background traffic volumes using traffic counts from May 2018.
5.2.1 Background Growth
Background traffic growth was forecast by accounting for population and employment
growth within the study area and regional growth outside the study area.
Within the study area, population and employment growth forecasts were based on
land use concepts developed as part of the NGHTSS. Population and employment
forecasts for the 2021 horizon were not created as part of the NGHTSS, so the 2041
population and employment forecast were applied, assuming that half of this growth
would occur by the 2021 horizon. This is not overly conservative given the large
developments on North Service Road which are planned for occupancy by the 2021
horizon.
The population and employment forecasts were then converted to auto trips using auto
trip generation factors taken from the Niagara Region’s regional travel demand
forecasting model.
Niagara Region
Detailed Transportation Assessment
October 2018 - 18-76505.0 2021 Conditions Analysis 33
Regional growth outside of the study area was anticipated to be negligible between
2018 and 2021 and therefore it was ignored. Table 13 summarizes the 2021 background
growth assumptions and the resultant traffic volume growth.
Table 13: 2021 Background Growth
Growth AM Peak Hour PM Peak Hour
Type of Growth
Assumptions Growth Growth
+2,189 population
Within study area 557 611
+400 employment
Regional growth None 0 0
Total 557 611
5.2.2 GO Station Traffic
In the NGHTSS, GO Station Traffic forecasts were not created for the 2021 horizon, but
forecasts were created for “low” and “high” ridership forecasts for 2041 based on the
information in Metrolinx’s “Niagara Region GO Expansion Study, Ridership Forecasts”
study. The 2041 “low” ridership forecast was considered reflective of ‘opening day’
ridership for the 2021 horizon.
Table 14 summarizes the 2021 GO Station auto traffic forecasts. All station trips were
assigned to the north station access since the south station access will not exist by the
2021 horizon.
Table 14: GO Station Auto Traffic Forecasts for AM and PM Peak Hours(2021)
AM Peak AM Peak PM Peak PM Peak
Station Access
Hour Out Hour In Hour Out Hour In
North Station Access (South Service Road) 51 101 143 63
South Station Access (Livingston Avenue) 0 0 0 0
Total 51 101 143 63
Niagara Region
Detailed Transportation Assessment
October 2018 - 18-76505.0 2021 Conditions Analysis 34
5.2.3 Traffic Volumes
Figure 8 illustrates the 2021 traffic volume forecasts. The 2021 traffic forecast was
developed by adding existing traffic volumes, background growth, and GO station
traffic.
5.3 Strategic Screenline Analysis
The strategic assessment was not performed for the 2021 horizon due to the relatively
limited increase in vehicle traffic growth in the study area. The focus of the analysis was
on the operational assessment.
5.4 Operational Assessment
The microsimulation analysis identified the following discussion topics:
• Casablanca Boulevard & QEW Interchange
• Casablanca Boulevard & South Service Road
• South Service Road and GO North Parking Lot Access
Summary tables are presented in the sections below to discuss specific study area
issues. Full Vissim model outputs are provided in Appendix C.
5.4.1 QEW Interchange
Table 15 summarizes the results of the analysis. During the PM peak hour, the 2021 “Do
Nothing” analysis shows that the QEW ramp terminals are not able to process the
demand; the eastbound and westbound off-ramps experience long delays (2-4 minutes)
and queues (250-500 metres).
The analysis confirms the need to improve the QEW ramp terminals by the 2021
horizon. The 2021 Base road network analysis shows that traffic signals at the ramp
terminals will increase capacity and reduce delays and queues.
Niagara Region
Detailed Transportation Assessment
October 2018 - 18-7650You can also read