Papanui PAK'n Save Peer Review of Traffic Modelling - Christchurch City Council
←
→
Page content transcription
If your browser does not render page correctly, please read the page content below
Papanui PAK’n Save
                   Peer Review of Traffic Modelling

                                          November 2019

                                                            Ref: 2019-027
Papanui Pak'nSave Modelling Peer Review
                                                          © QTP Ltd 2019
V01a.Docx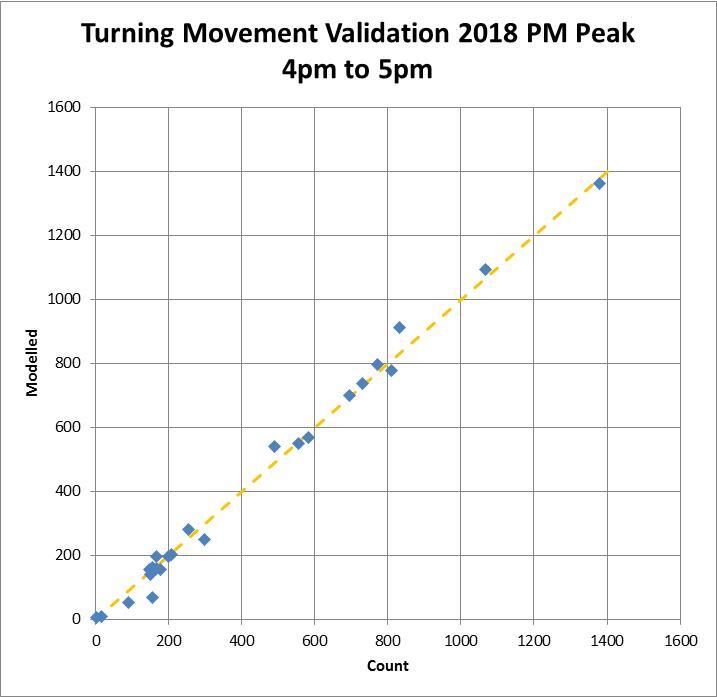
Papanui PAK’n Save – Peer Review of Traffic Modelling

This page is intentionally blank for double-sided printing.

                                                                        Ref: 2019-027
                                                                      © QTP Ltd 2019
Papanui PAK’n Save – Peer Review of Traffic Modelling
Document Issue Record
Version No Prepared By Description Date
00a John Falconer First issue. 7 November 2019
John Falconer Updated response field in Appendix A, 19 November 2019
01a
closed out issues and added Conclusion.
Document Verification
Role Name Signature Date
Preparation John Falconer 19 November 2019
Reviewer
Approval John Falconer 19 November 2019
Ref: 2019-027
Papanui Pak'nSave Modelling Peer Review Page i
© QTP Ltd 2019
V01a.DocxPapanui PAK’n Save – Peer Review of Traffic Modelling
This page is intentionally blank for double-sided printing.
Ref: 2019-027
Papanui Pak'nSave Modelling Peer Review Page ii
© QTP Ltd 2019
V01a.DocxPapanui PAK’n Save – Peer Review of Traffic Modelling
Contents
1 Introduction and Peer Review Scope............................................................................. 1
1.1 Background ....................................................................................................................... 1
1.2 Information Provided for Review........................................................................................ 2
1.3 Information Referred to in Review ..................................................................................... 2
1.4 Scope of Peer Review ....................................................................................................... 3
2 Calibration and Validation .............................................................................................. 4
2.4 Model Network and Zone System...................................................................................... 4
2.5 Base Year Demands ......................................................................................................... 5
2.6 2018 Base Year Calibration............................................................................................... 5
2.7 Turning Movements at Key Intersections........................................................................... 6
2.8 Travel Time ....................................................................................................................... 8
2.9 Future 2021 and 2031 Models ........................................................................................... 8
3 Fitness for Purpose....................................................................................................... 10
4 Model Limitations .......................................................................................................... 11
5 Completeness of Documentation ................................................................................. 12
5.4 Traffic Signal Optimisation............................................................................................... 12
5.5 2018 Base Year .............................................................................................................. 12
5.6 2020 Base Year .............................................................................................................. 12
5.7 2021 with Development ................................................................................................... 13
5.8 2031 with Development ................................................................................................... 13
5.9 Intersection and Travel time Comparisons ...................................................................... 13
5.10 New signalised Main North Road access ........................................................................ 14
5.11 Vehicle Travel Totals ....................................................................................................... 14
5.12 Summary of Modelled Effects of Proposal ....................................................................... 15
Appendices
Appendix A – Review Register
Ref: 2019-027
Papanui Pak'nSave Modelling Peer Review Page iii
© QTP Ltd 2019
V01a.DocxPapanui PAK’n Save – Peer Review of Traffic Modelling
This page is intentionally blank for double-sided printing.
Ref: 2019-027
Papanui Pak'nSave Modelling Peer Review Page iv
© QTP Ltd 2019
V01a.DocxPapanui PAK’n Save – Peer Review of Traffic Modelling
1 Introduction and Peer Review Scope
1.1 Background
1.1.1 QTP have been engaged collectively by Foodstuffs (South Island) Properties Ltd (FSIL)
and Christchurch City Council (CCC) to undertake a Peer Review of the transportation
modelling presented in the Integrated Transport Assessment (ITA) included1 within the
land use consent application2 to establish a PAK'nSAVE supermarket and self-service fuel
station on the application site at 171 Main North Road (Christchurch).
1.1.2 It is proposed that vehicle access to the site will be altered, including the addition of a
signalised intersection along Main North Road between the intersection with Cranford
Street and Northcote Road.
1.1.3 The transportation modelling presented in the ITA is sourced from an s-Paramics model
developed specifically to support the Application. The primary purpose of the modelling is
to indicate the traffic effects associated with the proposed development during a weekday
evening peak period (which has been identified as the most critical periods in terms of
network performance). This is to inform the Assessment of Effects in the Application.
1.1.4 I understand that prior to this review; transport experts representing FSIL have been
working collaboratively with CCC Transport Team members to address initial RFI items
raised relating to transport modelling. The agreed changes in methodology and reporting
are addressed implicitly in an updated ITA (subject to this review).
1.1.5 The future year demands have been extracted from Council’s CAST model by Council staff
and are agreed between the Applicant and Council. The choice of modelling platform s-
Paramics informed by CAST is also agreed between the Applicant and Council. Due to
this agreement, further consideration of these items is excluded from the peer review
scope.
1.1.6 As a result of recent transport modelling conferencing3 between the Applicant, CCC,
CTOC and NZTA’s experts, the transportation modelling has been revisited and a new
Technical Note prepared that supersedes the contents of section 8 (Transport Modelling
Assessment) of the ITA.
1
As Appendix F of the Application document.
2
The Pre-hearing Application and ITA as publicly notified can be found at: https://www.ccc.govt.nz/the-council/consultations-
and-submissions/haveyoursay/show/256
3
October 2019
Ref: 2019-027
Papanui Pak'nSave Modelling Peer Review Page 1
© QTP Ltd 2019
V01a.DocxPapanui PAK’n Save – Peer Review of Traffic Modelling
1.2 Information Provided for Review
1.2.1 This review is based primarily on the following information provided by FSIL:
A copy of the ITA as per the notified application (Appendix F)4, dated 18 July 2019
(hereafter referred to as the ITA).
Revised section 8 of the ITA technical note which is consistent with the post-
conferencing scenarios as agreed between all parties5, dated 25 October 2019
(hereafter referred to as the Technical Note).
Paramics model files6, dated 25 October 2019. This includes base year and future
year (2021 with and without development and 2031 with and without development) s-
Paramics modelling files (five scenarios including base year) which are consistent with
the post-conferencing scenarios to be presented in evidence as agreed between all
parties. The raw model outputs were not provided (to keep file sizes manageable).
A set of engineering drawings accompanying the application7, dated 23 August 2019
(hereafter referred to as the Site Plan).
1.3 Other Information Referred to in Review
1.3.1 The Peer Review has been undertaken in accordance with Engineering New Zealand's
Practice Note 2: Peer Review (ENZPN). The ENZPN usefully identifies key steps in the
peer review process and what should be covered in reporting. However the specialised
nature of traffic model build and Peer Review does not fit the 'types' of peer review
described in the ENZPN. In this regard, the (draft) Peer Review Process Technical Note
prepared by the New Zealand Modelling User Group (NZMUGs) is more pertinent and the
peer review has been conducted in accordance with the concluding points of that
document.
1.3.2 This includes the “review register” in Appendix A, which is set up to include all issue raised
by a Reviewer, the response of the Modeller and the resolution which may include
acceptance of the risk or professional disagreement.
1.3.3 NZTA Transport Model Development Guidelines (TMDG) have also been used to provide
guidance in relation to comparisons between modelled and observed data.
4
‘App F _ Integrated Transport Assessment _w.updated & signed safety audit 17.7.19.pdf”
5
‘Post-Conferencing Transport Modelling Assessment Technical Note.pdf’
6
‘Papanui PnS Final Paramics Models 23-10-2019.zip’
7
‘RMA-2018-2029-Appendix-B-Architectural-Plans.PDF’
Ref: 2019-027
Papanui Pak'nSave Modelling Peer Review Page 2
© QTP Ltd 2019
V01a.DocxPapanui PAK’n Save – Peer Review of Traffic Modelling
1.4 Scope of Peer Review
1.4.1 The agreed Peer Review brief limits the scope to specific components, summarised below:
1. Calibration and Validation – Checks that the models are suitably calibrated and
validated in accordance with NZ Transport Agency’s Transport Model Development
Guidelines (TMDG);
2. Fitness for Purpose – Confirmation whether (or not) the models are fit-for-purpose for
the primary purpose of informing an Assessment of Environmental Effects of the nature
and scale of the Application under the RMA;
3. Model Limitations – Note any limitations or gaps in the modelling undertaken that
might otherwise be reasonably expected to be included within the ITA;
4. Completeness of Documentation – Checks that the outputs presented in the ITA
(and technical note replacing section 8 of the ITA) are logical, robust and can be relied
upon by a decision maker under the RMA (acknowledging any limitations or gaps
identified above).
1.4.2 The remaining sections of this review specifically address each of the scope components
above. Any risks or matters potentially requiring resolution are identified in each case, and
also summarised in the Review Register in Appendix A, where the modelling team has
provided a response to address the issues and the peer reviewer has closed out those that
have been reasonably resolved.
Ref: 2019-027
Papanui Pak'nSave Modelling Peer Review Page 3
© QTP Ltd 2019
V01a.DocxPapanui PAK’n Save – Peer Review of Traffic Modelling
2 Calibration and Validation
2.1 The setup and calibration of the Paramics model is documented in Appendix A of the ITA.
No changes to this have been made as a result of conferencing.
2.2 A model base year of 2018 has been established and comparisons have been made
against surveyed traffic count data and travel times.
2.3 The comments below relate to various sections of Appendix A of the ITA using the same
sub-headings (in order).
2.4 Model Network and Zone System
2.4.1 It is noted (in ITA Figure A1.1) that the 2018 base model consists of 13 zones. This is
inconsistent with the future year models, which have 16 zones (as per ITA Figure A1.5).
The 3 extra zones in the future year models are:
Zone 14 – Winters Road and Fraser Street Residential Area (adjacent to Main North
Road and Cranford intersection).
Zone 15 – Meadow Street and Shearer Avenue area adjacent to Main North Road
south of Cranford Street (effectively proposed development of the Cranford Basin).
Zone 16 – Existing retail activity at the southwest corner of the Main
North/QEII/Northcote intersection.
2.4.2 It is highly unusual to have different zone systems in base and future years. There is a risk
that the additional zones may result in different traffic patterns or effects, even if the
underlying land-use assumptions and overall traffic generation remains the same. A
comparison of future traffic networks with the calibrated base then becomes problematic.
2.4.3 Multiple ‘car-parks’ (effectively ‘floating’ sub-zones) have been used for zones 11, 12, 13
and 158. This is understandable for zones 11 and 12 (the development site area), but not
for zones 13 and 15, which are residential areas. It would therefore be useful to
understand the rationale behind this approach, and why this was considered to be better
than other alternatives (e.g. increasing zone resolution and/or network detail, especially if it
is a proxy for Cranford Basin link).
2.4.4 In this particular model application, the primary purpose of the 2018 base year model is to
calibrate key network elements and vehicle characteristics based on ‘known’ traffic
volumes and conditions. Once these have been calibrated and applied to future years, the
base network is effectively discarded and serves no further purpose in the assessment of
environmental effects. Therefore, the risk to the Client associated with the 2018 base
zone discrepancies described above is considered to be low.
2.4.5 Documentation would however assist with understanding why different zone structures
were adopted and reassurance that that this will not significantly impact on the
assessment.
8
Zone 15 is included in future years only.
Ref: 2019-027
Papanui Pak'nSave Modelling Peer Review Page 4
© QTP Ltd 2019
V01a.DocxPapanui PAK’n Save – Peer Review of Traffic Modelling
2.4.6 Based on the above, the following items have been added to the Review Register in
Appendix A:
# Issues Raised – Model Network and Zone System Level of Client Risk
1 Inconsistent traffic zones between 2018 base and future models. Low
Justification or further explanation is recommended.
2 Further explanation of the rationale for applying car-parks to zones 13 Low
and 15 is recommended, including potential advantages and limitations
of this approach.
2.5 Base Year Demands
2.5.1 The documentation describes a manual method for establishing trip distribution patterns.
This method appears to be very similar to how the matrix estimation facility with Paramics
works. It would therefore be useful to know why the algorithm based matrix estimation
procedure was not used (i.e. what specific issues required a manual method to overcome),
or even better, why initial demands from CAST were not used (given that this approach
has been adopted for future years, it would make sense for the base as well).
2.5.2 As mentioned earlier in paragraph 2.4.4, for the purpose of model calibration (which is the
sole purpose of the 2018 Base model), the underlying trip patterns are not particularly
important (noting very limited route choice within this particular model) as long as the
turning movement flows and delays at each intersection are reasonably represented
(which appears to be the case here).
2.5.3 Therefore the risk to the Client is relatively low, however without improved documentation,
the level of risk perceived to a reader may be of concern.
# Issue Raised – Base Year Demands Level of Client Risk
3 A ‘manual’ trip matrix estimation procedure was adopted. Justification Low
or further explanation required why initial demands from CAST (as
adopted for future year models) were not used in conjunction with
matrix estimation where required to match observed counts.
2.6 2018 Base Year Calibration
2.6.1 It is noted that calibration was required for the following elements.
Preloading and queuing
Traffic signal timings (informed by SCATS data)
Reverse priority (suitably resolved by using ‘yellow box junctions’)
Link speed limits
Mean headway between vehicles
Main North Road south approach to Cranford Street network coding
2.6.2 It is apparent that careful consideration was given to each parameter to ensure observed
conditions are reflected. All of these adjustments appear to be necessary and are within
Ref: 2019-027
Papanui Pak'nSave Modelling Peer Review Page 5
© QTP Ltd 2019
V01a.DocxPapanui PAK’n Save – Peer Review of Traffic Modelling
reasonable limits.
2.7 Turning Movements at Key Intersections
2.7.1 Comparisons of modelled and observed turning movements at three intersections (Main
North/Northcote/QEII, Main North/Cranford and Main North/Vagues) have been provided.
2.7.2 There appears to be a reporting error in Tables A1.2 and A1.3 for the intersection totals,
where the column totals are either incorrect and or out of sync with the data above.
2.7.3 Values reported in the tables are summarised by three periods (4-5pm, 5-6pm and
combined as a total 4-6pm). The GEH values for the two hour period should be converted
to hourly equivalents (this has not been done); therefore the values reported for 4-6pm are
effectively overstated and not suitable for comparison with TMDG thresholds.
2.7.4 The reporting does not include any assessment made against the relevant criteria in the
TMDG (as is usual practice). In this particular case, criteria for model Type F (Small area
with limited route choice/corridor assessment) would apply. The guidelines state that the
following comparisons are generally expected:
Individual Tuning/Link GEH
XY Scatter Plots
Individual Turning Count Bands9
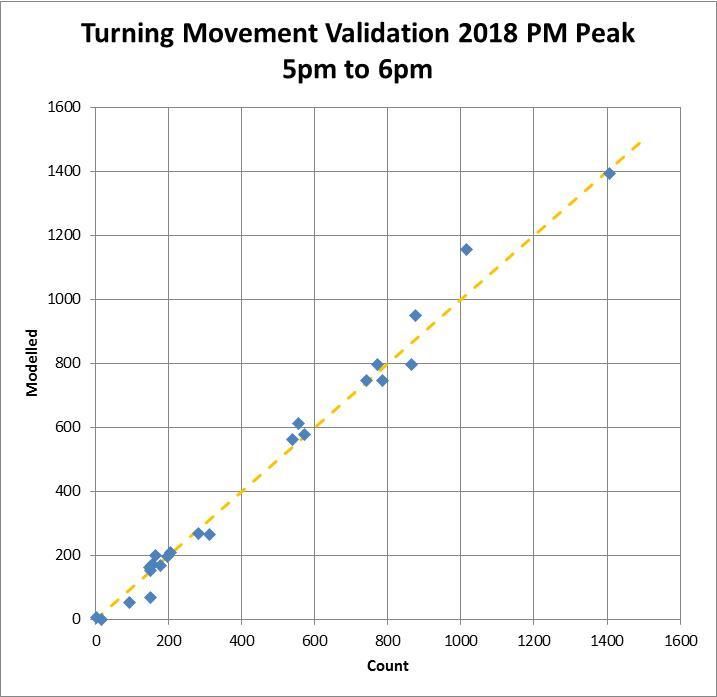
2.7.5 I have used the information provided in the ITA to make the above comparisons. Results
are set out below, where results meeting the target criteria are in green and those that are
just under are in orange:
Table 2-1: GEH Comparison
Measure Target Criteria Achieved 4-5pm Achieved 5-6pm Achieved 4-6pm
GEH < 5 (% Turns) > 95% 95% 92% 96%
GEH < 7 (% Turns) > 100% 100% 96% 96%
GEH 100% 100% 100% 100%
Table 2-2: Individual Turning Count Bands
Measure Target Criteria Achieved 4-5pm Achieved 5-6pm Achieved 4-6pm
95% 93% 93% 93%
400-2000 (12.5%) > 95% 100% 90% 100%
>2000 (250vph) > 95% 100% 100% 100%
Table 2-3: XY Scatter Plot (Summary)
Measure Target Criteria Achieved 4-5pm Achieved 5-6pm Achieved 4-6pm
2
R > 0.95 0.99 0.99 0.99
Line of Best Fit y= 0.97x – 1.03x y = 0.99x y = 0.98x y = 0.99x
9
TDMG state these are potentially useful rather than expected
Ref: 2019-027
Papanui Pak'nSave Modelling Peer Review Page 6
© QTP Ltd 2019
V01a.DocxPapanui PAK’n Save – Peer Review of Traffic Modelling
Figure 2-1: XY Scatter Plot (Data Points)
2.7.6 From these results, I conclude the following
A very high level of correlation is achieved between modelled and observed traffic
flows at the turning movement level.
The relevant TDMG are generally met. Where these criteria are not strictly met, they
are very close (and relate to just one or two turning movements at Main North Vagues
Road).
The ITA identifies and comments on the Vagues Road movements and I am satisfied
with this explanation (and was not particularly concerned about this movement
anyway).
2.7.7 In my opinion, the TDMG criteria are extremely ambitious; the target tolerances can often
exceed natural variations that occur in traffic counts between adjacent intersections.
2.7.8 I therefore consider that the level of validation/calibration achieved with respect to turning
movements is at the upper end of what can practically be achieved by any model.
2.7.9 So while I am more than satisfied with this modelling outcome, I note the following
reporting related issues that have been added to the Review Register in Appendix A:
# Issues Raised -Turning Movements at Key Intersections Level of Client Risk
4 Reporting error in Tables A1.2 and A1.3 for the intersection totals, High
where the column totals are either incorrect and or out of sync with the
row data above.
5 GEH values reported for 4pm to 6pm are incorrect because they have Medium
not been converted to hourly equivalents.
6 Comparisons not made with relevant TDMG criteria in ITA (however, Low
this has been resolved indirectly as part of this peer review).
Ref: 2019-027
Papanui Pak'nSave Modelling Peer Review Page 7
© QTP Ltd 2019
V01a.DocxPapanui PAK’n Save – Peer Review of Traffic Modelling
2.8 Travel Time
2.8.1 Comparisons of modelled and observed travel times along six main corridor routes through
the model area have been provided.
2.8.2 The reporting does not include any assessment made against the relevant criteria in the
TMDG (as is usual practice).
2.8.3 I have therefore made this comparison below. In this particular case, criteria for model
Type F (Small area with limited route choice/corridor assessment) have been adopted.
2.8.4 The guidelines state that the following comparisons are generally expected:
More than 90% of routes should be within 15% or 1 minute (if higher)
All routes should be within 25% or 1.5 minutes (if higher)
Journey time vs. distance graphs.
2.8.5 All reported routes are within 15% of observed, except the East to West route, where the
model is 30% faster than observed but the difference is less than 1 minute. A reasonable
explanation has also been provided in ITA Table A1.4 why this might be the case.
2.8.6 Because the model area is rather compact, journey time vs. distance graphs (while nice to
have) are not strictly necessary in this case. It would however be very useful if each route
distance (path length) could be included in ITA Table A1.4 so that the vehicle speeds can
be inferred (or also reported).
2.8.7 I agree with the ITA conclusion that “…the model generally reflects existing speed
conditions on the major links”. Additionally, I do not think that the model is significantly
different to the observed data on any particular route, and I am satisfied that the 2018 base
model is not consistently faster or slower than observed conditions (which indicates that a
reasonable level of calibration has been achieved).
# Issue Raised – Travel Time Level of Client Risk
7 Journey time vs. distance graphs have not been provided. As an Medium
alternative to providing these, it would be very useful if each route
distance (path length) could be included in ITA Table A1.4 so that the
vehicle speeds can be inferred (or ideally also reported)
2.9 Future 2021 and 2031 Models
2.9.1 There are very few details (other than in the introduction to the revised section 8 of the
ITA) about how CAST demands were applied to Paramics. It is simply mentioned that “the
CAST model was used to inform the future year demand scenarios.” This statement has
some ambiguity (e.g. whether any adjustments were made, other than altering trip
generation for the proposed supermarket?).
2.9.2 Inspection of the Paramics demand matrices indicate that demands at some external
locations can vary significantly between the base and development networks. Some of
Ref: 2019-027
Papanui Pak'nSave Modelling Peer Review Page 8
© QTP Ltd 2019
V01a.DocxPapanui PAK’n Save – Peer Review of Traffic Modelling
these differences imply wider network route changes beyond the Paramics model area
(e.g. an increase in trips originating from QEII Drive with a corresponding decrease from
Main North Road south external). Such changes are realistic and most likely reflect
alternative route choice available in CAST to avoid congestion on Main North Road (with
development). However, it also implies that there may be additional effects outside the
Paramics model area that are not currently being captured in the assessment of effects
(e.g. trips re-routing from Main North Road to QEII Drive must travel additional distance
not currently picked up in the assessment, and this missing ‘cost’ is likely to be similar to
travel time on the congested Main North Road route).
2.9.3 There also appears to be an overall reduction in vehicle trips at external locations for the
‘with development’ networks. At 2021 there are approximately 100 less two-way trips and
at 2031 there are approximately 50 less two-way trips crossing the model boundary in the
‘with development’ network. This indicates the number of vehicles that effectively avoid 10
the Paramics model area due to increased congestion.
2.9.4 Again, this may be a realistic model response. But consequently, performance of the ‘with
development’ network relative to the Base network may appear to be more favourable than
it would if the ‘missing’ diverted traffic was also included in the assessment.
2.9.5 This could possibly be addressed by normalising the existing results, so that they reflect
the same vehicle trip totals (with the only difference being the 20% primary trip generation
associated with the proposed development).
# Issue Raised – 2021 and 2031 Models Level of Client Risk
8 From the reporting in the revised section 8 of the ITA and Appendix A Medium
of the ITA, very few details are provided about how CAST demands
were translated into Paramics and whether any additional adjustments
were required (other than altering trip generation for the supermarket).
Further clarification through reporting would assist with understanding.
It currently appears that the adopted methodology results in additional
traffic effects outside the Paramics model area that are not currently
being captured in the assessment of effects.
9 There are some significant differences between the Base and with Medium
development network at the model external boundary, with a net
reduction of traffic in the ‘with development’ network. This implies that
some traffic is being pushed out beyond the Paramics model area and
the effects of this are not captured. Normalising the current outputs to
take this into account is recommended.
10
Most likely through reassignment in CAST
Ref: 2019-027
Papanui Pak'nSave Modelling Peer Review Page 9
© QTP Ltd 2019
V01a.DocxPapanui PAK’n Save – Peer Review of Traffic Modelling
3 Fitness for Purpose
3.1 The TMDG notes that a model that does not meet the target levels may still be suitable for
application if the discrepancies are acceptable due to known, noted, and accepted issues
(i.e. observed data limitations) and any larger discrepancies are concentrated away from
the areas of most importance to the appraisal. Conversely, a model which passes the
suggested acceptability levels but has significant discrepancies in key areas may be
unacceptable.
3.2 Whether a model is “suitably” calibrated or not is invariably be a subjective decision based
on the intended model purpose and implications on the level of risk in using model outputs
resulting from any constraints or limitations (noting that some of these are covered in the
following section 4).
3.3 Based on the adopted modelling methodology and confirmation that the model has been
calibrated and validated to a high standard, I am satisfied that the Paramics model is in
principle11 fit-for-purpose for informing an Assessment of Environmental Effects of the
nature and scale of the Application under the RMA.
11
It is important to note that while a model can be deemed fit for purpose, the actual effectiveness of the model is highly
dependent on how the model is applied in practice.
Ref: 2019-027
Papanui Pak'nSave Modelling Peer Review Page 10
© QTP Ltd 2019
V01a.DocxPapanui PAK’n Save – Peer Review of Traffic Modelling
4 Model Limitations
4.1 It is important to note that while the model has been deemed fit for purpose, the
effectiveness of the model is highly dependent on how the model is actually applied.
4.2 In the context of this assessment, a potential limitation is that delays are based on sets of
predefined ‘paths’. This can be problematic in some situations. If the path is too short,
then it might not pick up the full extent of queuing and delay. Conversely, if the path is too
long, then it may not pick up all potential sources of traffic and effectively have a reduced
or skewed sample. A trade-off is therefore required, which requires good judgment by the
modeller.
4.3 Queue lengths have not been observed or validated in the model. TDMG discussed
difficulty of this (and defining the queue in general). I am more comfortable with delay (as
adopted in the current assessment) being the preferred indicator for congestion and
network performance.
4.4 No weekend period model has been prepared. While the weekday evening peak has been
determined to be the most critical period, that should not necessarily imply that adverse
traffic effects won’t occur during weekends given the high level of traffic and different
patterns. This is also true for the morning peak, however it is likely to be less critical than
the weekend period.
4.5 Based on the adopted methodology of using CAST to estimate future traffic patterns, there
appears to be potential wider network effects that are not reflected within the Paramics
model (as described in section 2.9). A proposed work around to address this has been
recommended in that section.
4.6 The Paramics model used static signal timings whereas in reality these are dynamically
controlled using SCATS. This may result in reduced efficiency indicated by the model.
Similarly, complex human behaviour related to vehicle following, gap acceptance and lane
choice is modelled using a relatively few model parameters. These simplifications of reality
may also result in reduced efficiency indicated by the model.
4.7 The model does not necessarily provide an accurate prediction of what might occur in the
future (nor does it need to), but rather provides an objective indication of relative effects
based on very specific assumptions agreed for very specific scenarios.
4.8 Based on responses provided by the modelling team in Appendix A, it is apparent that a
side-effect of the adopted methodology12 is that there are several inconsistences between
the future year models with and without development related to traffic signal phasing at
Main North Road/QEII Drive/Northcote, small changes in offsets and green times and
CAST demands (reflecting minor wider area differences). While resulting model outputs
do reflect expected operation, these inconsistencies make isolation of development (only)
effects very difficult. Model outputs therefore need to be interpreted with this in mind.
12
Agreed between Abley and CCC.
Ref: 2019-027
Papanui Pak'nSave Modelling Peer Review Page 11
© QTP Ltd 2019
V01a.DocxPapanui PAK’n Save – Peer Review of Traffic Modelling
5 Completeness of Documentation
5.1 Section 2 of this review (Calibration and Validation) has identified several potential issues
relating specifically to documentation of Appendix A of the ITA. These will not be repeated
here (noting that they are also included in the Review Register in Appendix A).
5.2 This section checks that the outputs presented in the ITA and Technical Note are logical,
robust and can be relied upon by a decision maker under the RMA (acknowledging any
limitations or gaps identified in the preceding section 4).
5.3 The comments below relate to various sections of the Technical Note using the same sub-
headings.
5.4 Traffic Signal Optimisation
5.4.1 The ITA indicates that the proposed development is dependent on a revised layout of Main
North/Northcote/QEII intersection (with separate phases for north and south approaches
with remarked lanes allowing dual line right turn on the south approach).
5.4.2 It is mentioned in the ITA that “Preliminary tracking shows that the two vehicles can turn
side by side with adequate clearance (refer to Appendix B to the ITA). However, it is noted
that tracking was undertaken on an aerial image and that it should be undertaken on a
topography survey for accurate results”.
5.4.3 Given how critical this single issue is, I recommend that tracking is redone on a suitable
georeferenced base.
5.5 2018 Base Year
5.5.1 It would be useful if Table 1.2 of the Technical Note included distance information so that
speeds can be inferred (or implied average speeds added to the table). The reported
average excess travel times do however appear to be intuitively sensible.
5.5.2 Checks have been made against the latest CAST (v18) 2018 network, and reported traffic
flows are generally consistent.
5.6 2020 Base Year
5.6.1 Section 1 (a) of the technical note indicates that a key modelling assumption arising from
the conferencing is that the 2021 and 2031 permitted baseline includes traffic volumes
which are consistent with the existing Toll operations on the 2 Lydia Street site (which is
consistent with the current industrial zoning).
5.6.2 The 2020 Base demands for zone 10 (2 Lydia Street site) has zero modelled trips. It
appears that the pre-conferencing assumption that the site has been vacated and
construction of a college (referred to in section 3.7 of the ITA) has been retained instead of
adopting the revised permitted baseline agreed during conferencing.
5.6.3 The 2031 Base year however appears to reflect the baseline agreed during conferencing.
Ref: 2019-027
Papanui Pak'nSave Modelling Peer Review Page 12
© QTP Ltd 2019
V01a.DocxPapanui PAK’n Save – Peer Review of Traffic Modelling
5.7 2021 with Development
5.7.1 Figures 1.3 and 1.4 of the Technical Note have been checked in detail and appear to be
accurate and reasonable on all links that are common to the Base and Development
networks.
5.7.2 It is however noted that the increased development traffic is not displayed on the internal
development links in Figure 1.4. This could be confusing for readers (e.g. decision maker
under the RMA) because at the bandwidth scale shown, this ‘missing’ traffic is significant,
noting that the relevant values are indicated in Table 1.10 of the Technical Note.
5.7.3 The peak hour13 trip matrix demand associated with proposed supermarket (zones 12) is
411 vehicle trips to the site and 417 from the site resulting in 828 trips per hour. This is
less than the 870 (or 876 with fuel) trips (2way) set out in Table 7.1 (Trip Generation) of
the ITA.
5.8 2031 with Development
5.8.1 Similar to Figure 1.4 of the Technical Note, it is noted that the increased development
traffic is not displayed on the internal development links in Figure 1.8. This could be
confusing for readers (e.g. decision maker under the RMA) because at the bandwidth
scale shown, this ‘missing’ traffic is significant (noting that the values indicated in Table
1.11 of the Technical Note).
5.8.2 The peak hour trip matrix demand associated with proposed supermarket (zones 12) is
413 vehicle trips to the site and 420 from the site resulting in 833 trips. This is less than
the 870 (or 876 with fuel) trips set out ion Table 7.1 (Trip Generation) of the ITA.
5.9 Intersection and Travel time Comparisons
5.9.1 Many of the results presented appear illogical. With development, there is effectively a 6%
increase in vehicle trips on the modelled network and an additional set of traffic signals to
traverse, but yet the reported results indicate (in most cases) that this performs better than
the base.
5.9.2 It can easily be demonstrated that introducing mid-block traffic signals (without any other
changes) would result in increased travel time, unless they are perfectly coordinated
(which is seldom possible in two directions), in which case travel time would remain
similar, but not reduce.
5.9.3 Similarly, adding more traffic locally (all else remaining the same) would result in similar or
increased travel times, but not a reduction. Therefore the current results imply that either a
‘fair’ comparison is not being made, or that there may be errors in extracting the model
outputs (or possibly both).
5.9.4 I’ve checked network coding and can confirm that this appears to be generally consistent
between the base and development networks (with only relatively minor optimisation
adjustments noted at traffic signals).
5.9.5 There does however appear to be some inconsistencies in the path files used to compile
13
Note that a flat traffic profile has been adopted for the supermarket (zone 12), so trips leaving the supermarket have a
constant flow ‘peak’ rate throughout the entire modelled 2 hour modelled PM peak.
Ref: 2019-027
Papanui Pak'nSave Modelling Peer Review Page 13
© QTP Ltd 2019
V01a.DocxPapanui PAK’n Save – Peer Review of Traffic Modelling
delay. The differences appear to be significant. For example:
‘Main N QEII E’ – where Base starts at node 75 and with Development at node 72
(approximately 330m shorter than the base).
‘Main N QEII S1’ – where Base starts at node 59 and with Development at node 113
(approximately 40m shorter than the base).
‘Main N QEII S2’ – where Base starts at node 60 and with Development at node 61
(approximately 26m shorter than the base).
‘CranfordMainN N’ – where Base starts at node 41 and with Development at node 51
(approximately 200m longer than the base).
5.9.6 It is therefore recommended that the path files are updated to be fully consistent and
results re-extracted.
5.9.7 Other items identified earlier in this review (e.g. some traffic re-routing to avoid the
Paramics study area and modelled development demand being less than the trip
generation estimated in the ITA) may also be unintentionally contributing to a skewed
comparison in favour of the propose development.
5.9.8 It is reasonable to expect that traffic effects with development might be similar to the base,
but intuitively they should not result in an improvement (as currently indicated). Therefore,
any model outputs that indicate an improvement over the base will need to have a robust
explanation as to how this is possible.
5.9.9 Table 1.5 of the Technical Note has a typo (digit missing) for the 2021 base flow from Main
North Road (South approach).
5.9.10 Tables 1.5 to 1.8 of the Technical Note are summarised at the approach level rather than
the movement level (as provided in Tables 1.3 and 1.4). It is therefore difficult to
understand other possible reasons for the unintuitive outputs. It is recommended that
Tables 1.5 to 1.8 are expanded to the movement level.
5.10 New signalised Main North Road access
5.10.1 Table 1.11 of the Technical Note indicates an average delay of 60 seconds for the Main
South Road south approach through (northbound) movement at the new access
intersection. However, this does not seem to reconcile with Table 1.9 where the
northbound delay on Main North Road to the north is indicated to be 111 seconds quicker
with development, and Cranford Street is only 3 seconds more with development. Some
signal optimisation and coordination is acknowledged, but this result is unintuitive and
therefore further explanation would be useful.
5.11 Vehicle Travel Totals
5.11.1 Table 1.13 in the Technical Note provides a useful summary of total travel within the model
area (excluding traffic accessing the development).
5.11.2 It is noted (and understood) that the total non-development vehicle trips decrease with the
addition of development traffic (due to pass-by and diverted components). It would
therefore be useful to normalise the results to understand the potential effects on an
average per vehicle basis.
Ref: 2019-027
Papanui Pak'nSave Modelling Peer Review Page 14
© QTP Ltd 2019
V01a.DocxPapanui PAK’n Save – Peer Review of Traffic Modelling
5.12 Summary of Modelled Effects of Proposal
5.12.1 The summary provided a good explanation of the key outcomes of the modelling.
5.12.2 Some of these outcomes may however be subject to change depending on further
investigation and possible resolution of matters described above.
5.12.3 I note the following reporting related issues that have been added to the Review Register
in Appendix A:
# Issues Raised – Completeness of Documentation Level of Client Risk
10 It is recommended that vehicle tracking for two HCVs simultaneously High
turning right from Main North Road to QEII Drive is redone on a
proper georeferenced base.
11 It would be useful if Table 1.2 of the Technical Note included distance Medium
information so that speeds can be inferred (or implied average speeds
added to the table)
12 It appears that the pre-conferencing assumption that the site has been High
vacated and construction of a college (referred to in section 3.7 of the
ITA) has been retained instead of adopting the revised permitted
baseline agreed during conferencing.
13 It is however noted that the increased development traffic is not High
displayed on the internal development links in Figures 1.4 and 1.8.
This could be confusing for readers (e.g. decision maker under the
RMA) because at the bandwidth scale shown, this ‘missing’ traffic is
significant.
14 The future year (2021 and 2031) trip matrix demand associated with High
the supermarket site (zones 12) appears to be less than the 870 trips
(or 876 with fuel) set out ion Table 7.1 (Trip Generation) of the ITA.
15 There appear to be some significant inconsistencies in the path files High
used to compile delay, where different starting nodes adopted in the
base and with development networks result in different path lengths
which distorts the relative travel time.
16 It is reasonable to expect that traffic effects with development might High
be similar to the base, but intuitively they should not result in an
improvement (as currently indicated). Therefore, any model outputs
that indicate an improvement over the base will need to have a robust
explanation as to how this is possible.
17 Table 1.5 of the Technical Note has a typo (digit missing) for the 2021 High
base flow from Main North Road (South approach).
18 Tables 1.5 to 1.8 of the Technical Note are summarised at the Medium
approach level rather than the movement level (as provided in Tables
1.3 and 1.4). It is therefore difficult to understand other possible
Ref: 2019-027
Papanui Pak'nSave Modelling Peer Review Page 15
© QTP Ltd 2019
V01a.DocxPapanui PAK’n Save – Peer Review of Traffic Modelling
reasons for the unintuitive outputs. It is recommended that Tables 1.5
to 1.8 are expanded to the movement level.
19 Table 1.11 of the Technical Note indicates an average delay of 60 Medium
seconds for the Main South Road south approach through
(northbound) movement at the new access intersection. However, this
does not seem to reconcile with Table 1.9 where the northbound
delay on Main North Road to the north is indicated to be 111 seconds
quicker with development, and Cranford Street is only 3 seconds
more with development. Some signal optimisation and coordination is
acknowledged, but this result is unintuitive and needs further
explanation.
20 It would be useful to normalise the results in Table 1.13 in the High
Technical Note to understand the potential effects on an average per
vehicle basis (while still excluding development traffic).
Ref: 2019-027
Papanui Pak'nSave Modelling Peer Review Page 16
© QTP Ltd 2019
V01a.DocxPapanui PAK’n Save – Peer Review of Traffic Modelling
6 Peer Review Close Out
6.1 Modelling Team Responses
6.1.1 The first version of this peer report was provided to the modelling team for consideration.
6.1.2 A response technical note14 has been provided which includes responses to all the issues
raised in the Review Register (Appendix A) and included appended information where any
previously reported item has changed as a result of any action associated with the
response.
6.1.3 The responses from the response technical note have been copied15 across directly to the
corresponding response field of the Review Register in Appendix A of this document
(along with the appended information provided in the response technical note).
6.2 Conclusion
6.2.1 Overall, I am satisfied that all issues raised have been reasonably resolved through either
additional information, making corrections, or acknowledging and accepting minor
inconsistences (and interpreting model outputs with these in mind).
6.2.2 A side-effect of the adopted methodology16 is that there are several inconsistences
between the future year models with and without development:
Split signal phasing adopted at Main North Road/QEII Drive/Northcote for development
scenario but not corresponding future base
Traffic signal optimisation (small changes in offsets and green times)
CAST demands (reflecting minor wider area differences with and without development)
Trip generation (small differences from reported values)
6.2.3 These inconsistencies, while acknowledged to relatively small in isolation, collectively
introduce multiple secondary effects that make a 'pure' comparison of development only
effects very difficult.
6.2.4 Therefore, the reported effects relate to not just a change in development (and the access
intersection), but also include other secondary effects which increase the uncertainty of the
quantified effects. The net result is that a general improvement in network performance is
indicated to be the outcome of the proposed development.
6.2.5 I am not necessarily convinced that this will be the actual outcome. I consider a more
practical approach is to acknowledge some uncertainty and limitations in the model.
6.2.6 On that basis, there is strong evidence that the model is in the right ball-park and
adequately reflecting future year operation with development in place. It is reasonably
clear that the anticipated traffic effects are likely to be less than minor, but (allowing for
uncertainty and model limitations) not necessarily an improvement as currently reported.
14
Model Peer Review Response, prepared by Abley, dated 14th November 2019. “FSIL-J047nte3 Model Peer Review
Response v2.docx”
15
Appending the entire response technical note was considered, but would have resulted in much duplication with the
original (unpopulated) Review Register in Appendix A.
16
Agreed between Abley and CCC.
Ref: 2019-027
Papanui Pak'nSave Modelling Peer Review Page 17
© QTP Ltd 2019
V01a.DocxPapanui PAK’n Save – Peer Review of Traffic Modelling
Appendix A – Review
Register
Ref: 2019-027
Papanui Pak'nSave Modelling Peer Review
© QTP Ltd 2019
V01a.DocxPapanui PAK’n Save – Peer Review of Traffic Modelling
This page is intentionally blank for double-sided printing.
Ref: 2019-027
Papanui Pak'nSave Modelling Peer Review
© QTP Ltd 2019
V01a.DocxPapanui PAK’n Save – Peer Review of Traffic Modelling
Reviewer Reviewer Response Reviewer
# Issue Raised Level of Proposed Resolution Close out
Client
Risk
1 Inconsistent traffic zones between 2018 base and Low The Paramics model was initially set up (both Purpose of 2018 Base used for initial
future models. Justification or further explanation base and futures) with a 2018 zone set and was calibration and validation only.
is recommended. based on the CTM model. Following a directive
Having established this, and carrying
from Council, the futures were converted to
calibrated element’s to future
receive CAST demands which had additional
networks, it served no further
internal zones. These demands and new zones
purpose.
were included in the future Paramics models to
simplify the demand conversion process and the STATUS - reasonably resolved.
2018 model was unaffected.
2 Further explanation of the rationale for applying Low Paramics can distribute traffic across multiple STATUS – reasonably resolved
car-parks to zones 13 and 15 is recommended, links in terms of the origin of a trip (proportions through additional information
including potential advantages and limitations of are set by the link length) but will seek out the contained in response.
this approach. lowest cost route to the destination zone.
Carparks were used in some cases so that the
“zonal links” had the same proportion of origin
and destination trip ends in order to evenly
distribute traffic and simplify the matrix.
Carparks in the zones identified were not used
as a proxy to estimate CAST demands or other
interactions.
Ref: 2019-027
Papanui Pak'nSave Modelling Peer Review
© QTP Ltd 2019
V01a.DocxPapanui PAK’n Save – Peer Review of Traffic Modelling
3 A ‘manual’ trip matrix estimation procedure was Low The CAST process was developed well after the STATUS – reasonably resolved
adopted. Justification or further explanation models were developed. There also was no through additional information
required why initial demands from CAST were not 2018 CAST model available (the base year at contained in response.
used (as adopted for future year models). the time was 2013) which could be used to
undertake calibration and validation against. A
manual matrix would have been required to
obtain a decent prior matrix so engineering
judgment was used to set up the prior as close
as possible with minor furnessing applied to
achieve inbound/outbound targets.
4 Reporting error in Tables A1.2 and A1.3 for the High The values in the Table are offset in the last row STATUS – confirm corrected in
intersection totals, where the column totals are by one column. The revised tables are attached response document.
either incorrect and or out of sync with the row including an hourly equivalent GEH for the two-
data above. hour totals (from issue #5 below).
5 GEH values reported for 4pm to 6pm are Medium The revised tables are attached (with correction STATUS – confirm corrected in
incorrect because they have not been converted from issue #4 above) and generally reflect better response document.
to hourly equivalents. GEH values than previously reported and are
considered an overall good level of fit.
6 Comparisons not made with relevant TDMG Low The analysis undertaken by the peer reviewer is STATUS – reasonably resolved
criteria in ITA (however, this has been resolved acknowledged and the conclusions drawn from
indirectly as part of this peer review) this analysis are considered appropriate.
7 Journey time vs. distance graphs have not been Low The implied surveyed and modelled speeds are STATUS – confirm corrected in
provided. As an alternative to providing these, it included in an updated Table A1.4 attached. response document.
would be very useful if each route distance (path
length) could be included in ITA Table A1.4 so
that the vehicle speeds can be inferred (or ideally
Ref: 2019-027
Papanui Pak'nSave Modelling Peer Review
© QTP Ltd 2019
V01a.DocxPapanui PAK’n Save – Peer Review of Traffic Modelling
also reported)
8 From the reporting in the revised section 8 of the Medium The base model has not been based upon STATUS – reasonably resolved
ITA and Appendix A of the ITA, very few details CAST as discussed the response to item #1. As through additional information
are provided about how CAST demands were agreed with Council the future models have contained in response.
translated into Paramics and whether any taken CAST matrices directly without any
additional adjustments were required (other than adjustments to reflect a base year matrix
altering trip generation for the supermarket). estimation or other calibration process. This
Further clarification through reporting would assist was agreed with Council to be appropriate as
with understanding. It currently appears that the the future receiving environment is very different
adopted methodology results in additional traffic with the introduction of the CNC by 2021 and
effects outside the Paramics model area that are CNC and Cranford Basin link in 2031. It is also
not currently being captured in the assessment of noted that network operation calibration from the
effects. base year has been carried forward to the future
year models.
The key vehicle interactions and conflicts arising
due to the development are typically contained
within the Paramics modelled area and any
wider effects are considered to occur outside the
area due to redistribution and rerouting occurring
within the CAST model. This is discussed further
in item #9 below.
9 There are some significant differences between Medium The demands of the Paramics model has been A side-effect of the adopted
the Base and with development network at the checked for consistency with the CAST methodology is that there are several
model external boundary, with a net reduction of demands sent through on 9/09/2019 by CCC for inconsistences between the future
traffic in the ‘with development’ network. This the Base years and 13/09/2019 for the future year models with and without
implies that some traffic is being pushed out years. The demands have been confirmed to development:
beyond the Paramics model area and the effects pass through the translation process with the
Split signal phasing
of this are not captured. Normalising the current same demand levels at the end where Paramics
Ref: 2019-027
Papanui Pak'nSave Modelling Peer Review
© QTP Ltd 2019
V01a.DocxPapanui PAK’n Save – Peer Review of Traffic Modelling
outputs to take this into account is recommended. demands are created. Note that no adjustment Signal optimisation
has been made to the final demands based on CAST demands (reflecting
the results of a Matrix Estimation, so they legitimate minor wider area
represent the CAST demands as is. differences, but resulting in
The only adjustment to the demands is to scaled inconsistency within the
back the supermarket demands from Paramics model area)
15trips/100sqm gfa to 12.5trips/100sqm gfa These inconsistencies each introduce
which will result in some reduction on the secondary effects that cloud a ‘pure’
network. comparison of development only
The base ‘no development’ demands sets have effects.
been extracted from CAST with the existing It needs to be acknowledged that
phasing arrangement and lane configuration at reported effects relate to not just a
Main North Rd/QE2 Dr/Northcote Rd intersection change in development, but also
which has right turn filtering enabled on all but include other secondary effects which
the QE2 Dr approach. The ‘with development’ increase the uncertainty of the
demands from CAST have the proposed split reported values.
phasing and lane arrangement. This makes it
The modelled network performance
difficult to undertake a direct comparison
indicated with development is
between the two demand sets as there are
however likely to be reasonably
changes in the intersection layout and phasing,
representative of what might be
the new signals on Main North Road are
expected based on the adopted
introduced and development traffic is added.
assumptions.
We note however that these were the only
demand sets made available during modelling STATUS – Model results to be
caucusing and we have been reliant on Council interpreted with this issue in mind.
in that regard.
It is our view that the difference in operation at
the Main North Rd/QE2 Dr/Northcote Rd
intersection and to an extent the new signals on
Ref: 2019-027
Papanui Pak'nSave Modelling Peer Review
© QTP Ltd 2019
V01a.DocxPapanui PAK’n Save – Peer Review of Traffic Modelling
Main North Road results in traffic reassignment
within CAST. The routing of traffic in CAST with
and without the development will also be
sensitive to the operation of the Northcote-QEII
and Main North Road corridors including the
signal coordination and the optimisation of signal
performance. CAST implements an equilibrium
assignment which means that for trips from
every origin to every destination the minimum
generalised cost will be sought. In a busy grid-
based network like Christchurch with a large
number of potential vehicle paths (and this is
prominent in the vicinity of the site) the routing of
traffic for each origin-destination pair is likely to
be sensitive to small changes in generalised
costs, and this is the most likely explanation for
the reduction in some flows.
As agreed during conferencing the base and
with-development models in Paramics have the
proposed split phasing and lane arrangement.
10 It is recommended that vehicle tracking for two High Agree with this comment. Vehicle tracking was STATUS – reasonably resolved
HCVs simultaneously turning right from Main undertaken to investigate the viability of two through additional information
North Road to QEII Drive is redone on a proper vehicles turning right simultaneously. As contained in response.
georeferenced base. requested by CCC, a 23m B-Double truck side
by side with an 8m medium rigid truck was
tested. Preliminary tracking shows that that the
two vehicles can turn side by side with adequate
clearance. However, it was noted in the ITA that
tracking was undertaken on an aerial image and
Ref: 2019-027
Papanui Pak'nSave Modelling Peer Review
© QTP Ltd 2019
V01a.DocxYou can also read