EUROCONTROL EUROPEAN ORGANISATION FOR THE SAFETY OF AIR NAVIGATION
←
→
Page content transcription
If your browser does not render page correctly, please read the page content below
EUROPEAN ORGANISATION
                         FOR THE SAFETY OF AIR NAVIGATION

                                                EUROCONTROL

                              EUROCONTROL EXPERIMENTAL CENTRE

                                               DEPARTURE METERING

                                                  EEC Note No. 03/2008

                                                          Project: MTV

                                                                                                 Issued: May 2008

                            © European Organisation for the Safety of Air Navigation EUROCONTROL 2007
  This document is published by EUROCONTROL in the interest of the exchange of information. It may be copied in whole or in part
providing that the copyright notice and disclaimer are included. The information contained in this document may not be modified without
                                                prior written permission from EUROCONTROL.
EUROCONTROL makes no warranty, either implied or express, for the information contained in this document, neither does it assume
                    any legal liability or responsibility for the accuracy, completeness or usefulness of this information.
Page intentionally left blank
REPORT DOCUMENTATION PAGE

Reference:                                      Security Classification:
EEC Note No 03/08                               Unclassified
Originator:                                     Originator (Corporate Author) Name/Location:
EEC - ATC                                       EUROCONTROL Experimental Centre
                                                Centre de Bois des Bordes
                                                B.P.15
                                                F - 91222 Brétigny-sur-Orge Cedex
                                                FRANCE
                                                Telephone: +33 (0)1 69 88 75 00
Sponsor:                                        Sponsor (Contract Authority) Name/Location:
                                                EUROCONTROL Agency
                                                96, Rue de la Fusée
                                                B-1130 Brussels
                                                Telephone: +32 2 729 90 11
                                                WEB Site: www.eurocontrol.int

TITLE:
                                           DEPARTURE METERING

          Authors                        Date       Pages     Figures      Tables   Annexes    References
  Andre Marayat / EEC / ATC         05/2008         x + 50      17           5        2            7

                                            Project           Task No. Sponsor            Period
                                             MTV                                           2008
Distribution Statement:
(a) Controlled by:       EUROCONTROL Project Manager
(b) Special Limitations: None
(c) Copy to NTIS:        YES / NO
Descriptors (keywords):
MTV
Arrivals Departures Concept Validation

Abstract:

The objective of this study is to assess the feasibility and performance of the Departure Metering
concept. A cost benefit evaluation is proposed where benefit is the Departure Metering performance and
cost is addressed in terms of runway throughput / delay.
Page intentionally left blank
Departure Metering - Analytical Model Based Experiments                             EUROCONTROL

                                  EXECUTIVE SUMMARY

Departure Metering avoids excessive bunching on points or sectors where departure flows
from different airports merge. The bunching causes the controller’s workload to be
extremely unsteady with excessive peaks and Departure Metering seems to be the best
candidate for avoiding these peaks (apart from airspace re-design which is often not
feasible).
This document considers as example case the five major London airports feeding traffic to
the London TMA exit points which are the main metering fixes.
The London TMA example serves to conduct an analytical study aiming at the evaluation
of efficiency and cost of Departure Metering.
In this analytical study Departure Metering acts on the departing traffic through imposing
ground delays as only means to smoothen the traffic on the metered TMA exit points.
Therefore it causes departure delay which represents the cost for avoiding bunches.
Other concepts employed for the same goal as Departure Metering cause additional delay
too and a Departure Metering cost benefit evaluation is performed here to allow later
comparisons with these other concepts conceived to solve the same bunching problem.
The cost benefit evaluation allows quantifying the efficiency of Departure Metering in de-
bunching and it quantifies the related cost in terms of departure delay or in terms of
runway throughput decrease.
Much effort was spent on the runway modeling aspect because Departure Metering
applies a good amount of ground delays (time constraints) on all the different airport’s
departure processes. The correct integration of these time constraints in the natural
runway sequencing is essential for evaluating runway throughput and departure delay. It is
essential as well to determine the de-bunching performance because the re-sequencing of
the departures after integration of one or more time constraints can lead to unforeseen
runway sequence changes. These again can lead to new and other bunching problems.
The runway model shall best reflect the aerodrome controllers’ way to work.

The results presented in this note were obtained with different traffic samples representing
actual traffic and future traffic.
Departure Metering performs well for actual traffic. The future traffic samples were
developed to anticipate traffic from 2012 and 2020 and then Departure metering shows its
limitations with up to 30% traffic increase. Then airspace design and runway re-
configuration become the principal means to cope with such traffic figures. Departure
Metering keeps its ability as peak absorber but it can not replace lack of airspace.

The principal Conclusions are:
   • the Departure Metering concept works and bunching can be reduced substantially.
   • It is possible to make cost benefit analysis of Departure Metering for a given traffic
       demand and a corresponding runway and airspace situation.
   • The number of time constraints imposed on the Take Off sequence can be high. A
       DMAN integrated version of Departure Metering would be useful in order to assist
       the controllers in integrating all time constraints.
   • Departure Metering can not solve airspace design issues. Airspace design must be
       considered continuously with increasing traffic figures.

Departure Metering EEC Note No 03/08                                                              v
EUROCONTROL Departure Metering - Analytical Model Based Experiments
Page intentionally left blank
vi Departure Metering EEC Not No 03/08Departure Metering - Analytical Model Based Experiments EUROCONTROL
TABLE OF CONTENTS
1. INTRODUCTION ...........................................................................................................1
1.1. EXPERIMENT OBJECTIVES......................................................................................... 1
1.2. CONTEXT ...................................................................................................................... 3
1.3. EXPERIMENT SCOPE................................................................................................... 3
1.4. DOCUMENT STRUCTURE............................................................................................ 3
2. SIMULATION ORGANISATION ...................................................................................4
2.1. CONCEPT AND VALIDATION OBJECTIVES................................................................ 4
2.2. SIMULATION AND PREPARATION ACTIVITIES.......................................................... 4
2.3. ASSUMPTIONS, CONSTRAINTS, AND LIMITATIONS ................................................ 5
3. SIMULATION MODELS................................................................................................6
3.1. DEPARTURE METERING ALGORITHM ....................................................................... 6
3.1.1. Environmental Aspects......................................................................................6
3.2. ATC OPERATIONS MODEL .......................................................................................... 7
3.2.1. Runway Sequencing Model...............................................................................7
3.3. AIRCRAFT OPERATIONS MODEL ............................................................................. 10
3.4. SIMULATED ENVIRONMENT ..................................................................................... 10
4. AIRSPACE..................................................................................................................11
5. TRAFFIC DESCRIPTION............................................................................................13
6. EVALUATION METHOD.............................................................................................14
6.1. SCENARIOS ................................................................................................................ 14
6.2. METRICS AND INDICATORS...................................................................................... 15
6.3. ANALYSIS .................................................................................................................... 15
7. STUDY ON DIFFERENT DEPARTURE METERING TIME HORIZONS (DM-E-1, DM-
E-2, DM-S-1) ...............................................................................................................16
7.1. EXPECTATIONS.......................................................................................................... 16
7.2. RESULTS ..................................................................................................................... 18
7.2.1. Delay ...............................................................................................................20
7.2.2. Throughput ......................................................................................................23
7.2.3. Missed Departure Metering Slots ....................................................................24
7.2.4. Time constraints in the Departure Process Model...........................................25
8. TRADE OFF – CONSTRAINTS ON UPSTREAM TRAFFIC VERSUS REDUCTION
OF BUNCHING (DM-E-2, DM-S-1) .............................................................................26
8.1. BASELINE CASE ......................................................................................................... 26
8.2. THE MODEL – DETAILED IN ANNEX B...................................................................... 27
8.3. TRADE-OFF DIAGRAM ............................................................................................... 27
8.4. NUMBER OF DM SLOTS / MISSED SLOTS ............................................................... 29
9. FUTURE TRAFFIC SAMPLES ...................................................................................30
9.1. 2012 BASELINE CASE ................................................................................................ 30
9.2. 2020 BASELINE CASE ................................................................................................ 31
Departure Metering EEC Note No 03/08 viiEUROCONTROL Departure Metering - Analytical Model Based Experiments
9.2.1. Arrivals Delay ..................................................................................................31
9.3. RESULTS AS TRADE-OFF DIAGRAMS ..................................................................... 32
9.4. NUMBER OF DM SLOTS / MISSED SLOTS ............................................................... 33
9.5. AIRSPACE CONFIGURATION .................................................................................... 34
9.6. RUNWAYS ................................................................................................................... 34
10. INFLUENCE OF SLOT WIDTH (DM-E-2) ...................................................................35
11. CAPACITY ..................................................................................................................36
11.1. AIRPORT (DM-C-2) ..................................................................................................... 36
11.2. TMA (DM-C-1) .............................................................................................................. 36
12. CONCLUSIONS ..........................................................................................................38
13. RECOMMENDATIONS ...............................................................................................40
14. REFERENCES ............................................................................................................41
LIST OF ANNEXES
ANNEX A ..........................................................................................................................42
ANNEX B (DEPARTURE METERING MODEL SETUP) ..................................................43
viii Departure Metering EEC Not No 03/08Departure Metering - Analytical Model Based Experiments EUROCONTROL
ABBREVIATIONS AND ACRONYMS
Abbreviation De-Code
CFMU Central Flow Management Unit
DM Departure Metering
LTMA London TMA
ATC Air Traffic Control
ATM Air Traffic Management
A-CDM Airport – Collaborative Decision Making
DMAN Departure Manager
EEC EUROCONTROL Experimental Centre
SID Standard Instrument Departure
ETOT Estimated Take Off Time
CTOT CFMU slot
NATS National Air Traffic Services
rwy runway
TMA Terminal control Area
Departure Metering EEC Note No 03/08 ixEUROCONTROL Departure Metering - Analytical Model Based Experiments
Page intentionally left blank
x Departure Metering EEC Not No 03/08Departure Metering - Analytical Model Based Experiments EUROCONTROL
1. INTRODUCTION
Clusters of neighboring airports within the same TMA or even different TMAs can
necessitate Departure Metering in order to synchronize traffic to particular merge points or
merge regions which are susceptible to bunching. This adds Departure Metering related
constraints to the already existing CFMU slots to the airports’ departure processes.
Departure Metering is necessary when random bunching of departing aircraft on TMA exit
or on other particular merge points occurs such that the controllers’ workload is extremely
unsteady with excessive peaks, and when this problem can not be solved within CFMU’s
granularity limits.
Departure Metering, in its attempt to de-bunching traffic on points where departure flows
from different airports merge, will constraint particular aircraft by either delaying or
advancing them. The goal is to spread out the bunch and by doing so flattening the traffic
peak. In most cases aircraft would be delayed. Advancing aircraft implies to speed up
during the early climb phase which is difficult to realize. Delaying aircraft could be done by
slowing down during the early climb phase but is mainly done by ground holding delay.
The original concept of TMA Departure Metering is defined in [4]: Departures from several
airports within a single TMA shall be synchronized in order to smoothen the traffic to the
first en-route sectors. The principal objective is to smoothen the traffic load on the entry of
adjacent en-route sectors. Therefore the focal points are the TMA exit points whereon
traffic is smoothened through application of upstream time constraints. In [4] it is not
foreseen to slow down or to speed up aircraft after Take-off. Only ground holding delays
are applied as upstream time constraints. This particular case and the particular
environment, London TMA, are considered in this document. In this considered case the
traffic rate over TMA exit points is limited to a certain number of aircraft per minute(s), e.g.
5 ac in 10 min. Aircraft which make exceed that limit rate will obtain a departure delay in
order to satisfy the assigned limit rate and thereby to smoothen the merging departure
traffic peak.
It is conceivable to apply different measures with the same objective. One possible
measure would be to apply spacing constraints (miles in trail limits or minutes in trail
limits). But this document only considers the aircraft rate limits (max x aircraft in y minutes)
as Departure Metering measure, described in chapter 3.1.
1.1. EXPERIMENT OBJECTIVES
The principal objectives are:
• to evaluate the efficiency of the Departure Metering algorithm, see chapter 3.1, in
terms of number of bunches solved with respect to a baseline – do nothing –
scenario,
• to evaluate the impact of the resulting upstream constraints (time constraints) on
the runways’ throughput and the resulting delay situation. Departure Metering
creates the time constraints by ‘de-bunching’ traffic over TMA exit fixes.
• Both above items lead to a trade-off analysis which relates performance of ‘de-
bunching’ and the price to pay for it in terms of delay / runway throughput.
Departure Metering EEC Note No xx/08 1EUROCONTROL Departure Metering - Analytical Model Based Experiments
Another goal is to evaluate different parameter settings of the Departure Metering
algorithm:
• The Departure Metering algorithm’s time horizon (time before aircraft over fly the
metered fix) is expected to have an impact on the ‘de-bunching’ solutions quality.
NATS foresees to apply the algorithm for each departure at Off-Block time which is
reasonable in an operational environment for the time being (2008). A longer time
horizon allows a larger set of solutions to the bunching problem and the ‘de-
bunching’ process could achieve a higher efficiency.
o Both time horizons shall be compared in terms of ‘de-bunching’ efficiency
and delay.
o The longer time horizon will be assumed to be possible for 2012 and later
(see http://www.euro-cdm.org/ and the A-CDM project,
http://www.eurocontrol.int/airports/public/standard_page/acdm.html ). These
projects aim to improve prediction of Off-Block times and a precise Off-Block
time estimate is expected at least 15 minutes in advance for 2012 and later.
The runway sequencing then would integrate DM time constraints before the
respective aircraft leave the block. The obtained sequence is therefore a Pre-
Departure Sequence wherein time constraints should be transparent to the
aerodrome controllers.
• The time constraints generated by Departure Metering are expressed as mini-slots
of +2, -3 minutes. This slot size is proposed in the Departure Metering concept [4].
A variation in mini-slot size shall be considered. A larger slot size would lead to less
precision on the expected time over the metering fix. But the upstream constraints
are less penalizing so that a trade off between performance of ‘de-bunching’ and
delay / runway throughput should be possible. Different slot sizes shall be
compared in terms of ‘de-bunching’ efficiency and delay.
A last, but important, objective is to evaluate the Departure Algorithm on future traffic
samples. The Departure Algorithm is applied with equal parameter settings and equal
calculation time horizon on three sets of traffic. The traffic samples were collected and
prepared for SESAR (ATM Target Concept) purposes by EUROCONTROL/EEC/NET [7].
• Baseline traffic (collected July 2006. July is one of the busiest months of the year).
• An extrapolation of the baseline traffic for 2012.
• An extrapolation of the baseline traffic for 2020.
2 Departure Metering EEC Not No 03/08Departure Metering - Analytical Model Based Experiments EUROCONTROL 1.2. CONTEXT Eurocontrol Agency Research Work Programme (ARWP) Arrivals Departures Operational Services and Environment Description (OSED). 1.3. EXPERIMENT SCOPE The experiment scope is one day of operations for the London airports Luton, Gatwick, Stansted, Heathrow and City. The geographical limits correspond to the London TMA. The traffic comprises departures and arrivals in order to achieve a realistic simulation of the mixed runways with respect to delay and throughput. Bunching is looked at on TMA exit with the goal to supply smooth traffic to the en-route airspace. 1.4. DOCUMENT STRUCTURE The underlying configuration data and traffic data is kept in the annexes. Results are in the document core. Departure Metering EEC Note No xx/08 3
EUROCONTROL                                   Departure Metering - Analytical Model Based Experiments

2.       SIMULATION ORGANISATION

2.1. CONCEPT AND VALIDATION OBJECTIVES

DM-S-1: A validation objective is to check the ability to avoid bunching over metered TMA
        exit points. Reduction of bunching is the initial reason for Departure Metering.
        For bunching criteria refer to chapter 3.1.

DM-E-2: The validation objective for the TMA – Departure Metering is to verify the ability
        to integrate time constraints into an efficient departure runway sequence. An
        efficient departure sequence maximizes runway throughput taking into account
        all physical constraints and all time constraints. The runway throughput is
        directly assessed and it expresses capacity (maximum throughput) and
        efficiency. Runway throughput is a centre of interest. Increase in delay results
        directly from decrease of throughput. Delay is therefore another measure for the
        validation objective DM-E-2. Delay is measured as average with its standard
        deviation.

DM-E-1:           Slot adherence is a second centre of interest. Slots affect throughput and
                  reciprocally a negative effect on throughput can deteriorate slot adherence. This
                  effect shall be considered.

DM-C-1: A validation objective is to verify the TMA exit capacity. The theoretical TMA exit
        capacity is the maximum TMA departure rate (all TMA exit points). To which
        extend does Departure Metering affect this value.

DM-C-2: A validation objective is to verify the airport departure capacities (here capacity
        stands for maximum throughput which depends on the traffic sample and the
        model setup). Departure Metering imposes constraints on the airport departure
        processes and a deterioration of the corresponding airport departure capacities
        is expected.

2.2. SIMULATION AND PREPARATION ACTIVITIES

The fast time simulations using the Departure Metering algorithm and an Analytical
Departure Process Model were conducted in the second half of 2007. The Departure
Process Model is used to quantify the impact of Departure Metering time constraints on
the runway throughput and on the average delay.

     •        The different traffic samples need preparation. Emphasis is put on realistic SID
              separation, realistic flying times to metering fixes according aircraft type and correct
              SID and fix settings. The SID and flight path information is extracted from the UK
              Aeronautical Information Service. The flying times from airport to the TMA exit
              points were established using a fast time simulator and they take into account 3D
              trajectory and aircraft type related performance information.

4                                                                  Departure Metering EEC Not No 03/08
Departure Metering - Analytical Model Based Experiments EUROCONTROL
• Fast time model runs with different traffic samples were performed. Results are
stored under Excel, see chapter 3.2.1, and exceptionally in text files.
• Analysis uses Excel calculation and display facilities.
2.3. ASSUMPTIONS, CONSTRAINTS, AND LIMITATIONS
A medium scale Analytical Departure Process Model is used to quantify the impact of
Departure Metering on the runway throughput / delay. The model’s goal is to accurately
model the controller’s work from pushback to Takeoff. For this purpose a runway schedule
optimizer is used. This tool optimizes the runway sequence very much like controllers
would do and comes as closed to reality as possible. Never the less:
• For a large number of time constraints the analytical controller model is believed to
be more efficient than human runway or ground controllers. We believe that
controllers excel in expeditious runway sequencing. But a large number of time
constraints imply a time based way to work. Time based sequencing necessitates
computer assistance. This plays a role only for the 2005/2006 scenarios where in
reality the departure process is entirely human controlled. For the 2012, 2020
scenarios Departure Management and Pre-Departure sequencing is expected to be
in place on the main airports in order to assist controllers to optimise the integration
of time constraints. Then the used analytical model is expected to be well adapted.
For normal expeditious departure runway sequencing (with only few time slots =
state of the art now) the model shall simulate experienced controllers.
Departure Metering EEC Note No xx/08 5EUROCONTROL Departure Metering - Analytical Model Based Experiments
3. SIMULATION MODELS
3.1. DEPARTURE METERING ALGORITHM
The Departure Metering algorithm is based on [4]. It detects bunches by forecasting the
traffic from Off-Block time over Take Off to the metering fix. To solve a bunch Departure
Metering chooses the least penalizing solution from all possible solutions, [4]. The solution
is to move an aircraft forward in time out of the bunch (impose delay on ground), The least
penalizing solution corresponds to the choice of the aircraft with the smallest delay for
resolving the problem. The choice of the aircraft with the smallest delay is supposed to be
the best solution to maximize runway throughput.
The bunching criteria are set for the entire simulation (entire day) as follows:
Metered Fix no of ac per Minutes
CLN 5 10
DVR 5 10
SEAFORD 5 10
SAM 5 10
KENET 3 10
DAVENTRY 5 10
These values were defined by NATS and they correspond to the airspace situation of
2005.
E.g. CLN 5 no_of_ac per 10 minutes means: Anything above 5 aircraft in 10 minutes
over flying CLN (metering fix CLACTON) is a bunch.
3.1.1. Environmental Aspects
Noise reduction and Fuel saving shall be considered:
Queuing at the holding shall be minimized through Pushback just-in-time. There should
never be more than three aircraft queuing at the holding. This task is DMAN specific but it
imposes the following constraint on Departure Metering.
• Departure Metering shall apply delays (time constraints) only to aircraft which are
still On Block. Once an aircraft taxies or pushes back no further time constraint
shall be applied. This shall avoid aircraft unnecessarily waiting on the taxiways or
at the holding with running engines.
6 Departure Metering EEC Not No 03/08Departure Metering - Analytical Model Based Experiments EUROCONTROL 3.2. ATC OPERATIONS MODEL Purpose built analytical Departure Process Model written in Java with characteristics, see chapter 2.3. Emphasis is put on runway modeling for optimum integration of time constraints in the take-off sequence with respect to all other constraints (SID, Wake Vortex). The Wake Vortex constraints reflect ICAO standards. The SID separations are taken into account as hard constraints for all involved airports. The runway model merits emphasis because its fidelity largely impacts the results’ quality and because the Departure Metering algorithm itself is less complicated than the runway model. 3.2.1. Runway Sequencing Model The runway sequencer optimizes mixed mode runways and dedicated departure runways. The underlying principles are based on a Departure Manager Planner algorithm. The concept is outlined below: Arrivals are taken into account but the concept is appropriate for highly loaded dedicated departure runways like Heathrow too. Brief description: The algorithm selects a window of the first few aircraft (e.g. 5 aircraft) from the departure demand sequence and it finds an optimum sequence for this window which is easy due to the limited set of possible sequences. The first aircraft of this optimum is appended to the optimized sequence. Then the algorithm slides the window by one and repeats the sub- optimization. This continues until all aircraft are shifted into the resulting optimized sequence. The operational concept in the Departure Management context is described in [6] Mixed runways benefit mainly from Arrival Gapping. On mixed runways Departure sequence optimization plays a less important role and acts only when the gaps between arrivals allow to insert a sequence of several departures. Arrival Gapping is applied as much as possible for the mixed runways. Departure Metering EEC Note No xx/08 7
EUROCONTROL                                        Departure Metering - Analytical Model Based Experiments

Mixed Mode: Below is a excel simulation output representing Arrival Gapping at Gatwick
during half an hour. The list is time sorted. Departures are in blue, arrivals are in yellow.
You will notice 5 minute DM slots for some departures.

                                                                              DM Slot    DM Slot    MTOT /      Metering   time
Callsign      Type   origin   destination   rwy   SID   ETOT       CTOT       from       to         ETA         Fix        to fix

EZY54190      A319   EGKK     LPFR          99    SAM   16:10:00                                     16:11:07   SAM          618

ELL101        B735            EGKK          99                                                       16:12:00

GBL54A        A320   EGKK     LEPA          99    HAR   16:05:00              16:10:10   16:15:10    16:12:55   SEAFORD      794

EZY5152       A319            EGKK          99                                                       16:14:00

TAP349B       A321   EGKK     LPMA          99    SAM   16:03:00   16:16:00                          16:14:55   SAM          618

EZY5419       B752   EGKK     LPFR          99    SAM   16:09:00   16:20:00                          16:16:55   SAM          618

EZY5108       A319            EGKK          99                                                       16:18:00

BRT38TC       B461   EGKK     EGNS          99    LAM   14:55:00              16:16:15   16:21:15    16:18:55   DAVENTRY   1078

SHT2909       B735            EGKK          99                                                       16:20:00

LZB502        B733   EGKK     LBBG          99    DVR   16:20:00                                     16:20:55   DVR          768

BAW53T        B734            EGKK          99                                                       16:22:00

BAW8119       B735   EGKK     EHAM          99    CLN   16:20:00                                     16:22:55   CLN        1041

EZY5MJ        A319            EGKK          99                                                       16:24:00

FCA153C       B752   EGKK     LERS          99    HAR   16:20:00              16:21:33   16:26:33    16:24:55   SEAFORD      794

BAW7988       B735            EGKK          99                                                       16:26:00

EZY5227       A319   EGKK     LEAL          99    HAR   15:55:00   16:17:00   16:22:00   16:27:00    16:26:55   SEAFORD      794

SUD120        A30B            EGKK          99                                                       16:28:00

RYR1293       B738   EGKK     EIKN          99    LAM   15:55:00              16:25:21   16:30:21    16:28:55   DAVENTRY   1078

CNO623        B735            EGKK          99                                                       16:30:00

DAT2130       RJ1H   EGKK     EBBR          99    DVR   16:25:00   16:28:00   16:27:31   16:32:31    16:30:55   DVR          768

MON3607       A306            EGKK          99                                                       16:32:00

EZY735        A319   EGKK     EGAA          99    LAM   16:05:00              16:29:05   16:34:05    16:32:55   DAVENTRY   1078

NRP201        AN12            EGKK          99                                                       16:34:00

EZY52270      A319   EGKK     LEAL          99    HAR   16:05:00   16:25:00   16:29:05   16:34:05    16:34:55   SEAFORD      794

GBL89G        A320            EGKK          99                                                       16:36:00

GBL6TS        A320   EGKK     GCTS          99    SAM   16:13:00   16:35:00                          16:36:55   SAM          618

SNB813        B735            EGKK          99                                                       16:38:00

TOM091D       B738   EGKK     LEMG          99    SAM   16:20:00   16:38:00                          16:38:55   SAM          618

EZY762        A319            EGKK          99                                                       16:40:00

RYR117G       B738   EGKK     EIDW          99    KEN   16:30:00   16:43:00                          16:40:55   KENET        822

8                                                                             Departure Metering EEC Not No 03/08
Departure Metering - Analytical Model Based Experiments EUROCONTROL
Departures only: Below is a excel simulation output representing Heathrow departures
during 40 minutes. You will notice 5 minute DM slots for some departures.
DM Slot DM Slot Metering time
Callsign Type origin destination rwy SID ETOT CTOT from to MTOT Fix to fix
ALK506 A343 EGLL VCBI 99 DVR 14:00:00 14:00:00 DVR 939
BAW704 A321 EGLL LOWW 99 DVR 14:00:00 14:00:00 14:02:00 DVR 939
BAW66X A320 EGLL LIMC 99 MID 13:45:00 13:55:00 14:00:00 14:05:00 14:03:30 SEAFORD 988
VIR23 A346 EGLL KLAX 99 WOB 14:00:00 14:01:40 14:06:40 14:04:37 DAVENTRY 657
MSR778 B772 EGLL HECA 99 DVR 14:00:00 14:05:44 DVR 939
BAW147 B772 EGLL VECC 99 BPK 14:00:00 14:06:51 CLN 948
BAW348 B752 EGLL LFMN 99 MID 13:55:00 14:09:10 14:14:10 14:09:10 SEAFORD 988
SAS504 MD81 EGLL EKCH 99 BPK 14:05:00 14:10:17 CLN 948
BAW856 A320 EGLL LKPR 99 DVR 14:00:00 14:11:24 DVR 939
EIN381 A320 EGLL EINN 99 CPT 14:10:00 14:12:31 KENET 514
DLH9EJ B735 EGLL EDDK 99 DVR 14:05:00 14:12:24 14:17:24 14:13:38 DVR 939
BAW209 B744 EGLL KMIA 99 SAM 12:40:00 14:16:00 14:14:45 SAM 647
ACA849 A343 EGLL CYYZ 99 WOB 14:00:00 14:15:59 14:20:59 14:15:59 DAVENTRY 657
BAW81 B763 EGLL DGAA 99 MID 13:50:00 14:16:41 14:21:41 14:17:06 SEAFORD 988
QTR012 A332 EGLL OTBD 99 DVR 14:05:00 14:19:05 14:24:05 14:19:05 DVR 939
BMA676 A319 EGLL EGPD 99 WOB 13:50:00 14:21:11 14:26:11 14:21:11 DAVENTRY 657
ACA865 B763 EGLL CYUL 99 WOB 14:15:00 14:21:11 14:26:11 14:23:11 DAVENTRY 657
BAW920 A319 EGLL EDDS 99 DVR 14:15:00 14:21:19 14:26:19 14:25:11 DVR 939
DAH2055 B763 EGLL DAAG 99 MID 14:15:00 14:27:16 14:32:16 14:27:16 SEAFORD 988
BAW316 A319 EGLL LFPG 99 MID 13:50:00 14:28:51 14:33:51 14:29:16 SEAFORD 988
SHT6E A319 EGLL EGPF 99 WOB 14:25:00 14:30:22 14:35:22 14:30:23 DAVENTRY 657
BAW868 B752 EGLL LHBP 99 DVR 14:15:00 14:36:00 14:31:30 DVR 939
BMA5FP A320 EGLL EGAC 99 WOB 14:30:00 14:32:45 14:37:45 14:32:45 DAVENTRY 657
BAW960 A319 EGLL EDDM 99 DVR 14:30:00 14:38:00 14:33:52 DVR 939
BAW568 A320 EGLL LIML 99 MID 14:10:00 14:34:11 14:39:11 14:35:22 SEAFORD 988
AAL135 B772 EGLL KLAX 99 WOB 14:25:00 14:34:59 14:39:59 14:36:29 DAVENTRY 657
BAW734 A320 EGLL LSGG 99 MID 14:41:00 14:41:00 SEAFORD 988
Wake Vortex separations are applied according ICAO doc 44.44.
Departure Metering EEC Note No xx/08 9EUROCONTROL Departure Metering - Analytical Model Based Experiments The runway sequencer must ensure the SID separations but he adapts the departure sequence in order minimize overall SID and Wake Vortex separation delays. The goal of SID separations is to avoid successive departures into the same adjacent sector and to distribute departures timely balanced into all concerned adjacent sectors. Good practice is to alternate departures from one airport onto different SIDs in order to smooth sector load in all adjacent sectors which deal with departure traffic. The separation constraint applied to successive departures on one SID is defined for all airports for all SIDs in chapter 4. The runway sequencer shall balance Wake Vortex separations and SID separations in order to minimise overall delay and in order to maximise throughput. Time constraints like Departure Metering slots or CFMU slots must be respected to a possible maximum. The Planning algorithm core performs one sequence optimization for all aircraft and returns the optimized Take Off sequence and after deduction of the respective Taxi times this corresponds to the optimized Off block sequence. Taxi times are not detailed. This would go to deep into airport details without impacting the analysis of Departure Metering. A constant and equal taxi time is assumed for all departures. This leads to the introduction of a taxi time error for each departure (real minus assumed time). The planning algorithm normally relies on precise taxi times. The preceding simplification introduces an error into the departure sequence which corresponds to the introduced taxi time error. The results presented in this document are always comparisons with a baseline case and the introduced error is exactly the same in two compare cases. The results based on such comparisons are therefore not influenced by the simplifying constant taxi time assumption. 3.3. AIRCRAFT OPERATIONS MODEL The aircraft model – medium fidelity with navigation accuracy: Medium fidelity means that the model navigates accurately a default climb trajectory according to the aircraft type’s performance. But it does not reflect the relation between climb rate and aircraft speed if one of these parameters is altered. Therefore Departure Metering can not change aircraft speed or climb rate from the original departure 4D trajectory. This constraint is acceptable because such changes are out of the scope of this document. Departure Metering only shifts the original 4D trajectory in time applying ground holding (take off delays) to aircraft. Departure Metering only acts on the Take-off time. 3.4. SIMULATED ENVIRONMENT London airports Luton, Gatwick, Stansted, Heathrow and City. The geographical limits correspond to the London TMA, see chapter 4 below. On the busiest days in 2006 there were up to 3600 departures and arrivals per day. Heathrow represents roughly a third of these movements and Gatwick follows with about 800 movements a day. London City is the smallest of these airports and it represents about 280 movements per day. 10 Departure Metering EEC Not No 03/08
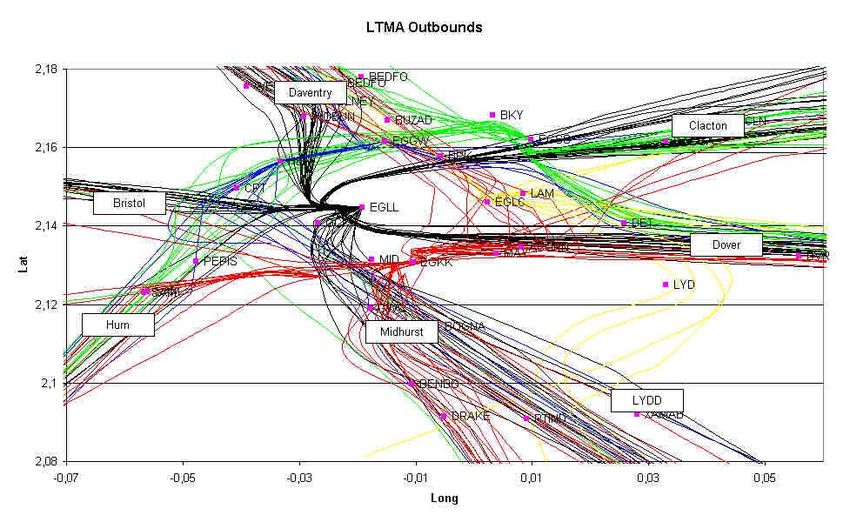
Departure Metering - Analytical Model Based Experiments                             EUROCONTROL

4.   AIRSPACE

The London TMA airspace and route structure is taken from traffic data and from NATS
Aeronautical Information Service. These data are not altered during the experiments.
Airspace redesign is out of the scope of Departure Metering analysis. The principal
airspace item used by Departure Metering is the flying time from runway to the metering
fix. This time needs to be evaluated for all flown runway – fix combinations and all used
aircraft types.

Below, see the principal London departures tracks.

Runways:

For all simulated runways there is used the above described Departure runways model –
integrating Wake Vortex and SID constraints, but without runway configuration change
ability. The runway model considers physical aircraft capacities for different speed classes
and weight classes. They are expressed in SID constraints and Wake Vortex constraints,
see chapter 3.2. The runway model integrates CFMU slots too and of course Departure
Metering time constraints.

Departure Metering EEC Note No xx/08                                                          11
EUROCONTROL                                   Departure Metering - Analytical Model Based Experiments

The CFMU slots for the 2006 traffic sample correspond to the real traffic and its attributed
CFMU slots. The future traffic samples underwent the CFMU slot allocation algorithm too.
The CFMU slot allocation algorithm was applied on the complete future traffic samples
which represent the entire ECAC traffic and slots were attributed according to that global
traffic situation. The London departures and arrivals were extracted from the ECAC wide
traffic sample including all slots and the CFMU slots attributed to London departures
correspond therefore to the ECAC wide traffic situation.

SID dependencies:

                         Standard Instrument Departure Routes
                         (SID)
                         MAY      BPK     DVR       DET      MID          SAM      CPT    WOB    NO_ROUTE
SID           MAY        M120             M120      M120     M90                                 M120
              BPK                 M120                                                    M90    M120
              DVR        M120             M120      M120     M90                                 M120
              DET        M120             M120      M120     M90                                 M120
              MID        M90              M90       M90      M120         M90      M90           M120
              SAM                                            M90          M120     M90           M120
              CPT                                            M90          M90      M120          M120
              WOB                 M90                                                     M120   M120
              NO_ROUTE   M120     M120 M120         M120     M120         M120     M120   M120   M120

M90 means: Minimum 90 seconds separations between jets. The separation is adapted for
other speed groups according the speed difference, i.e. augmented for fast aircraft
following slow aircraft.
M120 means: Minimum 120 seconds separations between jets. The separation is adapted
like above.
An empty field means that there is no dependency between the SID on the vertical axis
and the SID on the horizontal axis.
The values for Gatwick and Heathrow were extracted from the ‘RUNWAY EVENT
SCHEDULE OPTIMISATION’ project, [6]. There were no precise values available for the
other airports. The Luton, Stansted and City SID separations were evaluated on the basis
of Heathrow / Gatwick values. For similar situations similar separation values are applied.

Minimum Wake Vortex separations

For the experiment the following matrix, based on ICAO doc 44.44 (except A380), is applied:

WC2                         weight category
                            L          M          H         A380         ?
weight
category          L              60        60          60          60         60
                  M             120        60          60          60        120
                  H             120       120          60          60        120
                  A380          180       150          90          60        180
                  ?             180       150          90          60        180

12                                                                      Departure Metering EEC Not No 03/08
Departure Metering - Analytical Model Based Experiments EUROCONTROL 5. TRAFFIC DESCRIPTION The traffic samples cover a 24 hours period and they contain all departures and as well all arrivals for the mixed runways, see Annex A. Departure Metering EEC Note No xx/08 13
EUROCONTROL                                  Departure Metering - Analytical Model Based Experiments

6.      EVALUATION METHOD

The evaluation method is comparison to a baseline case which represents today’s
situation or a future situation without Departure Metering.
The baseline case contains no time constraints except of the CFMU slots.

6.1. SCENARIOS

     1. Baseline 2005 (no Departure Metering).
     2. 2005, with Departure Metering acting at Pushback time (short time horizon).
     3. 2005, with standard Departure Metering (long time horizon).
              •    sub scenarios: different delay – ‘de-bunching’ efficiency combinations are
                   covered.
              •    ATC airport setup: Single Mixed runways except Heathrow (One Dedicated
                   departure runway).
     4. Baseline 2006 (no Departure Metering).
     5. 2006, with standard Departure Metering (long time horizon – the short time horizon
        version is less performing, see chapter 7, and supposed to be outdated by 2012.
        The 2006 results shall compare to both following future samples. Therefore the
        same time horizon is applied to 2006, 2012 and 2020).
              •    sub scenarios: different delay – ‘de-bunching’ efficiency combinations are
                   covered.
              •    Airport setup as above.
     6. Baseline 2012 (no Departure Metering).
     7. 2012, with standard Departure Metering (long time horizon – the short time horizon
        version is less performing and supposed to be outdated by 2012).
              •    sub scenarios: different delay – ‘de-bunching’ efficiency combinations are
                   covered.
              •    Airport setup as above.
     8. Baseline 2020 (no Departure Metering).
     9. 2020, with standard Departure Metering (long time horizon – the short time horizon
        version is less performing and supposed to be outdated by 2020).
         •        sub scenarios: different delay – ‘de-bunching’ efficiency combinations are
                  covered.
         •        Airport setup as above.

14                                                                Departure Metering EEC Not No 03/08
Departure Metering - Analytical Model Based Experiments EUROCONTROL 6.2. METRICS AND INDICATORS DM-S-1: Synchronization of Departures from several neighboring airports to particular TMA exit fixes shall avoid random occurrences of ‘bunching’ over these fixes. A safety criteria is whether and to which extend TMA Departure Metering can smoothen the traffic (avoid bunching). A metric is % reduction of number of aircraft in bunches compared to non metered traffic (baseline – do nothing – scenario). DM-E-2: The main measure is local impact on runway throughput (per runway) compared to non metered departure flow which is for the time being the state of the art. The metrics’ unit is departures per hour: • Throughput non metered departure flow • Throughput metered departure flow with different slot widths Average delay is a metric which depends on throughput. Average delay is very useful as TMA departure efficiency metric because it reflects the difference between throughput demand and really achieved throughput. DM-E-1: Efficiency figures are as well quantitative metrics: • Number of missed departure slots (Single Airport Departure Metering – slots calculated from TTA) DM-C-1: The TMA exit throughput is measured in number of departures over flying all TMA exit points per hour. The TMA exit capacity is the value of the maximum throughput. DM-C-2: All runway departure capacities: A runway departure capacity is the value of its maximum throughput. So each experiment running over 24 hours indicates a departure capacity for all involved runways / airports (runway equals airport because there is only one departure runway per airport). 6.3. ANALYSIS The analysis uses Excel spread sheets and Excel functions for diagram purposes. The produced diagrams generally show a metric, see above, against time. Departure Metering EEC Note No xx/08 15
EUROCONTROL                                  Departure Metering - Analytical Model Based Experiments

7.       STUDY ON DIFFERENT DEPARTURE METERING TIME HORIZONS (DM-E-1,
         DM-E-2, DM-S-1)

Departure Metering algorithm’s time horizon (time before aircraft over fly the metered fix) is
expected to have an impact on the ‘de-bunching’ solutions quality. NATS considered the
option to apply the algorithm for each departure at Off-Block time. A longer time horizon
means to apply Departure Metering to an aircraft 10 or more minutes before Off-Block
time. This should be possible on future traffic samples due to progress made in Off block
time prediction on the airport CDM side (see http://www.euro-cdm.org/).

DM with Extended Time horizon shall be compared to DM at Off-Block time.
Application of Departure Metering per aircraft before Off-Block time (Extended Time
horizon) leads to a Pre-Departure Sequence wherein time constraints should be
transparent to the aerodrome controllers because all departures are sequenced and the
time constraints are reflected indirectly by the aircraft’s position in the Pre-Departure
Sequence.

7.1. EXPECTATIONS

Departure Metering at Off-Block time:
In the NATS proposal the algorithm is triggered for each pushback request at pushback
request time. In that case there is only one solution for resolving the problem:

     •        The algorithm triggered by a particular pushback request detects a bunch because
              this particular aircraft triggers the bunch. All the other aircraft in the bunch are
              known to the algorithm because they already had been treated at their pushback
              (not yet creating a bunch) and therefore they had not been delayed and they
              already move towards the considered metering fix. It is too late to delay them, see
              environmental aspects 3.1.1. Only the triggering aircraft can be delayed as it is still
              on block, pushback having not yet been agreed by the Controller.

16                                                                Departure Metering EEC Not No 03/08
Departure Metering - Analytical Model Based Experiments EUROCONTROL
For the considered bunch, see below, the triggering aircraft (number 10) is the latest
pushing back but it is not the latest aircraft in the bunch over the fix. This is due to
differences in flying time to the fix.
Aircraft no. 9 is the latest in the bunch offering the most optimal solution for solving the
bunch: ac9 must be delayed a few seconds to solve the bunch (delay it after the bunch)
whilst ac10 must be delayed much longer to solve the bunch.
Application of the most optimal solution is only possible with an extended time horizon so
that the bunch will be considered while all involved aircraft are still On Block. Then the
complete set of solutions to the bunch is available and the best solution (minimum delay)
will be chosen.
Therefore it is expected that the extended time horizon improves Departure Metering’s
efficiency.
DM extended time horizon – different levels of efficiency
bunch
1 2 4 5 10 6 8 7 9
Time over Metering Fix
Departure Metering EEC Note No xx/08 17EUROCONTROL Departure Metering - Analytical Model Based Experiments
7.2. RESULTS
Both time horizons (at Off-Block time and Extended) shall be compared in terms of delay
and throughput (Runway Sequence efficiency). The comparison is only meaningful when
the same ‘de-bunching’ efficiency is considered for both cases:
Baseline case, traffic sample 2005, traffic over fixes SFD, DTY, CLN and DVR.
The horizontal 100% line is the maximum allowed bunching according to applied
parameters. E.g. if the maximum allowed is 5 aircraft in 10 minutes, then 6 aircraft in 10
minutes would correspond to 120% and this is considered as a bunch.
Bunching BASELINEbefo
– NO
re Departure
Metering
250
200
150
% bunching
SFD
DTY
CLN
DVR
100
50
0
0 100 200 300 400 500 600 700 800 900
t [ minutesof day]
18 Departure Metering EEC Not No 03/08Departure Metering - Analytical Model Based Experiments EUROCONTROL
This preceding baseline case shows frequent bunches (anything above 100%) and it
clearly shows that SID separation is insufficient to smoothen traffic from five airports to the
surrounding TMA exit fixes. The different colors correspond to the TMA exit fixes Seaford,
Daventry, Clacton and Dover. These cover the traffic leaving the London TMA north, east
and southbound.
Unbunched Case: Same traffic sample, same set of fixes. Bunching is reduced by 87%
from 725 aircraft in bunches to 95 aircraft in bunches.
Bunching COMPARE CASE - with Departure
Metering after
160
140
120
100
% bunching
CLN
DTY
80
DVR
SFD
60
40
20
0
0 100 200 300 400 500 600 700 800 900
t [minutesof day]
This preceding ‘unbunched case’ indicates a significant reduction of bunches. It will be the
reference ‘de-bunching’ result for the following comparisons which compare the different
time horizons (DM for each departure at Off-Block time versus Extended Time horizon).
Both differ in terms of runway sequence efficiency, see next chapter, but both deliver the
same results in terms of ‘de-bunching’.
Departure Metering EEC Note No xx/08 19EUROCONTROL Departure Metering - Analytical Model Based Experiments
7.2.1. Delay
In the context of Departure Metering delay means departure delay.
Arrival delay is measured for all mixed runways but not analyzed. Arrival delay is Actual
Time of Arrival minus initially Estimated Time of Arrival.
The worst case of Arrival delay is pointed out in chapter 9.2.1.
Departure Delay is
• the Actual Take Off Time
compared to
• Estimated Off Block Time from Flight Plan + taxi time + time to push back + time to
line up
Delay = ATOT – (EOBT + time from stand to line up)
Queuing time is part of ‘time from stand to line up’. This time is assumed constant and the
related error is considered in the evaluation of results, see taxi time in chapter 3.2.1. The
constant queuing time assumption is possible in a Departure Manager context where delay
is absorbed on stand and not at the holding.
In the used model the aircraft is supposed to be ready to go Off-block at its EOBT. Delay
due to landside problems or turn around problems are not known by the used model.
Delay figures in this document are 24 hour averages for either one airport or all five
airports together.
20 Departure Metering EEC Not No 03/08Departure Metering - Analytical Model Based Experiments EUROCONTROL
The following graph compares the runway sequence efficiency in terms of average delay
in seconds based on the traffic sample 2005, see Annex A.
The compared cases are:
• Blue: Bunching BASELINE – NO Departure Metering
• Red: Bunching reduced by 87% - DM at Off-Block time
• Yellow: Bunching reduced by 87% - DM Extended Time Horizon
600
500
400
delay [s]
baseline (free flow)
300 DMat Pushback
DMextended time horizon
200
100
0
EGLL EGKK EGGW EGLC EGSS average
Evaluated are all considered airports (Heathrow, Gatwick, Luton, City and Stansted) and
the average of all airports. The delay figures per airport are already an average of all
departures over the entire day.
Departure Metering EEC Note No xx/08 21EUROCONTROL Departure Metering - Analytical Model Based Experiments
Runway sequence efficiency results summary (Delay as Efficiency metrics):
• The baseline case has the lowest delay and therefore the highest runway sequence
efficiency. The explanation is that Departure Metering is off in this case. Therefore
the runway sequences incorporate no DM time constraints and it can be more
efficient. Bunching is at 725 aircraft in bunches with a traffic sample of 1618
departures (44% bunching).
• Departure Metering at Off-Block time approximately doubles the average delay but
reduces bunches by 87%. The DM time constraints have a negative impact on the
runway sequence which causes the delay.
• Departure Metering with Extended Time Horizon is delay wise between the above
cases but with the same level of de-bunching as standard DM. It improves the delay
results from Departure Metering at Off-Block time considerably (except London
City). It is off course less efficient than the baseline case which corresponds to
unconstrained free flow. The Extended Time Horizon compared to DM at Off-Block
time improves the delay figures by 19%. The tendency of these results was
expected, and the magnitude of these results allows promoting the Extended Time
Horizon.
• To be fair it must be stated that the baseline free flow case does not exist. NATS
frequently applies MDI (Minimum Departure Intervals) for some Heathrow SIDs and
Gatwick SIDs. These SIDs are WOBUN, DVR, MID, LAM, BOGNA/HARDY. An MDI
is an augmented SID separation. For instance frequently applied is 1 in 4 for
Heathrow flights using the WOBUN SID. This means on top of the minimum SID
separation of 2 minutes for successive flights there is applied a ‘Not more than 1
flight in 4 minutes’. This kind of operations should be the true baseline for
comparisons but we were not able to obtain enough reliable data to simulate MDIs.
22 Departure Metering EEC Not No 03/08Departure Metering - Analytical Model Based Experiments EUROCONTROL
7.2.2. Throughput
The following graph shows the same results than the previous one but the comparison is
done in terms of runway throughput instead of delay (Heathrow only). The compared
cases are:
• Yellow: Bunching BASELINE – NO Departure Metering.
• Blue: Bunching reduced by 87% - DM at Off-Block time.
• Red: Bunching reduced by 87% - DM Extended Time Horizon.
Heathrow Runway Throughput (one dedicated departure runway)
60
50
throughput [ departures/hour]
40
DMat Pushback
30 DMextended time horizon
free flow (baseline)
20
10
0
1 2 3 4 5 6 7 8 9 10 11 12 13 14 15 16 17 18 19 20 21 22
t [hour]
The other airports’ throughputs, unlike Heathrow, depend much on the arrival situation.
These throughput results are much less eloquent than the delay comparison. Careful
analysis of these throughput figures should allow confirming the delay graph’s tendency
Departure Metering EEC Note No xx/08 23EUROCONTROL Departure Metering - Analytical Model Based Experiments
because queuing and therefore delay result from the difference between throughput
demand and achieved throughput.
Delay seems much clearer as Efficiency metric than throughput and delay expresses as
well the main interest of the passengers who are the final customers.
7.2.3. Missed Departure Metering Slots
250
200
150
number of slots
DMslots
missed DMslots
100
50
0
EGGW DM EGGW EGKK DM EGKK EGLC DM EGLC EGLL DM EGLL EGSS DM EGSS
at extended at extended at extended at extended at extended
Pushback time horizon Pushback time horizon Pushback time horizon Pushback time horizon Pushback time horizon
The number of missed slots depends on the traffic sample but it is in general small (~2.5%
for both time horizons over all airports). For this traffic sample Heathrow has 11 missed
slots from a total of 250 slots from a total of 620 departures. These values correspond to
the substantial reduction of bunching of 87%.
An aircraft misses its slot when it exceeds the slot limits of +2, -3 minutes.
24 Departure Metering EEC Not No 03/08Departure Metering - Analytical Model Based Experiments EUROCONTROL
Gatwick missed Slots (DM-slots and CFMU-slots):
140
120
100
80
cfmu slots
no of slots
missed cfmu slots
DM slots
missed DM slots
60
40
20
0
EGKK DM at Pushback EGKK extended time horizon
The number of Departure Metering slots is roughly of the same magnitude than the
number of CFMU slots.
7.2.4. Time constraints in the Departure Process Model
For a large number of time constraints (departure slots) the analytical controller model is
believed to be more efficient than human runway or ground controllers, see assumption
chapter 2.3. This plays a role only for the 2005 or 2006 scenario where in reality the
departure process is entirely human controlled. For the 2012 and 2020 scenarios
Departure Management is expected to be in place on the main airports in order to assist
controllers to optimise the integration of time constraints. Then the used analytical model is
expected to be well adapted but the model suites expeditious departure runway
sequencing (only few slots = state of the art for the time being) as well.
Departure Metering EEC Note No xx/08 25EUROCONTROL Departure Metering - Analytical Model Based Experiments
8. TRADE OFF – CONSTRAINTS ON UPSTREAM TRAFFIC VERSUS REDUCTION
OF BUNCHING (DM-E-2, DM-S-1)
The used traffic sample represents traffic from 18th of July 2006 with 1790 departures from
the five major London airports (which is 9% traffic increase compared to the 2005 samples
from the previous study).
Impact on Upstream Traffic shall be concentrated on ground delay and environmental
aspects see 3.1.1, shall be integrated.
The trade off considers a set of Departure Metering solutions looking at their respective
global efficiency of reduction of bunching and looking at their respective prices to pay in
terms of additional delay.
The efficiency of reduction of bunching shall be determined by comparison with one
baseline case described next chapter.
The additional DM delay shall be determined by comparison with this same baseline case.
8.1. BASELINE CASE
Average delays on the five airports and overall average:
Baseline
300
250
200
average delay [s]
150 Baseline
100
50
0
EGLL EGKK EGGW EGLC EGSS average average standard
deviation
The average delay over all 1790 departures from all five airports is 194 seconds. There
are 934 aircraft in bunches according to criteria see chapter 3.1. More than half of all
aircraft are involved in bunches.
To be fair it must be stated that the baseline free flow case does not exist. NATS
frequently applies MDI (Minimum Departure Intervals) for de-bunching purposes for some
26 Departure Metering EEC Not No 03/08Departure Metering - Analytical Model Based Experiments EUROCONTROL
Heathrow SIDs and Gatwick SIDs. These SIDs are WOBUN, DVR, MID, LAM,
BOGNA/HARDY. An MDI is an augmented SID separation. For instance frequently applied
is 1 in 4 for Heathrow flights using the WOBUN SID. This means on top of the minimum
SID separation of 2 minutes for successive flights there is applied a ‘Not more than 1 flight
in 4 minutes’. This kind of operations should be the true baseline for comparisons but we
were not able to obtain enough reliable data to simulate MDIs. Therefore all comparisons
are done against the above described baseline case.
8.2. THE MODEL – DETAILED IN ANNEX B
At this point of the document it seems appropriate to look at the Setup of the used
Analytical Model – see Annex B.
Annex B points out that the delay (blue curve) augments with improved reduction of
bunching. The delay approaches a maximum value when the bunching (red curve)
approaches zero:
Baseline
bunching
delay
bunching
Baseline
delay Zero
bunching
Intensification of Departure Metering
action
This relation is approximately true for each airport’s delay analysis but it is very accurate
for the average delay (average all departures, all airports) and for the bunching measures
averaged on all metered fixes.
8.3. TRADE-OFF DIAGRAM
The Trade-Off between average delay and reduction of bunching can be determined using
one curve which shows average delay against reduction of bunching. The values average
delay and bunching [%] correspond to the previous bar diagrams for the 2006 traffic
sample. Several points were measured by simulation and a curve had been matched
through these points. The low, right end of the curve corresponds to the baseline case
Departure Metering EEC Note No xx/08 27You can also read