Identification of 27 abnormalities from multi-lead ECG signals: an ensembled SE_ResNet framework with Sign Loss function
←
→
Page content transcription
If your browser does not render page correctly, please read the page content below
Physiological Measurement

PAPER • OPEN ACCESS

Identification of 27 abnormalities from multi-lead ECG signals: an
ensembled SE_ResNet framework with Sign Loss function
To cite this article: Zhaowei Zhu et al 2021 Physiol. Meas. 42 065008

View the article online for updates and enhancements.

                               This content was downloaded from IP address 46.4.80.155 on 25/09/2021 at 02:22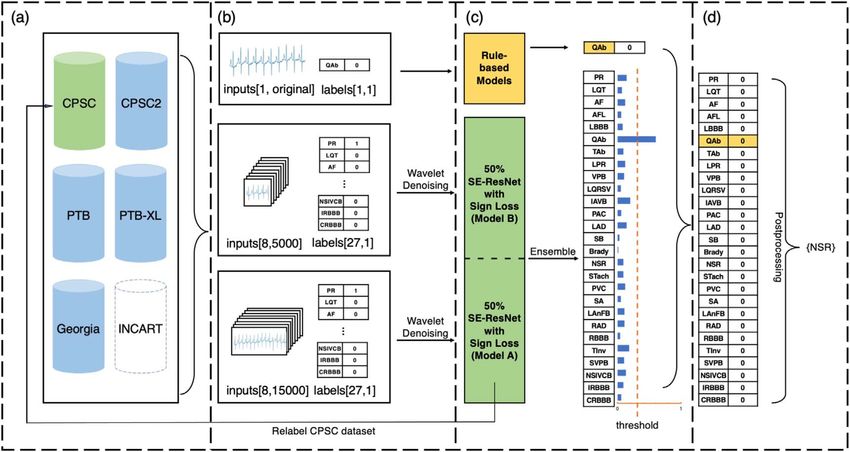
Physiol. Meas. 42 (2021) 065008                                                              https://doi.org/10.1088/1361-6579/ac08e6

                              PAPER

                              Identification of 27 abnormalities from multi-lead ECG signals: an
OPEN ACCESS
                              ensembled SE_ResNet framework with Sign Loss function
RECEIVED
24 December 2020
                              Zhaowei Zhu1,6, Xiang Lan2,6, Tingting Zhao1, Yangming Guo1, Pipin Kojodjojo3, Zhuoyang Xu1, Zhuo Liu1,
REVISED
25 May 2021
                              Siqi Liu4, Han Wang2, Xingzhi Sun1,∗ and Mengling Feng2,5,∗
                              1
                                  Ping An Technology, Beijing, Peopleʼs Republic of China
ACCEPTED FOR PUBLICATION
                              2
7 June 2021                       Saw Swee Hock School of Public Health, National University Health System, National University of Singapore, Singapore
                              3
                                  Yong Loo Lin School of Medicine, National University Health System, National University of Singapore, Singapore
PUBLISHED
29 June 2021
                              4
                                  NUS Graduate School - Integrative Sciences and Engineering Programme (ISEP), Singapore
                              5
                                  Institute of Data Science, National University of Singapore, Singapore
                              6
                                  These two authors are joint first authors.
Original content from this    ∗
                                  Authors to whom any correspondence should be addressed.
work may be used under
the terms of the Creative     E-mail: SUNXINGZHI820@pingan.com.cn and ephfm@nus.edu.sg
Commons Attribution 4.0
licence.                      Keywords: ECG signal, deep neural network, multi-label classification, ensemble modeling, ECG abnormalities
Any further distribution of
this work must maintain
attribution to the
author(s) and the title of    Abstract
the work, journal citation
and DOI.                      Objective. Cardiovascular disease is a major threat to health and one of the primary causes of death
                              globally. The 12-lead ECG is a cheap and commonly accessible tool to identify cardiac abnormalities.
                              Early and accurate diagnosis will allow early treatment and intervention to prevent severe
                              complications of cardiovascular disease. Our objective is to develop an algorithm that automatically
                              identifies 27 ECG abnormalities from 12-lead ECG databases. Approach. Firstly, a series of pre-
                              processing methods were proposed and applied on various data sources in order to mitigate the
                              problem of data divergence. Secondly, we ensembled two SE_ResNet models and one rule-based
                              model to enhance the performance of various ECG abnormalities’ classification. Thirdly, we introduce
                              a Sign Loss to tackle the problem of class imbalance, and thus improve the modelʼs generalizability.
                              Main results. In the PhysioNet/Computing in Cardiology Challenge (2020), our proposed approach
                              achieved a challenge validation score of 0.682, and a full test score of 0.514, placed us 3rd out of 40 in
                              the official ranking. Significance. We proposed an accurate and robust predictive framework that
                              combines deep neural networks and clinical knowledge to automatically classify multiple ECG
                              abnormalities. Our framework is able to identify 27 ECG abnormalities from multi-lead ECG signals
                              regardless of discrepancies in data sources and the imbalance of data labeling. We trained our
                              framework on five datasets and validated it on six datasets from various countries. The outstanding
                              performance demonstrate the effectiveness of our proposed framework.

                              1. Introduction

                              Cardiovascular disease is one of the primary causes of death globally, resulting in an estimated 16.7 million
                              deaths each year, according to the World Health Organization Gaziano et al (2010). Early and accurate diagnosis
                              of ECG abnormalities can prevent serious complications such as sudden cardiac death and improve treatment
                              outcomes Artis et al (1991).
                                   The 12-lead ECG is a cheap, widely available tool to screen for heart disease screening Kligfield et al (2007).
                              However, the ECG interpretation requires experienced clinicians to carefully examine and recognize
                              pathological inter-beat and intra-beat patterns. This process is time-consuming and subject to inter-observer
                              variability Bickerton and Pooler (2019). Hence, an accurate algorithm for automated ECG pattern classification
                              is highly desirable.
                                   Some earlier works have reported automated analysis of ECG Martínez et al (2004), Minami et al (1999),
                              Mahmoodabadi et al (2005), Alexakis et al (2003). These approaches are mainly based on frequency domain

                              © 2021 Institute of Physics and Engineering in Medicine
Physiol. Meas. 42 (2021) 065008                                                                                                Z Zhu et al

   Figure 1. The framework design of the proposed method. (a) The 5 datasets used in training stage. i.e. data from the China
   Physiological Signal Challenge 2018 (CPSC and CPSC2), the Physikalisch-Technische Bundesanstalt databases (PTB and PTB-XL),
   and the Georgia 12-lead ECG Challenge (Georgia) database. St.Petersburg Institute of Cardiological Technics 12-lead Arrhythmia
   Database (INCART) was excluded from our training data. Details of datasets shown in appendix table A1. (b) Data pre-processing and
   relabeling of the CPSC dataset: three types of inputs are made as the inputs of the models after wavelet denoising. CPSC dataset is
   relabeled by Model A. (c) Model ensemble: one rule-based model and two SE_ResNet models are ensembled to enhance the
   performance of various ECG abnormalities’ classification (full name shown in appendix table A2). (d) Post-processing: signals that
   were predicted to be negative for all classes in the final result would be classified as positive for sinus rhythm (NSR).

features, time-frequency analysis, and signal transformations (i.e. wavelet transform and Fourier transform).
However, such techniques are not capable of capturing complex features of the ECG signal.
    More recently, a number of works have demonstrated the ability of nonlinear machine learning techniques
in the field of ECG analysis. Vafaie et al (2014) proposed a classifier to predict heart diseases, in which a fuzzy
classifier was constructed with a genetic algorithm to improve prediction accuracy. Chen et al (2018) designed a
gradient boosting algorithm to detect atrial fibrillation. Piece-wise linear splines were used to select features. The
performance of those approaches is limited by the choices of input features to the models. The input features are
typically carefully selected, which requires time and expert knowledge to verify the feasibility.
    In recent years, deep learning and neural networks, especially the convolutional neural networks (CNNs)
LeCun et al (1995), have gained promising results in many areas such as computer vision Krizhevsky et al (2017)
and natural language processing Devlin et al (2018). CNNs have been used for ECG abnormalities detection
based on ECG signal, Xiong et al (2018) developed a 21-layer 1D convolutional recurrent neural network to
detect atrial fibrillation, which was trained on single-lead ECG data. Sodmann et al (2018) proposed a CNN
model to improve detection performance by annotating QRS complexes, P waves, T waves, noise, and inter-beat
of ECG segments. Elola et al (2019) developed two deep neural networks for classifying pulse-generating rhythm
and pulse-less electrical activity using short single-lead ECG segments. Warrick and Homsi (2018) designed an
ensemble deep learning model for automatic classification of ECG arrhythmias based on single-lead ECGs,
which fused the decisions of ten classifiers and outperformed the single deep classifier. Hong et al (2019)
proposed a multi-level knowledge-guided framework that can extract beat, rhythm, and frequency level features
separately. These neural network based solutions considerably improved performances as they are able to better
capture the underlying complex and nonlinear relationships in data. Therefore, we also utilize neural networks
in our methods.
    Most of the previous works focus on one or at most 9 ECG abnormalities’ classification Wang et al (2019),
Luo et al (2019), Huang et al (2019), Xia et al (2019), Elola et al (2019), Irusta et al (2019), Krasteva et al (2020).
Therefore, we aim to develop a robust model that can generalize to 27 different types of ECG abnormalities. In
addition, most of the existing works only deal with single-lead ECG signals Andreotti et al (2017), Billeci et al
(2017), Bin et al (2017), Warrick and Homsi (2018), while in clinical practice, 12-lead ECGs are more commonly
used for abnormality detection and diagnosis. Hence, we developed a model that efficiently analyses 12-lead
ECG to capture the full picture of potential abnormalities.
    The novel contributions of this work can be summarized as follows. First, We develop a robust deep learning
framework that is able to identify 27 types of ECG abnormalities by analysing eight leads ECG signals from

                                                       2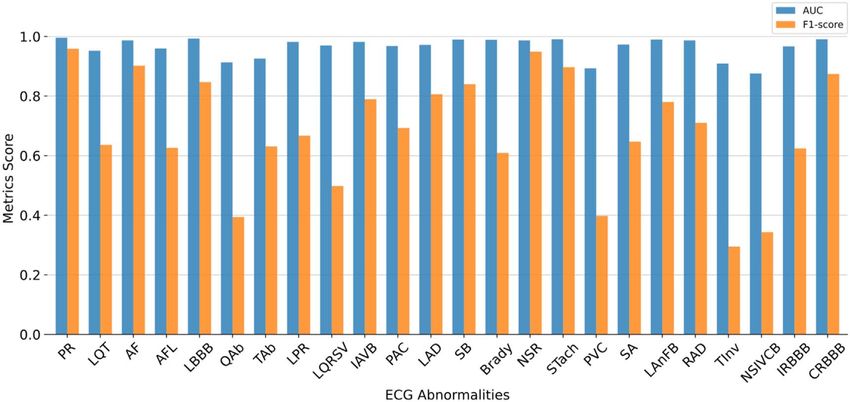
Physiol. Meas. 42 (2021) 065008                                                                            Z Zhu et al

multiple 12-lead ECG datasets. Second, the proposed framework employs a series of novel ECG signal processing
methods, including multi-source data pre-processing that mitigate the data divergence problem, model
ensemble that improve the framework’s generalizability, and Sign Loss function that reduce the negative effects
caused by class imbalance. Third, to validate the effectiveness of our proposed methods, extensive experiments
were conducted on six datasets across the world and examined in the PhysioNet/Computing in Cardiology
Challenge (2020). The considerable performance improvement over the state-of-the-art demonstrates the
effectiveness of our proposed methods.

2. Methods

In this section, we elaborate our proposed methods in identifying 27 ECG abnormalities from multi-source ECG
databases as illustrated in figure 1. We first introduce the datasets we used. Then we present the data pre-
processing techniques that reduce the data divergence, the design of the ensemble model that enables efficient
multi-label classification with multi-leads ECG, and the Sign Loss in tackling the class imbalance problem.
Finally, we present the evaluation metrics and our training setups.

2.1. Datasets
In PhysioNet/Computing in Cardiology Challenge (2020), the challenge data were partitioned into three parts,
i.e. training dataset, official validation set, and official test dataset. Organizers made the training data and their
corresponding diagnosis publicly available, whereas the official validation dataset and the official test dataset
were kept hidden. The official validation dataset helps contestants validate their models. However, the source
and size of which have not been published by the organizer. The official test dataset was used to calculate the final
score for ranking.

2.1.1. Training dataset
The public challenge training data consists of 43 101 12-lead ECG signals from six different datasets, as
summarized in appendix table A1. The sampling frequency of the signals varies from 257 to 1000 Hz, and the
length of the signals varies from 6 s to 30 min. There are 111 labeled abnormalities, where multiple labels may
correspond to the same type of abnormality. Therefore, 27 types of abnormalities are included in the final
scoring metrics. The details of the 27 ECG abnormalities are shown in appendix table A2.
    From these data, we created our offline training and validation dataset. Note that the INCART data was
excluded from our training data since it has only 74 30 min records with a sampling frequency of 257 Hz and is
significantly different from other datasets.

2.1.2. Offline validation dataset
After we processed the original training data as described in section 2.4, we randomly split 80% as the training set
(30 172 samples) and 20% as our offline validation set (7544 samples). To further validate our model’s
generalizability, an external dataset from the Hefei Hi-tech Cup ECG Intelligent Competition TIANCHI—Hefei
Hi-tech Cup ECG Intelligent Competition (2020) (Hefei dataset in short) was applied as external validation.
Hefei dataset consists of 40000 records of 12-lead ECG signals with a sampling frequency of 500 Hz and length of
10 s. Out of all the records, 6500 records with labels in the 27 types of ECG abnormalities we focused on were
randomly selected and formed an external validation set.

2.1.3. Official test dataset
The entire official test dataset contains 11 630 12-lead ECG recordings that were not represented in the training
data. The test data was drawn from the following three databases. Test Database 1: A total of 1463 ECGs from the
CPSC database. Test Database 2: A total of 5167 ECGs from the Georgia database. Test Database 3: A total of
10000 ECGs from an unspecified US institution.

2.2. Multi-source data pre-processing
The raw data were sampled from different sources, varying in sampling rate, signal amplitude, noise level, etc. To
better prepare the data for model training, we adopted the following data pre-processing techniques.

2.2.1. Processing original data
We first exclude data without a label in the 27 scored classes. PTB dataset was downsampled from 1000 to 500 Hz
to make the sampling frequency of all training data consistent. Then, we exclude lead III, aVR, aVL, and aVF
from the model’s input. This is because these four leads are linearly dependent on other leads and can be
calculated based on Einthovens Law Kligfield (2002) and Goldberger’s equations Goldberger et al (2018).

                                               3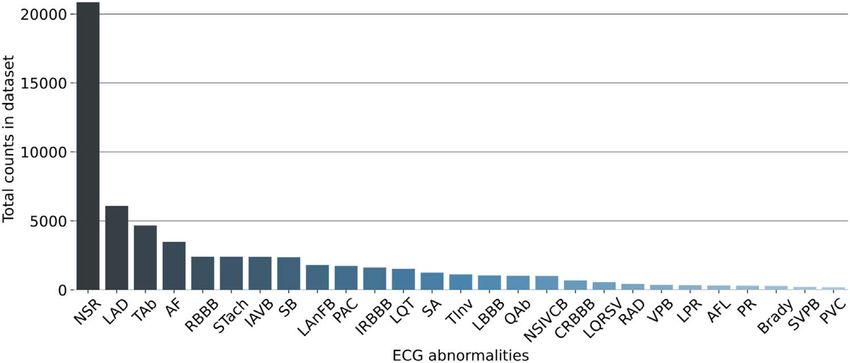
Physiol. Meas. 42 (2021) 065008 Z Zhu et al
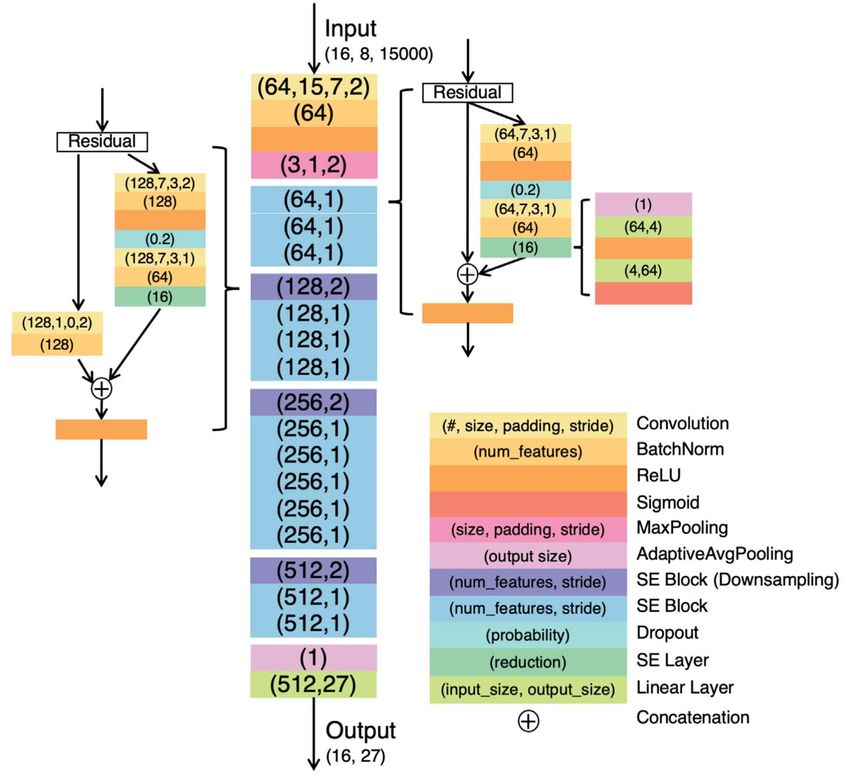
Figure 2. Architecture of the SE_ResNet model.
2.2.2. Truncating and padding
For the baseline model (i.e. single SE_ResNet), all input signals were fixed at 30 s in length. This was done by
truncating the part exceeding the first 30 s for longer signals and padding the shorter signals with zero. For the
other ensembled model, the input length was fixed at 10 s with the same pre-processing method.
2.2.3. Wavelet denoising
Biorthogonal wavelet transformation (bior2.6) was applied to reduce the noise in ECG signals. The numbers of
vanishing moments for the decomposition and reconstruction filters were 2 and 6, respectively. The level of
refinement was set to be 8, where the high-frequency coefficients in level 1, level 2, and level 8 were set to zero.
2.2.4. Relabeling CPSC data
CPSC dataset was relabeled because the original labels cover only nine classes and the distribution of the labels is
significantly different from other datasets. A SE_ResNet was first trained on the original training set and then
used for inferring pseudo labels on the CPSC dataset. For each ECG signal in the CPSC dataset, inferred pseudo
labels were added as new labels if (1) the inference output probability was higher than 0.8, (2) the labels not in the
original nine labels, and (3) the labels were in the 27 officially scored labels.
2.3. Multi-label classification with multi-leads ECG
To improve the accuracy and efficiency of multi-label classification with multi-leads ECG, we adopted the
following methods.
2.3.1. SE_ResNet
One important feature of the 12-lead ECG signal is that the information contained differs in different leads due
to the difference in signal voltage intensity and amplitude variation. Different ECG abnormalities may be more
apparent in specific leads. An equal importance of different leads could cause information losses, leading to
misdiagnosis.
Therefore, we use SE_ResNet Hu et al (2018) as our primary model to capture the distinctive information in
each of the multi-leads ECG signals, and the SE_ResNet architecture is shown in figure 2. More specifically, we
4Physiol. Meas. 42 (2021) 065008 Z Zhu et al
integrate sixteen squeeze-and-excitation (SE) blocks into the ResNet He et al (2016) structure. Each SE block
applies a squeeze operation and an excitation operation to the input tensor. The squeeze operation compresses
the global spatial information by using global average pooling and produces an embedding of the global
distribution of feature responses for each channel. Thus all the layers of the network can use the information
from the global receptive field. The excitation operation takes the embedding as input and captures the channel-
wise dependencies, then produces weights for each channel. Consequently, these weights are applied to
previously learned feature maps and realize the feature re-calibration.
In this way, some leads could be given higher weights, leading to a better prediction performance for multi-
leads ECG classification. Our baseline model is a SE_ResNet model with an input length of 30 s. Meanwhile, to
minimize the effect of padding on the shorter signals, another SE_ResNet model was trained with the input
length of 10 s and ensembled with the baseline model.
2.3.2. Rule-based model
The baseline model did not perform well on bradycardia, which indicates the heart rate is slower than one beat
per second. In other words, the R–R intervals between consecutive heartbeats are always longer than 1 second.
Therefore, we use Pan and Tompkins algorithm Pan and Tompkins (1985) to detect the R-peaks on lead I. Then,
R–R intervals could be easily calculated from the positions of consecutive R-peaks. The pseudocode of the rule-
based model for bradycardia is shown in algorithm 1.
Algorithm 1. Rule-based bradycardia classifier.
Input: List of R-R intervals
Output: Classification of bradycardia
brady_beats = 0;
foreach R-R interval
if 1s length of interval 1.6s
brady_beats +=1
if brady_beats/the number of R-R intervals 0.5
return True
elase
return False
However, a high recall and low precision were observed when we only applied the rule-based model to
classify bradycardia. It could be due to the low quality of labels in the datasets. Therefore, the rule-based model
was only applied when the prediction of bradycardia is negative from the ensembled model. The pseudocode for
the final bradycardia prediction is shown in algorithm 2.
Algorithm 2. Final bradycardia prediction.
Input: Prediction from ensembled model
Prediction from rule-based model
Output: Final classification of bradycardia
if Prediction from rule-based model is False
return False
else
return Prediction from ensembled model
(c) Model ensemble. Fusion is a common and effective method to improve generalizability. The idea of fusion in
this paper is to combine two models that receive different length input signals. More formally, the ensemble
model output g is calculated by:
g (x∣q1, q2) = 0.5 · f (x l1∣q1) + 0.5 · f (x l2∣q2) , (1)
Where x l1 and x l2 are the truncated input with length of l1 = 10 s and l2 = 30 s respectively (corresponding to the
data length of 5000 and 15000), and f (x∣q ) is the output of each SE_ResNet model with the parameters of θ.
Different data lengths could provide the model with multiple views of data. We further applied a NSR post-
processing to the model’s prediction. Specifically, as the signal contains at least one type of abnormality, signals
5Physiol. Meas. 42 (2021) 065008 Z Zhu et al
Figure 3. Total counts of 27 ECG abnormalities in the original dataset, from which we observed a significant class imbalance of the
dataset. Sinus rhythm (NSR) is present in more than 20000 recordings whereas PVC were detected in less than 200 samples. Such
imbalance could undermine the modelʼs performance, as the model is likely to learn the pattern from categories with a large number
of samples while ignoring the minorities.
that were predicted to be negative for all classes were classified to be positive for sinus rhythm (NSR) due to its
dominant ratio in the dataset.
2.4. Class imbalance
2.4.1. Sign loss
A significant issue observed in our data was class imbalance, shown in figure 3, which resulted in predictions
biased towards the majority class. Inspired by Sun et al (2019) , we designed an improved multi-label Sign Loss
for our model training. The loss is defined as follows:
y - 2py + p 2 ,∣ y - p∣ < 0.5
Sign ( p ) = ⎧ , (2)
⎨
⎩1 ,∣ y - p∣ 0.5
27
Loss = å Sign( pi ) ´ BinaryCrossEntropyLoss ( pi , yi ) , (3)
i=1
where y denotes the ground truth and p denotes the model’s estimated probability for y = 1. For the correctly
classified labels, a coefficient smaller than 1 was multiplied to the default binary cross-entropy loss. By doing so,
the accumulated loss from a large number of true negative labels became smaller, and the loss from the
misclassified labels became more prominent. Furthermore, the gradient of this loss function has a significant
change around 0.5, which enables our models to capture this change. Thus the optimal binarization threshold
will also be close to 0.5 and more robust.
2.5. Evaluation metrics
We adopted the official evaluation metrics from PhysioNet/Computing in Cardiology Challenge (2020) and
Alday et al (2020). To conform to real-world clinical practice, where some misdiagnoses are less harmful than
others, the misdiagnoses that end in similar outcomes or treatments as the ground truth diagnoses will still be
awarded partial credit. Only 27 anomalies of the total 111 anomalies in 6 datasets were included in the final
evaluation.
To be more specific, C = [ci ] defined as the collection of our predictions. The multiclass confusion matrix is
A = [a ij ], where aij is the normalized number of recordings in a database that were classified as belonging to class
ci but actually belong to class cj. The aij is calculated by a ij = å nk = 1 a ijk , where aijk is defined by
1
⎧ , if c i Î x k and c j Î yk
a ijk = x k È yk . (4)
⎨
⎩ 0, otherwise
For n ECG signal recordings, xk is the set of positive labels and yk is the collection of positive predictions for the
kth recording. Hence, the ∣ xk È yk ∣ is the number of unique classes with a positive label and predictions for
recording k. A reward metrics W = [wij ] is defined by the challenge organizer, where wij denotes the reward for a
positive classifier output for class ci with a positive label cj. Then, the unnormalized score will be calculated by
equation (5)
6Physiol. Meas. 42 (2021) 065008 Z Zhu et al
Table 1. Performance of different models on offline validation datasets. All the models are developed based on our baseline model. From this
table we select Model 6 as our best model. N denotes number of leads, L denotes input length, Tech1 denotes multi-source data pre-
processing, Tech2 denotes rule-based model for bradycardia, Tech3 denotes Sign Loss and Tech4 denotes NSR post-processing.
Model N L Tech1 Tech2 Tech3 Tech4 Offline validation score Hefei validation score
Model 1 12 15000 × × × × 0.682 0.241
Model 2 12 15000 ✓ ✓ × × 0.689 0.249
Model 3 12 15000 ✓ ✓ ✓ ✓ 0.673 0.300
Model 4 8 15000 ✓ ✓ ✓ ✓ 0.674 0.300
Model 5 8 5000 ✓ ✓ ✓ ✓ 0.674 0.236
Model 6 8 15000 and 5000 ✓ ✓ ✓ ✓ 0.683 0.319
m m
Unnormalized_Score = åå wij a ij , (5)
i=1 j=1
Unnormalized_Score - Inactive_Score
Normalized_Score = . (6)
Correct_Score - Inactive_Score
After normalization by equation (6), a score of 1 will be assigned to the classifier that always predicts the true
label, while a score of 0 will be assigned to an inactive classifier. The Inactive Score is the score for an inactive
classifier that always outputs a normal class, while the Correct Score is the score for the model that always
predicts the true class. The detailed calculation of Normalized_Score is shown in PhysioNet/Computing in
Cardiology Challenge (2020). The Normalized Score will be in the range between 0 and 1, and the higher the
score indicates the better performance of the model. We evaluate the Normalized Score in our offline validation
set and Hefei validation set.
2.6. Training setup
The proposed model was trained with a batch size of 16 for 19 epochs as the training loss was not further
decreasing. The model parameters were optimized with the Adam optimizer Kingma and Ba (2015). During
training, the learning rate was set as 0.001 and rescheduled to 0.0001 at the 13th epoch. The optimal binarization
threshold was found to be 0.36 on the offline validation dataset.
3. Results
3.1. Offline validation results
Table 1 shows the offline performance of different models we have tried based on our baseline model. Model 1 is
our baseline model that uses SE_ResNet as the framework. In Model 2, we apply wavelet denoising, add the
relabeled CPSC data to training data, and a rule-based model for bradycardia. The performance of Model 2
improved in both our offline validation dataset and Hefei validation set, compared to our baseline model.
However, we found that the problem of threshold shifting remained. To stabilize the threshold and enhance the
generalizability of our model, we introduce Sign Loss to Model 3 and apply NSR post-processing. Though Model
3 shows an inferior performance on our offline validation dataset, it shows better performance on the Hefei
validation set. To some extent, it can be explained that Sign Loss can improve the model’s generalization ability.
Based on Model 3, Model 4 and Model 5 only use eight leads signal data in 12-lead ECG to improve model
training efficiency. The length of signal input for Model 4 and Model 5 is 15000 and 5000, respectively. Both
models’ training time is less than that of Model 3, and the performance remains unchanged. Considering the
training efficiency, model performance, and model generalization, we ensemble Model 4 and Model 5 to form
Model 6. Model 6 obtain a score of 0.683 on the offline validation dataset and a score of 0.319 on the Hefei
validation set, which is better than both Model 4 and Model 5. Therefore, we select Model 6 as our best model.
3.2. Online testing results
Table 2 shows the official evaluated challenge scores and rank on (a) official validation dataset, (b) official test
database 1 and (c) official test database 2, (d) official test database 3 and (e) the entire official test dataset. The
official challenge ranking demonstrated the model’s ability to classify the ECG abnormalities despite the
challenges presented, e.g. noise in the signals and labels. Meanwhile, the difference between the official
validation score and the offline validation score is only 0.001, suggesting good generalizability and little
overfitting of the proposed model.
7Physiol. Meas. 42 (2021) 065008 Z Zhu et al
Figure 4. The best model’s performance on each ECG abnormality (full name shown in appendix table A2) in area under curve (AUC)
and F1-score. The AUC measures the model’s ability to identify the positive and negative samples when considering each ECG
abnormality. The F1-score evaluates the model’s performance of multi-label classification, which considers all abnormalities. From
the figure, we can see that the AUC for each ECG abnormality is relatively high, indicating that our model can classify each ECG
abnormality well when there is no intervention from other abnormalities. The fluctuation of the F1-score shows performance
decreases when all abnormalities are considered. This could be due to the high similarity of different ECG abnormalities feature spaces
that tend to affect the model.
Table 2. Performance of our best model on official evaluation datasets.
Official challenge
Official evaluation datasets Score ranking
Official validation dataset 0.682 3
Official test database 1 0.852 3
Official test database 2 0.649 2
Official test database 3 0.396 3
The entire official test 0.514 3
dataset
3.3. Detailed model performance analysis
There are 27 ECG abnormalities in the official evaluation, of which three pairs were treated as the same ECG
abnormality when the challenge organizers calculating the score. These three pairs are complete right bundle
branch block and right bundle branch block, premature atrial contraction and supraventricular premature
beats, premature ventricular contradictions, and ventricular premature beats (VPB). Based on this design, we
analyzed our models performance in 24 categories. Figure 4 shows the performance of our proposed method on
each ECG abnormality, from which we found the factors that may affect the models performance, shown below.
(1) Partial label: The AUC of each ECG abnormality is generally high, while the F1-score of some ECG
abnormality is at a low level. Likely, some anomalies in the data are not labeled, which leads to an excessive
prediction of false positives. Here are two possible reasons. Firstly, there are six datasets in total, each dataset
has only partial abnormalities, and no dataset has all 27 abnormalities. For example, atrial fibrillation and
sinus rhythm appear in all six datasets, with complete annotation and good overall model performance.
However, premature ventricular contractions and low QRS voltages only appear in two datasets, thus the
models performance is relatively low. The second reason could be annotation error, where some
abnormalities in a dataset are missing-labeled or wrongly labeled.
(2) Hard-to-detect features: Some characteristics of ECG abnormalities are hard to detect. For example, for
some cases in low QRS voltages, we found that the amplitude of the signal differs greatly. This could be due
to the difference in weights and heights habitus of patients, which affects the resistivity when sampling the
ECG signals.
8Physiol. Meas. 42 (2021) 065008 Z Zhu et al
(3) Feature confusion: We also found that characteristics between two ECG abnormalities could be too similar
for the model to classify. For instance, the characteristic of bradycardia is similar to sinus bradycardia since
both of them show a slow heart rate.
As we mentioned previously, the SE module in SE_ResNet can obtain the importance of each feature by
learning, and then enhance the useful features according to the weightage and suppress the features that are not
useful for the current task, so the performance of the model can be improved compared with the original
ResNet. In our proposed method, we integrate two SE_ResNet, which takes eight-lead ECG signal data with a
length of 5000 and 15000 as input, respectively. The integrated model outperforms the two sub-models, which
shows that the integrated model effectively combines the advantages of the two different input length settings.
Firstly, the length of the ECG samples in the datasets ranges from 2500 to over 100000. The larger input length
can contain more information in samples with longer signal length, while the smaller input length can make
samples with short length free from the information losses of padding in training. Secondly, some of the ECG
abnormalities show a characteristic of continuous repeat, while some occasionally appear. Hence, the larger
input length can capture the intermittent abnormal signal, while the smaller input can reduce the difficulty of the
neural network for anomaly detection.
4. Discussion
Existing deep learning methods for ECG classification mainly fall into two categories: CNN-based method and
sequence model-based method.
Compared to other CNN-based methods Min et al (2020), Chen et al (2020), Jia et al (2020) in the challenge,
our proposed ensemble model has several advantages, including
(1) A series of pre-processing methods to mitigate the problem of data divergence across various sources.
(2) SE modules that capture channel-wise relations thus improve the classification accuracy.
(3) Model fusion mechanism that effectively improves the model’s generalizability.
(4) Sign Loss function that tackles the class imbalance thus improve the model’s robustness.
However, an intrinsic property of CNN is that it focuses on morphological features and likely to lose
temporal information to some degree. Sequence models, on the other hand, are built to extract temporal
patterns. Some other teams in the challenge did employ the transformer Vaswani et al (2017) structure to
capture longer temporal dependencies of the ECG signal, and they have achieved promising results as well.
Therefore, we plan to investigate along this direction further in our future work.
In addition, the top-2 solutions Natarajan et al (2020), Zhao et al (2020) also take the static feature such as age
and gender into account, while we did not. Such demographics information may help the model to learn some
patient-specific ECG patterns.
Inspired by some of the promising ideas from the other top teams in the challenge, we, as future work, plan
to improve our work in the following aspects: (1) to combine ECG medical knowledge with deep learning to
construct a classification model. For example, use machine learning methods instead of traditional methods that
are not accurate enough to extract medical features such as R-R intervals, and combine them with the features
extracted by SE_ResNet to improve the interpretability and generalizability. (2) To develop a better model for
locating the abnormal signals. Many ECG abnormalities occur intermittently, and it is a challenging task to
locate the timing of abnormal signals in a long period of ECG data. An accurate locating of abnormalities present
in lengthy ECG data could help to better diagnosis in clinical practice.
5. Conclusions
In this paper, we propose a deep learning framework to automatically identify multiple ECG abnormalities.
Compared to previous works, the main contribution of our methods is three-fold. Firstly, our proposed
framework can classify 27 types of ECG abnormalities on eight-lead ECG signals, while previous works focused
on at most nine types of ECG abnormalities classification using single-lead ECG signals. Secondly, we introduce
a Sign Loss to mitigate the class imbalance problem and improve our framework’s generalizability. Thirdly, our
framework is developed on six different datasets across various countries, and we proposed several pre-
processing methods to target the diversity issue from different data sources, whereas previous works mainly use a
9Physiol. Meas. 42 (2021) 065008 Z Zhu et al
small dataset from a single data source. Our proposed framework is developed and validated on real-world
datasets, and we believe it has the potential to be deployed in clinical practice.
Acknowledgments
This project is supported by the National Research Foundation, Singapore under its AI Singapore Programme
(AISG Award No. AISG-100E-2020-055 and AISG-GC-2019-001), and the National University of Singapore
Start-up Grant (R-608-000-172-133). Any opinions, findings and conclusions or recommendations expressed
in this material are those of the author(s) and do not reflect the views of National Research Foundation,
Singapore.
Appendix
Table A1. Basic information of six different datasets that forms the
challenge training dataset.
Databases ECG recordings ECG abnormality categories
CPSC 6,877 9
CPSC2 3453 72
INCART 74 37
PTB 516 17
PTB-XL 21 837 50
Georgia 10 344 67
Table A2. 27 ECG abnormalities and their corresponding
abbreviations.
ECG abnormality Abbreviation
1st degree AV block IAVB
Atrial fibrillation AF
Atrial flutter AFL
Bradycardia Brady
Complete right bundle branch block CRBBB
Incomplete right bundle branch block IRBBB
Left anterior fascicular block LAnFB
Left axis deviation LAD
Left bundle branch block LBBB
Low QRS voltages LQRSV
Nonspecific intraventricular conduction disorder NSIVCB
Pacing rhythm PR
Premature atrial contraction PAC
Premature ventricular contractions PVC
Prolonged PR interval LPR
Prolonged QT interval LQT
Q wave abnormal QAb
Right axis deviation RAD
Right bundle branch block RBBB
Sinus arrhythmia SA
Sinus bradycardia SB
Sinus rhythm NSR
Sinus tachycardia STach
Supraventricular premature beats SVPB
T wave abnormal TAb
T wave inversion TInv
Ventricular premature beats VPB
10Physiol. Meas. 42 (2021) 065008 Z Zhu et al
References
Alday E A P et al 2020 Classification of 12-lead ECGs: the PhysioNet/computing in cardiology challenge 2020 Physiol. Meas. 41 124003
Alexakis C, Nyongesa H, Saatchi R, Harris N, Davies C, Emery C, Ireland R and Heller S 2003 Feature extraction and classification of
electrocardiogram (ECG) signals related to hypoglycaemia Computers in Cardiology, 2003 (Piscataway, NJ: IEEE) pp 537–40
Andreotti F, Carr O, Pimentel M A, Mahdi A and De Vos M 2017 Comparing feature-based classifiers and convolutional neural networks to
detect arrhythmia from short segments of ECG 2017 Computing in Cardiology (CinC) (Piscataway, NJ: IEEE) pp 1–4
Artis S G, Mark R and Moody G 1991 Detection of atrial fibrillation using artificial neural networks Proc. Computers in Cardiology pp 173–6
Bickerton M and Pooler A 2019 Misplaced ECG electrodes and the need for continuing training Br. J. Cardiac Nurs. 14 123–32
Billeci L, Chiarugi F, Costi M, Lombardi D and Varanini M 2017 Detection of AF and other rhythms using RR variability and ECG spectral
measures 2017 Computing in Cardiology (CinC) (Piscataway, NJ: IEEE) pp 1–4
Bin G, Shao M, Bin G, Huang J, Zheng D and Wu S 2017 Detection of atrial fibrillation using decision tree ensemble 2017 Computing in
Cardiology (CinC) (Piscataway, NJ: IEEE) pp 1–4
Chen J, Chen T, Xiao B, Bi X, Wang Y, Duan H, Li W, Zhang J and Ma X 2020 SE-ECGNet: multi-scale SE-Net for multi-lead ECG data 2020
Computing in Cardiology (Piscataway, NJ: IEEE) pp 1–4
Chen Y, Wang X, Jung Y, Abedi V, Zand R, Bikak M and Adibuzzaman M 2018 Classification of short single-lead electrocardiograms (ECGs)
for atrial fibrillation detection using piecewise linear spline and xgboost Physiol. Meas. 39 104006
Devlin J, Chang M-W, Lee K and Toutanova K 2018 BERT: pre-training of deep bidirectional transformers for language understanding Proc.
2019 Conf. of the North American Chapter of the Association for Computational Linguistics: Human Language Technologies vol 1
(Minneapolis, MN: Association for Computational Linguistics) pp 4171–86
Elola A, Aramendi E, Irusta U, Picón A, Alonso E, Owens P and Idris A 2019 Deep neural networks for ECG-based pulse detection during
out-of-hospital cardiac arrest Entropy 21 305
Gaziano T A, Bitton A, Anand S, Abrahams-Gessel S and Murphy A 2010 Growing epidemic of coronary heart disease in low- and middle-
income countries Curr. Probl. Cardiol. 35 72–115
Goldberger A L, Goldberger Z D and Shvilkin A 2018 Goldbergers Clinical Electrocardiography: A Simplified Approach (Amsterdam: Elsevier)
He K, Zhang X, Ren S and Sun J 2016 Deep residual learning for image recognition 2016 IEEE Conf. on Computer Vision and Pattern
Recognition (CVPR)
Hong S, Xiao C, Ma T, Li H and Sun J 2019 MINA: multilevel knowledge-guided attention for modeling electrocardiography signals Proc.
28th Int. Joint Conf. on Artificial Intelligence Organization pp 5888–94
Hu J, Shen L and Sun G 2018 Squeeze-and-excitation networks 2018 IEEE/CVF Conf. on Computer Vision and Pattern Recognition
Huang C, Zhao R, Chen W and Li H 2019 Arrhythmia classification with attention-based Res-BiLSTM-Net Machine Learning and Medical
Engineering for Cardiovascular Health and Intravascular Imaging and Computer Assisted Stenting (Berlin: Springer) pp 3–10
Irusta U, Aramendi E, Chicote B, Alonso D, Corcuera C, Veintemillas J, Larrea A and Olabarria M 2019 Deep learning approach for a shock
advise algorithm using short electrocardiogram analysis intervals Resuscitation 142 e85
Jia W, Xu X, Xu X, Sun Y and Liu X 2020 Automatic detection and classification of 12-lead ecgs using a deep neural network 2020 Computing
in Cardiology (Piscataway, NJ: IEEE) pp 1–4
Kingma D P and Ba J 2015 ADAN: a method for stochastic optimization 3rd Int. Conf. on Learning Representations, ICLR 2015 (San Diego,
CA, USA, 7–9, May 2015) ed Y Bengio and Y LeCun
Kligfield P 2002 The centennial of the Einthoven electrocardiogram J. Electrocardiol. 35 123–9
Kligfield P et al 2007 Recommendations for the standardization and interpretation of the electrocardiogram Circulation 115 1306–24
Krasteva V, Ménétré S, Didon J-P and Jekova I 2020 Fully convolutional deep neural networks with optimized hyperparameters for detection
of shockable and non-shockable rhythms Sensors 20 2875
Krizhevsky A, Sutskever I and Hinton G E 2017 Imagenet classification with deep convolutional neural networks Commun. ACM 60 84–90
LeCun Y and Bengio Y 1995 Convolutional networks for images, speech, and time series The Handbook of Brain Theory and Neural Networks
vol 3361 (Cambridge, MA: MIT Press) pp 252–8
Luo C, Jiang H, Li Q and Rao N 2019 Multi-label classification of abnormalities in 12-lead ECG using 1D CNN and LSTM Machine Learning
and Medical Engineering for Cardiovascular Health and Intravascular Imaging and Computer Assisted Stenting (Berlin: Springer) pp 55–63
Mahmoodabadi S, Ahmadian A and Abolhasani M 2005 ECG feature extraction using daubechies wavelets Proc. 5th IASTED Int. Conf. on
Visualization, Imaging and Image Processing pp 343–8
Martínez J P, Almeida R, Olmos S, Rocha A P and Laguna P 2004 A wavelet-based ecg delineator: evaluation on standard databases IEEE
Trans. Biomed. Eng. 51 570–81
Min S, Choi H-S, Han H, Seo M, Kim J-K, Park J, Jung S, Oh I-Y, Lee B and Yoon S 2020 Bag of tricks for electrocardiogram classification
with deep neural networks 2020 Computing in Cardiology (Piscataway, NJ: IEEE) pp 1–4
Minami K-I, Nakajima H and Toyoshima T 1999 Real-time discrimination of ventricular tachyarrhythmia with Fourier-transform neural
network IEEE Trans. Biomed. Eng. 46 179–85
Natarajan A, Chang Y, Mariani S, Rahman A, Boverman G, Vij S and Rubin J 2020 A wide and deep transformer neural network for 12-lead
ECG classification 2020 Computing in Cardiology (Piscataway, NJ: IEEE) pp 1–4
Pan J and Tompkins W J 1985 A real-time QRS detection algorithm IEEE Trans. Biomed. Eng. BME-32 230–6
PhysioNet/Computing in Cardiology Challenge 2020 Evaluation 2020 https://github.com/physionetchallenges/evaluation-2020/blob/
master/evaluate_12ECG_score.py
Sodmann P, Vollmer M, Nath N and Kaderali L 2018 A convolutional neural network for ECG annotation as the basis for classification of
cardiac rhythms Physiol. Meas. 39 104005
Sun X, Chakrabarty K, Huang R, Chen Y, Zhao B, Cao H, Han Y, Liang X and Jiang L 2019 System-level hardware failure prediction using
deep learning 2019 56th ACM/IEEE Design Automation Conf. (DAC) (Piscataway, NJ: IEEE) pp 1–6
TIANCHI—Hefei Hi-tech Cup ECG Intelligent Competition 2020 https://tianchi.aliyun.com/competition/entrance/231754/
introduction
Vafaie M, Ataei M and Koofigar H 2014 Heart diseases prediction based on ECG signals’ classification using a genetic-fuzzy system and
dynamical model of ECG signals Biomed. Signal Process. Control 14 291–6
Vaswani A, Shazeer N, Parmar N, Uszkoreit J, Jones L, Gomez A N, Kaiser L and Polosukhin I 2017 Attention is all you need Advances in
Neural Information Processing Systems vol 30 (Red Hook, NY: Curran Associates)
Wang C, Yang S, Tang X and Li B 2019 A 12-lead ECG arrhythmia classification method based on 1D densely connected CNN Machine
Learning and Medical Engineering for Cardiovascular Health and Intravascular Imaging and Computer Assisted Stenting (Berlin:
Springer) pp 72–9
11Physiol. Meas. 42 (2021) 065008 Z Zhu et al
Warrick P A and Homsi M N 2018 Ensembling convolutional and long short-term memory networks for electrocardiogram arrhythmia
detection Physiol. Meas. 39 114002
Xia Z, Sang Z, Guo Y, Ji W, Han C, Chen Y, Yang S and Meng L 2019 Automatic multi-label classification in 12-lead ECGs using neural
networks and characteristic points Machine Learning and Medical Engineering for Cardiovascular Health and Intravascular Imaging and
Computer Assisted Stenting (Berlin: Springer) pp 80–7
Xiong Z, Nash M P, Cheng E, Fedorov V V, Stiles M K and Zhao J 2018 Ecg signal classification for the detection of cardiac arrhythmias using
a convolutional recurrent neural network Physiol. Meas. 39 094006
Zhao Z, Fang H, Relton S D, Yan R, Liu Y, Li Z, Qin J and Wong D C 2020 Adaptive lead weighted resnet trained with different duration
signals for classifying 12-lead ecgs 2020 Computing in Cardiology (Piscataway, NJ: IEEE) pp 1–4
12You can also read