Continuum Scale Non Newtonian Particle Transport Model for Haemorheology - Implementation and Validation
←
→
Page content transcription
If your browser does not render page correctly, please read the page content below
Continuum Scale Non Newtonian Particle Transport Model for
                                                   Hæmorheology - Implementation and Validation
                                                   Torsten Schenkel · Ian Halliday
arXiv:2004.12380v1 [physics.flu-dyn] 26 Apr 2020

                                                   April 28, 2020

                                                   Abstract We present a continuum scale particle          blood rheology is dominated by the interaction of
                                                   transport model for red blood cells following colli-    cells, with a multitude of models having been pro-
                                                   sion arguments in a diffusive flux formulation. The     posed to account for such meso-scale effects as
                                                   model is implemented in FOAM, in a framework            deformation, aggregation, and rouleaux formation
                                                   for haemodynamics simulations. Modern mecha-            which underline emergent macroscopic flow prop-
                                                   nistic rheology models are implemented and tested.      erties like concentration dependant viscosity and
                                                   The model is verified against a known analytical        shear thinning. The authors are currently devel-
                                                   solution and shows excellent agreement for high         oping a multi-scale approach, explicitly modelling
                                                   quality meshes and good agreement for typical           meso-scale effects using Lattice Boltzmann Models
                                                   meshes as used in vascular flow simulations. Sim-       (LBM), in which erythrocyte mechanics are fully
                                                   ulation results for different size and time scales      resolved, while describing the macro-scale rheol-
                                                   show that migration of red blood cells does oc-         ogy using particle transport modelling and quasi-
                                                   cur on physiologically relevany timescales on small     mechanistic non- Newtonian rheology models. The
                                                   vessels below 1 mm and that the haematocrit con-        latter will eventually be parameterised using LBM
                                                   centration modulates the non-Newtonian viscos-          data. Here, we present the continuum mechanical
                                                   ity. This model forms part of a multi-scale ap-         part of the modelling approach, which allows the
                                                   proach to haemorheology and model parameters            simulation of realistic vessel geometries and com-
                                                   will be derived from meso-scale simulations using       plex flow patterns.
                                                   multi-component Lattice-Boltzmann methods. The
                                                   code, haemoFoam, is made available for interested re-
                                                   searchers.

                                                                                                           2 Methods

                                                   1 Introduction
                                                                                                           2.1 Particle Migration Model
                                                   Blood is a non-Newtonian fluid with very com-
                                                   plex behaviour deriving from a mesoscopic com-          In a high particle load suspension like blood, many
                                                   position which - minimally described - is a dense,      types of mechanical interactions between particles
                                                   mono-disperse suspension of deformable vesicles         and carrier fluid take place. Mesoscale modelling,
                                                   suspended in incompressible plasma. Accordingly,        using the multi-component Lattice-Boltzmann
                                                   E-mail: t.schenkel@shu.ac.uk
                                                                                                           Method 1 , which has widely acknowledged facil-
                                                   Department of Engineering and Mathematics               ity for Lagrangian particulate flows 7,16,17,19,10 is
                                                   Materials and Engineering Research Institute (MERI)     employed to describe these interactions and the
                                                   Sheffield Hallam University                             dynamics of the collision in detail.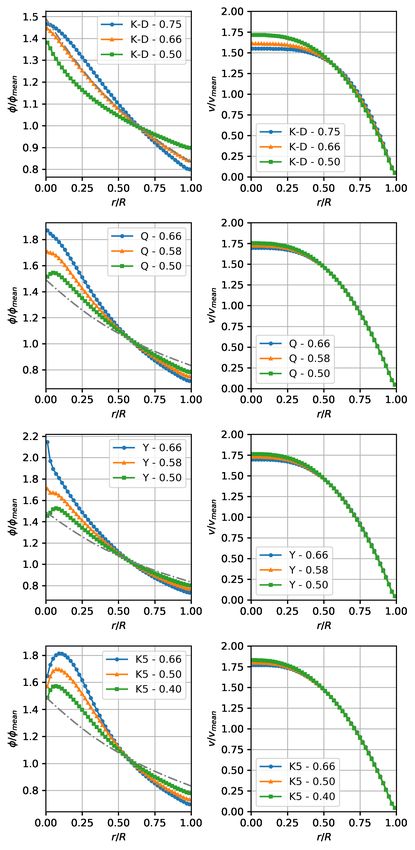
2                                                                                             Torsten Schenkel, Ian Halliday

As with direct numerical simulation in turbulence          2.1.1 Spatial variation of collision frequency
modelling, finite computational resource means
that detailed explicit particulate models are limited
                                                           Particles that are moving relative to each other in
to small volumes containing relatively few particles
                                                           neighboring shear surfaces will experience colli-
in their simulation domain (an the order of magni-
                                                           sions. The frequency of these collisions is propor-
tude of hundreds to thousands at the time of writ-
                                                           tional to the shear rate γ̇, the particle concentra-
ing). To address the much greater scales of medi-
                                                           tion φ, and the particle collision radius a. In a field
cal significance, it is, therefore, necessary to develop
                                                           of constant concentration and constant shear, γ̇φ =
macro- or continuum scale models, encapsulating
                                                           const, the collisions are in equilibrium either side of
the integral effect of these interactions without ex-
                                                           the shear surface, and no net migration will occur.
plicitely resolving them. Crucially, these models
                                                           In the presence of gradients of shear rate or con-
must be amenable to parameterisation using meso-
                                                           centration, the imbalance of collisions will lead to a
scale data, such as 4 . Currently, the models which
                                                           “migration pressure” down the gradient. This coll-
have been proposed for this task can, roughly, be
                                                           sion driven migration pressure can be described as
divided 11 into suspension balance models 18,23 and
                                                           a function of a∇(γ̇φ)). Using a proportinality factor
diffusive flux models 26 .
                                                           of Kc and assuming a displacement proportional to
                                                           the particle radius a, the migratory flux Nc due to
Suspension balance models use an Euler-Euler mix-          variations in collision frequency can be expressed
ture modelling approach, where the carrier fluid           as (using the chain rule):
and the particle load are represented as sepa-
rate species with a transport equation (typically
convection-diffusion) and physical transport prop-
erties for each species, while in the diffusive flux       Nc = −Kc a2 (φ2 ∇γ̇ + φγ̇∇φ)                                 (1)
models, the suspension is modelled as a single
species with the particle volume fraction being
modelled as a scalar property, which influences the        2.1.2 Spatial variation of viscosity
bulk transport properties.

                                                           The displacement of particles after a collision is
Our macroscopic model is a particle transport              moderated by viscous effects. In a constant viscos-
model after Phillips 26 and follows the collision ar-      ity field the displacement is isotropic and thus bal-
guments by Leighton and Acrivios 18 . It describes         anced with no net migration effects. In a viscosity
the particle migration based on the gradients of           gradient, the displacement will be less damped in
shear strain, concentration and viscosity. The local       direction of the lower viscosity, leading to a net mi-
concentration of haematocrit is then used to estab-        gration effect down the viscisity gradient.
lish the local effective viscosity.
                                                           The displacement velocity is proportional to the
                                                           relative change in viscosity over a distance that is
A detailed treatise on the rationale behind the com-       of order a: a(1/µ)∇µ. With the displacement fre-
pression arguments can be found in Leighton and            quency scaling with γ̇φ, and a proportionality fac-
Acrvios, and Phillips 18,26 , we only give a brief out-    tor of Kµ , the migratory flux due to viscosity gradi-
line at this point.                                        ent can be described as (flux is proportional to φ):

The transport of haematocrit is dominated by ad-
                                                                                  a2

vection - following the bulk flow - variations in con-                    2
                                                           Nµ = −Kµ γ̇φ              ∇µ                                 (2)
centration are evened by diffusive processes, and                                 µ
the migration within the bulk is driven by a migra-
tion pressure. This migration pressure is the result
of two phenomena: (1) spatial variation of collision       The scalar transport equation for haematocrit, φ, is
(interaction) frequency, and (2) spatial variation of      then (neglecting molecular diffusion, Brownian mo-
viscosity.                                                 tion), where D/Dt is the total differential: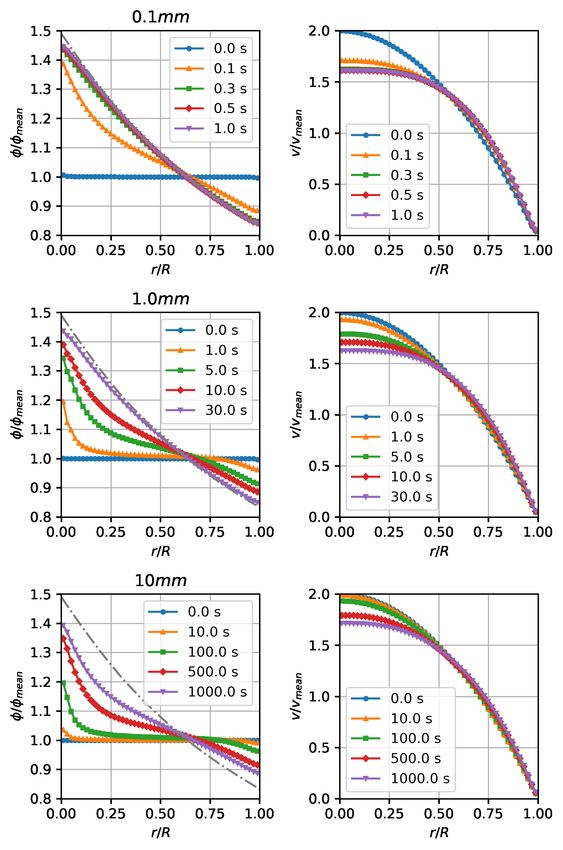
Non Newtonian Particle Transport Model for Hæmorheology                                                        3

                                                          framework, incorporating the transport of haemat-
Dφ                                                       ocrit, allows the rheological model to take the local
   =      ∇ · Nc + Nµ                              (3)    particle concentration into account when calculat-
Dt
                                                          ing the local, effective viscosity.
Dφ
   =     ∇ · a2 Kc φγ̇∇φ                                  The rheology models that have been implemented
Dt                                                      and tested in this study are the concentration de-
       + a2 Kc ∇ · φ2 ∇γ̇
                                                          pendent Krieger-Dougherty model 15 , the Quemada
                                                          model 27,28,29 with modification by Das 9 (and a new

          2            21
       + a Kµ ∇ · γ̇φ ∇µ ,                         (4)
                        µ                                 parameter set, which avoids the singularity prob-
                                                          lem commonly associated with this model), an ex-
with a, particle radius, γ̇, shear strain rate magni-     tended Krieger model, accommodating shear thin-
tude, µ, dynamic viscosity, Kc and Kµ , collision pa-     ning and aggregation effects 12 , a Casson model
rameters.                                                 with haematocrit dependence following Merril et
                                                          al. 21,9 , and a modified Carreau type model, pro-
Typically, the viscosity is µ = f (γ̇, φ), which makes    posed by Yeleswarapu 32 . All model parameters
the last source term non-linear, which can, in turn,      have been fitted to the experimental data of Brooks 3
make the solution of this transport equation diffi-       (Figure 1).
cult.

Previous attempts to solve this problem analytically
or implement this type of migration model in a
                                                          2.2.1 Krieger-Dougherty Model
numerical model used linearisation of this source
term, which involves the derivative of µ in both γ̇
and φ, and thus limits the model to a specific viscos-    The traditional Krieger-Dougherty model 15 was
ity model, for which it has been implemented 20,6 .       developed to describe the rheology of high volume
Our current implementation deals with the non-            ratio suspensions of rigid spherical particles. Rigid,
linear viscosity source term in a way that leaves the     spherical particles do not exhibit shear-thinning be-
viscosity gradient term intact and is thus agnostic       haviour, so the Krieger-Dougherty model is only
to the rheology model used.                               dependent on the haematocrit concentration φ. It
                                                          shows a singularity for φ = φ∗ , where φ∗ is the
                                                          haematocrit concentration for which the suspension
                                                          does stop to behave like a fluid. For rigid spheres
2.2 Rheology Models                                       φ∗ = 0.68 15 , while for blood it can go up to φ∗ =
                                                          0.98, which is ususally attributed to the deformabil-
It is obvious from the third RHS term in equation 4,      ity of the erythrocytes 12 .
that the particle transport strongly depends on the
rheology model it is coupled with. This model im-
plementation aims to be independent of the rheol-                            −n
ogy model. The draw-back of this approach is that                         φ
                                                          µ = µP       1− ∗         .                         (5)
errors present in the rheology model, which influ-                       φ
ence the particle transport, cannot be calibrated out
with the parameters of the migration model alone,
but the combined set of model parameters will need        The parameter n = kφ∗ is often set to n = 2, but
to be found for any new rheology model that is to         more commonly to the high shear limit of n = 1.82
be implemented.                                           for φ∗ = 0.68 28,24 , which is also the value used in
                                                          this work to allow comparison with the results from
Typically, only the shear thinning effects are taken      Phillips and others 26,20,6 . µ P is the Newtonian vis-
into account, when modelling the non-Newtonian            cosity of the liquid phase (plasma).
properties of blood in CFD. Common models are of
the Carreau and Casson types (REF). In these mod-         In this study the Krieger-Dougherty model is not
els, the haematocrit concentration is only used as a      used as for modelling blood viscosity but as a refer-
bulk parameter in the parametrisation, if at all. Our     ence model for verification and validation.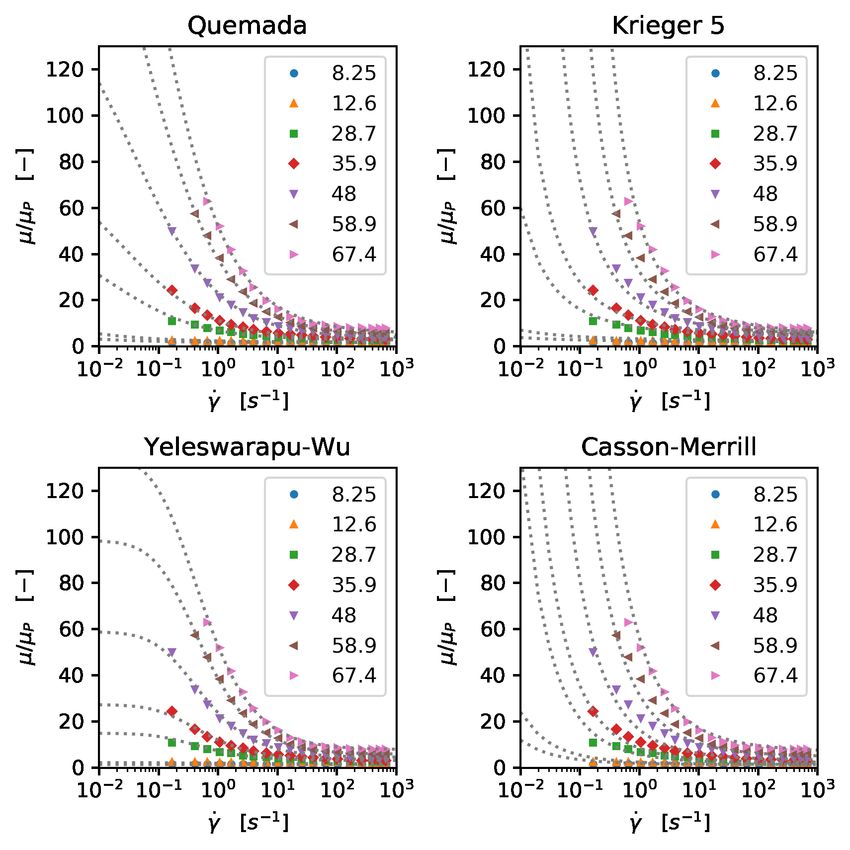
4                                                                                             Torsten Schenkel, Ian Halliday

2.2.2 Quemada Model                                         which results in a monotonous behaviour for low
                                                            shear (the lowest shear measured in the Brooks
                                                            dataset is around γ̇ = 0.15 s−1 ), but still shows a
The Quemada model is based on “optimisation of
                                                            singularity for φ = 80.4%. While this is outside the
viscous dissipation” 27 . In its original form it is for-
                                                            haematocrit values typically encountered in clinical
mulated as a Newtonian, concentration dependent
                                                            practice, it can still pose a problem if cell migration
viscosity:
                                                            is taken into account, which will concentrate cells in
                                                            the core region. In order to overcome this problem,
                                                            a new parameter set, based on Das’s formulation, is
µ = µ P (1 − kφ)−2 ,                                  (6)   derived in this work, which does not show a singu-
                                                            larity. Figure 2 shows viscosity over shear rate for
with k being related to the packing concentration           low shear rate (γ̇ = 0.15 s−1 ) and zero shear rate.
and (for the high shear limit) given as: k = 2/φ∗ .         While all the curves show a good fit with the data,
In this form it is closely related to the Krieger-          the new parameter set does show monotonous be-
Dougherty model (eq. 5).                                    haviour throughout and no singularity below the
                                                            critical haematocrit.
In its non-Newtonian form k is expressed as 28,29 :
                                                            2.2.3 Modified 5 parameter Krieger Model
                p
     k0 + k ∞ γ̇/γ̇c
k=         p         ,                                (7)   Hund et al. 12 proposed and developed a quasi-
       1 + γ̇/γ̇c                                           mechanistic extension to the Krieger-Dougherty
                                                            model.
where k0 and k ∞ are the intrinsic viscosities at zero
                                                            Starting from the traditional formulation of the
and infinite shear, respectively, and γ̇c is a critical
                                                            Krieger-Dougherty model:
shear rate.
The shear rate magnitude γ̇ is defined as
                                                                       φ −n

                                                            µ = µP 1 − ∗    ,                                          (13)
                                                                      φ
        √
γ̇ :=       2D : D,                                   (8)   describing the haematocrit dependence, the shear-
                                                            thinning behaviour is introduced by a variable ex-
with D, the symmetric part of the velocity gradient         ponent n:
tensor.
                                                                        (
Different parameter fits have been proposed for                             0, φ < φst
                                                            n = n∞ +                                                   (14)
k0 , k ∞ , γ̇c . Cokelet 8,21 proposed:                                     nst , φ > φst ,

                                                            where φst is the threshold haematocrit concentra-
k0 = exp( a0 + a1 φ + a2 φ2 + a3 φ3 )                 (9)   tion below which no shear-thinning is observed.
k ∞ = exp(b0 + b1 φ + b2 φ2 + b3 φ3 )               (10)    Based on Brooks 3 , this threshold is around φ = 0.15,
                           2       3                        and n∞ is modelled using a exponential depen-
γ̇c = exp(c0 + c1 φ + c2 φ + c3 φ ).                (11)
                                                            dency on φ:

Das 9 noted that Cokelet’s parameter set causes the
viscosity to be non-monotonous over haematocrit             n∞ = a + b exp(−c φ).                                      (15)
concentration for low shear, and exhibits singular-
ities for zero shear. Das changed the parameter fit         Hund’s 12 shear-thinning exponent nst comprises
for k0 to                                                   contributions of red blood cell aggregation and de-
                                                            formability:

                  2
k 0 = a0 +            ,                             (12)    nst = n agg + nde f ,                                      (16)
               a1 + φ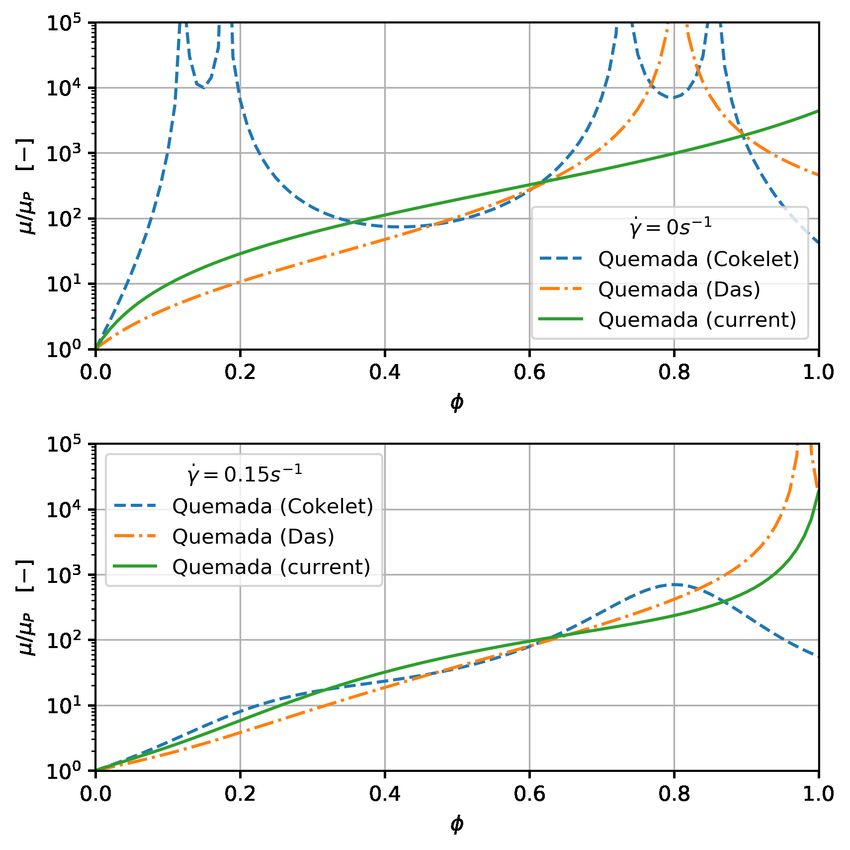
Non Newtonian Particle Transport Model for Hæmorheology                                                           5

where each component is described by a power law:
                                                            µ0 = a1 φ + a2 φ2 + a3 φ3                          (21)
                                    −νagg/de f                                  2                 3
                         0
n agg/de f = β agg/de f γagg/de                  ,   (17)   µ∞ = b1 φ + b2 φ + b3 φ                            (22)
                                f

with the empirical coefficient β and ν, and the non-        2.2.5 Casson-Merrill Model
dimensional shear rate γ0 = 1 + (λγ̇)νg , as defined
by Carreau and Yasuda 30 , with a time constant λ,
and νg = 2. This formulation ensures finite nst at          The Casson model 5 is a classical non-Newtonian
zero shear.                                                 model in which the viscosity is modelled as:

In the 5-component form the aggregation and de-
formation influences on the shear-thinning expo-                                         2
                                                                     √
                                                                               r
                                                                                    τ0
nent are combined into a single power law, due to           µ=           µ∞ +                 ,                (23)
                                                                                    γ̇
the limited data on these effects:
                                                            where µ∞ is the Casson viscosity (asymptote at high
                                                            shear rate) and τ0 is the yield stress. The yield ef-
nst = βγ0−ν .                                        (18)   fect means that this model has a singularity at zero
                                                            shear, leading to infinite viscosity. While there is an
The model proposed by Hund et al. allows for                argument that blood does exhibit yield at slow time
inclusion of the influence of large molecule con-           scales and low shear, this effect will typically make
centration (proteins polysacharides, lipids), as well       this type of model unsuited for numerical simula-
as fibrinogen, and temperature on the constitutive          tion within a generalised Newtonian approach with
model. Due to a lack of data these are not included         a local effective viscosity due to numerical instabil-
in the 5-parameter model.                                   ity.
                                                            For blood, Merill et al. gave the expressions for µ∞
2.2.4 Yeleswarapu-Wu Model                                  and τ0 as 21,9

This model is based on a visco-elastic Oldroyd-
                                                                        µ pl
B model developed by Yeleswarapu et al. 32,31 . In          µ∞ =                                               (24)
this study the visco-elastic effects are neglected,                  (1 − φ ) α
                                                                      "                #2
only the shear-thinning behaviour and haematocrit                            1
                                                                                 α/2
                                                                    2
dependency are implemented. The shear-thinning               τ0 = β                   −1 ,                     (25)
                                                                         1−φ
behaviour follows a modified Carraeu-type model
based on a mixture model by Jung et. al 14 .
                                                            with the fitting parameters α and β.
The model is based on a mixture model and thus
the viscosity is decribed as a function of plasma vis-
                                                            2.2.6 Characteristics of Rheology Models
cosity µ P and red blood cell viscosity µrbc 31 :

                                                            All viscosity model parameters were fitted to ex-
µmix = (1 − φ)µ P + φµrbc ,                          (19)   perimental data for varying levels of haematocrit
                                                            in ADC plasma reported by Brooks 3 . While this
where the red blood cell viscosity is described as:         data is for steady state shear only, it is still consid-
                                                            ered on of the best datasets for blood rheology data
                                                            and is used in the majority of work on blood rheol-
                                1 + ln(1 + kγ̇))            ogy. The parameters were fitted using a Levenberg-
µ∞ (φ) + (µ0 (φ) − µ∞ (φ))                       ,   (20)
                                     1 + kγ̇                Marquardt least squares fit, implemented in Scien-
                                                            tific Python (scipy), using the MINPACK library.
where, in this implementation, k is a constant              Table 1 shows the parameter sets for the different
model parameter, and µ0 and µ∞ are modelled as              models, figure 1 shows the comparison of model
third order polynomials of φ:                               results and experimental data. All models show a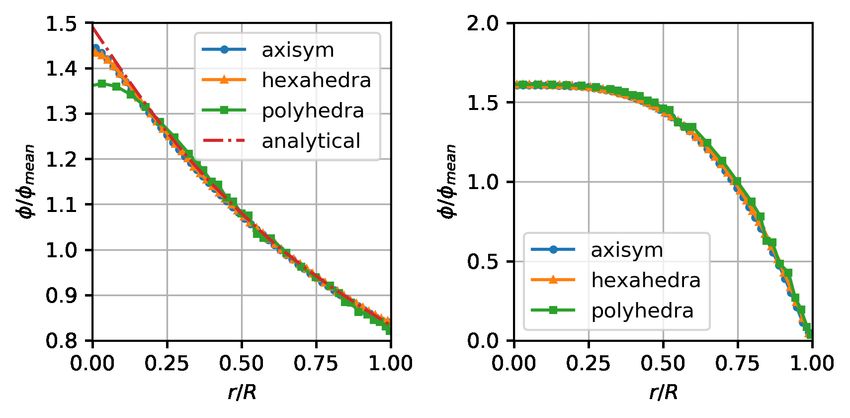
6                                                                                      Torsten Schenkel, Ian Halliday

Fig. 1: Comparison of non-Newtonian rheology             Fig. 2: Comparison of Quemada parameterisation
models. All model parameters have been fitted to         for zero and low (0.15s−1 ) shear rate. The clas-
Brooks’ data. Dots: experimental data (Brooks), dot-     sic Cokelet parameter set shows singularities at
ted lines: model equations                               12.2%, 18%, 73.1%, 85.6%, the modified parame-
                                                         terisation by Das improves on this, but still shows
                                                         a singularity for 80.4% haematocrit. The current
good fit to the experimental data in the range were      parameter set removes the singularity and shows
experimental data is available (γ̇ > 0.15 s−1 ), while   monotonous behaviour.
the behaviour for low shear stress varies between
the models. The Casson model shows a singular-
                                                         Quemada         MKM5        Yeleswarapu    Casson
ity for zero shear (yield stress behaviour), while the
                                                         -               -           -              -
other models all have finite viscosity for zero shear.
                                                         a0: 0.06108     -           a1: -0.02779   -
However, the values at low shear vary widely. For        a1: 0.04777     -           a2: 1.012      -
γ̇ = 10−2 s−1 , the range of relative viscosity is be-   -               -           a3: -0.636     -
tween µ/µ P = 71.4 to 936. This variation will heav-     b0: 1.803       b: 8.781    b1: 0.0749     α: 1.694
                                                         b1: -3.68       c: 2.824    b2: -0.1911    β: 0.01197
ily influence the behaviour at low shear rate, e.g. on
                                                         b2: 2.608       β: 16.44    b3: 0.1624     -
the axis of the flow.                                    b3: -0.001667   λ: 1296     -              -
                                                         -               -           k: 8.001       -
Figure 2 shows the parameter fit for the Quemada         c0: -7.021      ν: 0.1427   -              -
model, where the classical Cokelet fit 8 exhibits sin-   c1: 34.45       -           -              -
gularities at 12.2%, 18%, 73.1%, and 85.6% for zero      c2: -39.94      -           -              -
shear. The Das variation 9 improves on this, but the     c3: 14.09       -           -              -
original parameter set by Das still shows a singu-
larity for 80.4% haematocrit. The new parameter fit      Table 1: Viscosity model parameters. Levenberg-
performed in this study removes the singularities        Marquardt least squares fit (scipy, MINPACK), to
completely and shows monotonous behaviour for            Brooks’s data (all viscosities calculated in Pa s),
the whole range of haematocrit concentrations and        µ P = 1.23 · 10−3 Pa s.
shear rates.
                                                         which allows easy implementation of Finite Volume
                                                         Method (FVM) solvers.
2.3 Implementation
                                                         The fundamental equations for mass and mo-
                                                         mentum conservation were implemented using
The model was implemented using the Field Oper-          the SIMPLE (Semi-Implicit Method for Pressure-
ation And Manipulation (FOAM) framework (REF).           Linked Equations) 25 method for steady state, and
FOAM, or OpenFOAM, is an open source library             the PISO (Pressure-Implicit with Splitting of Opera-
Non Newtonian Particle Transport Model for Hæmorheology 7
tors) 13 and PIMPLE (combining PISO and SIMPLE)
methods for transient simulations.
Discretision is typically second order in space and
time. The code supports all discretisation methods
that are supported in the FOAM library (currently
foam-extend 4.0 and OpenFOAM 1912).
The haematocrit transport equation 4 is imple-
mented as a scalar transport equation, solved out-
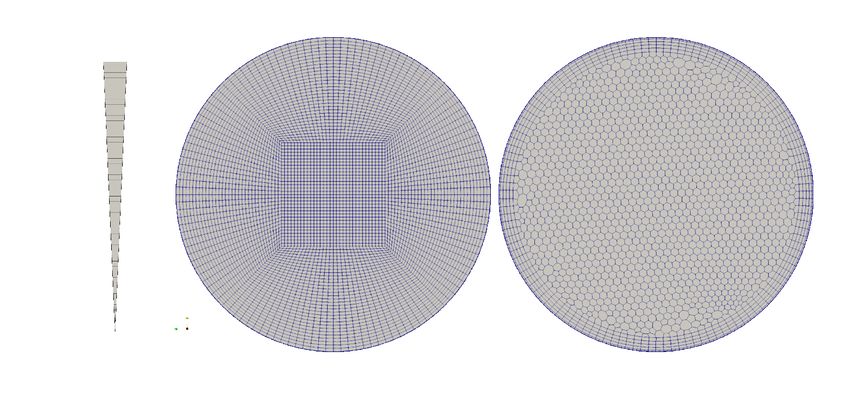
Fig. 3: Mesh topology for the verification of the
side of the SIMPLE loop. The Laplacians in φ are
model: axisymmetric wedge, 50 cells radial; hexa-
implemented implicitely (fvm) as diffusion terms,
hedral, block-structured, 50 cells radial; polyhedral
while the source terms in γ̇ and µ are calculated ex-
with boundary layer extrusion, 60 cells diameter.
plicitely (fvc).
For steady state (SIMPLE) and transient cases with
the PIMPLE algorithm, underrelaxation is required, tween 50µm and 5mm, to represent typical vessel
typically the underrelaxation factor that is required diameters. The pipe length is two diameters.
can be estimated from the order of magnitude of
the ratio between collision radius. Stable simula-
tion has been achieved for relaxation factors of 3.1 Verification and influence of mesh type
0.1 log(O( a/R)), e.g. a radius R = 50 µm and col-
lision radius of 3.5 µm will require an underrelax-
ation factor of ≈ 0.1 with no underrelaxation for The verification case for the implementation is
the final iteration. The PISO algorithm does not a pipe of radius 50 µm, average velocity V =
use underrelaxation and requires a time step to be 0.0065 m s−1 . The rheology model used in the verifi-
estimated from the Courant number (Co < 1) for cation case is the Krieger-Dougherty model to allow
O( a/R) > 1, and a smaller time step calculated comparison to the analytical solution 26 (no analyt-
based on a Courant number scaled with the migra- ical solution available for the non-linear terms in
tion velocity. the shear-stress and concentration dependent mod-
els). Model parameters for the Krieger-Dougherty
The discretisation schemes used in the calculations model are Kc = 0.41, Kµ = 0.62, φ∗ = 0.68, and n =
presented in this paper are: second order Euler back- 1.82.
ward in time and second order (Gauss linear, and
Gauss linear upwind for advective terms) in space, The simulation was performed for different meshes,
gradients are approximated using the least squares Figure 3, (a) an axisymmetric (2D) wedge with 50
theme. cells resolution in radial direction, (b) a hexahedral,
block structured mesh - 50 cells radial, and (c) a
Rheology models are implemented as quasi- poyhedral mesh with boundary layer inflation with
Newtonian, with calculation of local cell viscos- ~60 cells across the diameter - this type of mesh
ity based on the shear rate and haematocrit value is common in the simulation of vascular flow in
in the cell from the previous iteration/time step. patient specific geometries. The given resolutions
The new rheology models that are implemented were chosen based on a mesh convergence study
at the time of writing are the standard Krieger- and realistic mesh resolutions as typically used in
Dougherty, the modified 5-parameter Krieger, the vascular simulations. The migration model requires
Yeleswarapu-Wu, and the Quemada model. a mesh that is of similar resolution as meshes that
aim at resolving wall shear stress (WSS) and WSS
derived metrics.
3 Results
Figure 4 shows the results for the different meshes
in comparison to the analytical solution of the mi-
All results shown in this paper are for fully de- gration model with the Krieger-Dougherty model.
veloped pipe flow, with periodic boundary condi- The axisymmetric two-dimensional and the hex-
tions between outlet and inlet, with prescribed av- ahedral three-dimensional meshes show excellent
erage velocity. The radius of the pipe varies be- agreement, with only a slight rounding of the8 Torsten Schenkel, Ian Halliday
Fig. 4: Steady state particle distribution and ve- Fig. 5: Steady state particle distribution and ve-
locity profiles for different mesh types, compared locity profiles for different diameters. Parameters:
with analytical solution for particle distribution by fully developed pipe flow, R = 0.05, 0.5, 5 mm,
Krieger et al. Parameters: fully developed pipe flow, V = 0.0065, 0.065, 0.65 m s−1 , Kc = 0.41, Kµ = 0.62,
R = 50 µm, V = 0.0065 m s−1 , Kc = 0.41, Kµ = 0.62, n = 1.82, φ∗ = 0.68, Standard Krieger-Dougherty
n = 1.82, φ∗ = 0.68, Standard Krieger-Dougherty Model.
Model.
three decades of shear strain magnitude for shear-
peaked analytical solution at the axis. The poly- thinning non-Newtonian blood models.
hedral three-dimensional mesh also shows good
agreement, but the additional numerical diffusion The steady state particle distribution profile is inde-
blunts the profile at the axis, the concentration close pendent of the length scale and the diameter ratio.
to the wall is well represented. It will only depend on the ratio of Kc /Kµ . Figure
5 shows steady state profiles for a range of diam-
eters from 0.1 − 10 mm. The computational effort
for the particle migration model, however, scales
3.2 Length and time scale dependency with R2 /a2 , with R, the vessel radius, and a, the
particle collision radius. While the small diameter
3.2.1 Wall shear strain scaling D = 0.1 mm case is fully converged after around
104 iterations, the D = 10 mm case requires 106 iter-
ations. This corresponds to the diffusion timescales.
The parabolic velocity profile for a Newtonian flow
is given as:
3.2.2 Kinematic and particle migration timescales
r2
v = −2 V −1 , (26)
R2 Blood flow with particle migration is governed by
several different time scales for flow kinematics and
where V is the average velocity. particle migration. The timescale for the develop-
ment of the velocity profile (kinematic timescale) is
Therefore, the velocity gradient in radial direction
is:
R2
∂v 4 Vr τk = . (28)
=− 2 . (27) ν
∂r R
So the gradient at the wall (r = R) scales with V The timescales for the development of the particle
and R−1 . The velocity is, therefore, scaled with migration profile can be derived from the particle
R, such that the wall velocity gradient is con- migration flux diffusion terms as:
stant. The Reynolds number scales with R2 . For
the given values of R = 0.05, 0.5, 5 mm, V =
0.0065, 0.065, 0.65 m s−1 , the wall velocity gradient R2
is constant at γ̇w ≈ 650 s−1 , to cover the significant τcφ = , (29)
Kc a2 φγ̇Non Newtonian Particle Transport Model for Hæmorheology 9
R2
τcγ̇ = , (30)
K c a2 φ2
R2
τµ = ∂(ln µ)
. (31)
Kµ a2 γ̇ ∂φ
The kinematic timescale scales with R2 /ν, while the
particle migration timescales scale with the square
diameter ratio R2 /a2 , where R is the pipe radius,
and a is the particle (collision) radius.
The kinematic viscosity, ν ≈ 3 · 10−6 m2 s−1 , while
for an average collision radius of red blood cells of
a = 3.5 µm, the particle migration diffusion coeffi-
cients are of the order of 10−9 − 10−11 m2 s−1 . This
means the particle migration happens on timescales
that are three orders of magnitude greater than the
kinematic timescales.
Figure 6 shows the temporal development of the
particle distribution and non-Newtonian velocity
profile. The flows were initialised with a fully de-
veloped parabolic velocity profile and a uniform
particle distribution of φ = 0.45 volume fraction. Fig. 6: Transient particle distribution and velocity
The 0.1 mm case has reached steady state conditions profiles for different diameters. Parameters: fully
within 0.5 s, the 1.0 mm case shows significant par- developed pipe flow, R = 0.1, 1.0, 10 mm, V =
ticle migration after physiologically relevant times, 0.0065, 0.065, 0.65 m s−1 , Kc = 0.41, Kµ = 0.62, n =
while the 10 mm case does show only minimal mi- 1.82, φ∗ = 0.68, Standard Krieger-Dougherty Model.
gration after 10 s. It can be seen that temporal scal-
ing follows the predicted R2 /a2 scaling factor.
(Y), modified 5-parameter Krieger model (K5), and
varying K-ratios Kc /Kµ = 0.4 to 0.75.
3.3 Variation of rheology model and collision Compared to the verification K-D case with K-ratio
parameter ratio of 0.66, it can be seen that a shift in the balance to
higher influence of the collision frequency (higher
As is obvious from equation 4, the particle migra- K-ratio) steepens the profile, while a lower K-ratio,
tion is strongly dependent on the viscosity model i.e. a shift of the balance to the resistive influence of
and the balance between collision and viscosity the viscosity increase in the low shear region causes
driven migration, as expressed in the model param- a flatter profile.
eters Kc and Kµ .
Comparing the different viscosity models clearly
While the magnitude of Kc and Kµ controls the shows the main difference in the core region, where
magnitude of the migration pressures and thus the the strong variation in the low shear behaviour,
temporal response of the system, the concentration discussed earlier, leads to a strong variation in
profile only depends on the balance between colli- the relative viscosity gradient (last term in equa-
sion and viscosity driven fluxes. This balance is ex- tion{eq:phiTransport}). It is obvious that there is a
pressed by the ratio between the parameters Kc /Kµ . need for further study and comparison with exper-
Figure 7 shows the haematocrit profiles as they imental or meso-scale modelling data to find real-
develop for different viscosity models - Krieger- istic parameters for each of the potential viscosity
Dougherty (K-D), Quemada (Q), Yeleswarapu-Wu models. Especially the modified Krieger model (K5)10 Torsten Schenkel, Ian Halliday
4 Discussion
While previous implementations 20,6 of this class of
model are limited by the fact that the viscosity term
in equation 4 is linearised in the viscosity gradient
with H, our implementation avoids this by imple-
menting the non-linear term directly which allows
to use different viscosity models. Our implemen-
tation also avoids the use of artificial stabilisation
terms that lead to underestimation of RBC migra-
tion 2 .
The particle migration time scales with ( a/R)2 ,
where a is the RBC collision radius. This means
that the particle migration is most relevant for small
vessels of a diameter of 1 mm or lower, where
the migration occurs on physiologically relevant
timescales. For larger vessels, minor effects caused
by a synergy of particle migration and secondary
flows 2 .
The parameters for the migration model would
need to be calibrated to experimental data. While
such data is available, albeit scarce, for rigid par-
ticles in suspension, e.g. based on nuclear mag-
netic resonance measurements of particle profiles,
the authors are not aware of any such data for soft
vesicles, in particular RBCs. We therefore hope to
use meso-scale models (MCLBM) modeling the cell
scale interactions to derive integral diffusion and
particle migration measures that can be used to fit
Fig. 7: Steady state particle distribution and velocity the continuum model parameters.
profiles for different viscosity models and collision
parameter ratios (Kc /Kµ ). Parameters: fully devel-
oped pipe flow, R = 0.05 mm, V = 0.0065 m s−1 , It has to be noted that the implementation uses the
Kc /Kµ = 0.4 − 0.75. Standard Krieger-Dougherty, magnitude of the shear in the particle flux formu-
Quemada, Yeleswarapu, and modified 5-parameter lation. As noted by Phillips 26 this assumes an es-
Krieger model. sentially one-dimensional shear state, and isotropic
response. This limits the application of the model
to flow situations where the shear tensor is aligned
with the flow and the main shear in radial di-
shows a, most likely unrealistic, double-bump pro- rection. As with isotropic turbulence modelling
file at the axis. the isotropic migration model will overpredict mi-
gration pressure in regions with high anisotropy,
e.g. stagnation points, strong acceleration, or rota-
Based on these preliminary results, the Quemada tional shear. It is planned to implement an explicit
model with a K-ratio of between 0.5 and 0.6 seems formulation for a localised, anisotropic shear and
to be the most promising candidate for a semi- migration pressure tensor, similar to approaches
mechanistic rheology model for blood. proposed by Miller 22 or Fang et al. 11 .Non Newtonian Particle Transport Model for Hæmorheology 11
5 Software _eprint: https://doi.org/10.1146/annurev-
fluid-121108-145519.
2. Biasetti, J., P. G. Spazzini, U. Hedin, and T. C.
The continuum-scale haemorheology framework
Gasser. Synergy between shear-induced mi-
was implemented in foam-extend, version 4.0/4.1,
gration and secondary flows on red blood cells
and OpenFoam, version 1912. The software
transport in arteries: Considerations on oxygen
(haemoFoam) is freely available to interested parties
transport. Journal of the Royal Society, Interface
on github (TS-CUBED/haemoFoam). Please contact
11:20140403, 2014.
the author for testing and developer access.
3. Brooks, D. E., J. W. Goodwin, and G. V. Sea-
haemoFoam is a modelling framework for vascular man. Interactions among erythrocytes under
flow simulation based on FOAM, that is intended shear. Journal of Applied Physiology 28:172–
to cater for the particular requirements of haemo- 177, 1970.
dynamics, in particular with respect to WSS related 4. Burgin, K. Development of Explicit and Con-
phenomena like atherosclerosis. At the time of writ- stitutive Lattice-Boltzmann Models for Food
ing it includes: Product Rheology. Doctoral Thesis, Sheffield
Hallam University, Sheffield, 2018.
– Haematocrit transport model, modelling the
5. Casson, M. A flow equation for pigment-oil
shear driven transport of red blood cells in di-
suspensions of the printing ink type. Rheology
rection of the shear gradient
of Disperse Systems pp. 84–104, 1959.
– Blood specific non-Newtonian rheology models
6. Chebbi, R. Dynamics of blood flow: Model-
including haematocrit dependency and shear
ing of Fåhraeus and Fåhraeus–Lindqvist effects
thinning behaviour
using a shear-induced red blood cell migration
– Krieger Dougherty (non shear-thinning)
model. Journal of Biological Physics 44:591–603,
– Modified K-D 12 (shear-thinning)
2018.
– Quemada
7. Clausen, J. R., D. A. Reasor, and C. K.
– Yeleswarapu
Aidun. Parallel performance of a lattice-
– Casson-Merrill
Boltzmann/finite element cellular blood flow
– Carreau model (not concentration depen-
solver on the IBM Blue Gene/P architecture.
dent, Fluent implementation)
Computer Physics Communications 181:1013–
– post-processing for WSS and established WSS
1020, 2010.
derived parameters:
8. Cokelet, G. R., E. W. Merrill, E. R. Gilliland,
– TAWSS, TAWSSMag
H. Shin, A. Britten, and R. E. Wells. The Rheol-
– OSI
ogy of Human Blood—Measurement Near and
– transverse WSS
at Zero Shear Rate. Transactions of the Society
– Relative Residence Time
of Rheology 7:303–317, 1963.
– temporal and spatial WSS gradients
9. Das, B., P. C. Johnson, and A. S. Popel. Ef-
Planned future features are: fect of nonaxisymmetric hematocrit distribu-
tion on non-Newtonian blood flow in small
– Windkessel boundary conditions for outlets
tubes. Biorheology 35:69–87, 1998.
– viscoelastic rheology models (e.g. Oldroyd B)
10. Dupin, M. M., I. Halliday, C. M. Care, L. Alboul,
– platelet transport
and L. L. Munn. Modeling the flow of dense
– low density lipoprotein (LDL) transport
suspensions of deformable particles in three di-
– fluid-structure-interaction (FSI) for flexible ves-
mensions. Physical Review. E, Statistical, Non-
sel walls
linear, and Soft Matter Physics 75:066707, 2007.
11. Fang, Z., A. A. Mammoli, J. F. Brady, M. S. In-
gber, L. A. Mondy, and A. L. Graham. Flow-
aligned tensor models for suspension flows. In-
References ternational Journal of Multiphase Flow 28:137–
166, 2002.
1. Aidun, C. K. and J. R. Clausen. Lattice- 12. Hund, S., M. Kameneva, and J. Antaki. A
Boltzmann Method for Complex Flows. Annual Quasi-Mechanistic Mathematical Representa-
Review of Fluid Mechanics 42:439–472, 2010. tion for Blood Viscosity. Fluids 2:10, 2017.12 Torsten Schenkel, Ian Halliday
13. Issa, R. I., A. D. Gosman, and A. P. Watkins. 26. Phillips, R. J., R. C. Armstrong, R. A. Brown,
The computation of compressible and incom- A. L. Graham, and J. R. Abbott. A constitu-
pressible recirculating flows by a non-iterative tive equation for concentrated suspensions that
implicit scheme. Journal of Computational accounts for shear-induced particle migration.
Physics 62:66–82, 1986. Physics of Fluids A: Fluid Dynamics 4:30–40,
14. Jung, J. and A. Hassanein. Three-phase CFD an- 1992.
alytical modeling of blood flow. Medical Engi- 27. Quemada, D. Rheology of concentrated dis-
neering & Physics 30:91–103, 2008. perse systems and minimum energy dissipa-
15. Krieger, I. M. and T. J. Dougherty. A Mecha- tion principle - I. Viscosity-concentration rela-
nism for Non-Newtonian Flow in Suspensions tionship. Rheologica Acta 16:82–94, 1977.
of Rigid Spheres. Transactions of the Society of 28. Quemada, D. Rheology of concentrated dis-
Rheology 3:137–152, 1959. perse systems II. A model for non-newtonian
16. Ladd, A. J. C. Numerical simulations of partic- shear viscosity in steady flows. Rheologica Acta
ulate suspensions via a discretized Boltzmann 17:632–642, 1978.
equation. Part 1. Theoretical foundation. Jour- 29. Quemada, D. Rheology of concentrated dis-
nal of Fluid Mechanics 271:285–309, 1994. perse systems III. General features of the pro-
17. Ladd, A. J. C. Numerical simulations of partic- posed non-newtonian model. Comparison with
ulate suspensions via a discretized Boltzmann experimental data. Rheologica Acta 17:643–653,
equation. Part 2. Numerical results. Journal of 1978.
Fluid Mechanics 271:311–339, 1994. 30. Sequeira, A. and J. Janela. An Overview of
18. Leighton, D. and A. Acrivos. The shear-induced Some Mathematical Models of Blood Rheol-
migration of particles in concentrated suspen- ogy. In: A Portrait of State-of-the-Art Research
sions. Journal of Fluid Mechanics 181:415–439, at the Technical University of Lisbon, pp. 65–
1987. 87, Springer Netherlands2007, m. seabra pereira
19. MacMeccan, R. M. I. I. I. Mechanistic Effects edition.
of Erythrocytes on Platelet Deposition in Coro- 31. Wu, W.-T., F. Yang, J. F. Antaki, N. Aubry, and
nary Thrombosis. Ph.D. thesis, Georgia Insti- M. Massoudi. Study of blood flow in several
tute of Technology, 2007. benchmark micro-channels using a two-fluid
20. Mansour, M. H., N. W. Bressloff, and C. P. Shear- approach. International Journal of Engineering
man. Red blood cell migration in microvessels. Science 95:49–59, 2015.
Biorheology 47:73–93, 2010. 32. Yeleswarapu, K. K., M. V. Kameneva, K. R. Ra-
21. Merrill, E. W., E. R. Gilliland, G. Cokelet, jagopal, and J. F. Antaki. The flow of blood in
H. Shin, A. Britten, and R. E. Wells. Rheology tubes: Theory and experiment. Mechanics Re-
of Human Blood, near and at Zero Flow: Effects search Communications 25:257–262, 1998.
of Temperature and Hematocrit Level. Biophys-
ical Journal 3:199–213, 1963.
22. Miller, R. M., J. P. Singh, and J. F. Morris.
Suspension flow modeling for general geome-
tries. Chemical Engineering Science 64:4597–
4610, 2009.
23. Nott, P. R. and J. F. Brady. Pressure-driven flow
of suspensions: Simulation and theory. Journal
of Fluid Mechanics 275:157–199, 1994.
24. Papir, Y. S. and I. M. Krieger. Rheological stud-
ies on dispersions of uniform colloidal spheres:
II. Dispersions in nonaqueous media. Journal of
Colloid and Interface Science 34:126–130, 1970.
25. Patankar, S. V. and D. B. Spalding. A calcula-
tion procedure for heat, mass and momentum
transfer in three-dimensional parabolic flows.
International Journal of Heat and Mass Trans-
fer 15:1787–1806, 1972.You can also read