Development and external validation of a COVID-19 mortality risk prediction algorithm: a multicentre retrospective cohort study - BMJ Open
←
→
Page content transcription
If your browser does not render page correctly, please read the page content below
Open access Original research
BMJ Open: first published as 10.1136/bmjopen-2020-044028 on 24 December 2020. Downloaded from http://bmjopen.bmj.com/ on March 17, 2021 by guest. Protected by copyright.
Development and external validation of
a COVID-19 mortality risk prediction
algorithm: a multicentre retrospective
cohort study
Jin Mei,1 Weihua Hu,2 Qijian Chen,3 Chang Li,4 Zaishu Chen,5 Yanjie Fan,6
Shuwei Tian,6 Zhuheng Zhang,6 Bin Li,6 Qifa Ye,7 Jiang Yue ,6,8 Qiao-Li Wang9
To cite: Mei J, Hu W, ABSTRACT
Chen Q, et al. Development Strengths and limitations of this study
Objective This study aimed to develop and externally
and external validation of validate a COVID-19 mortality risk prediction algorithm.
a COVID-19 mortality risk ►► We involved all patients with COVID-19 in the de-
Design Retrospective cohort study.
prediction algorithm: a fined hospitals during the study period and followed
Setting Five designated tertiary hospitals for COVID-19 in
multicentre retrospective them up for the coming 60 days at hospitals, which
cohort study. BMJ Open Hubei province, China.
reduced the chance of selection or detection bias.
2020;10:e044028. doi:10.1136/ Participants We routinely collected medical data of
An independent population was used to externally
bmjopen-2020-044028 1364 confirmed adult patients with COVID-19 between 8
validate the prediction model.
January and 19 March 2020. Among them, 1088 patients
►► Prepublication history and ►► A cross- validation strategy was used to assess
from two designated hospitals in Wuhan were used to
additional material for this model performance. Discrimination and calibration
develop the prognostic model, and 276 patients from three
paper are available online. To evaluation of the derivation and external validation
view these files, please visit hospitals outside Wuhan were used for external validation.
cohort indicated a good performance of the model.
the journal online (http://dx.doi. All patients were followed up for a maximal of 60 days
►► As the prediction algorithm was generated based on
org/10.1136/bmjopen-2020- after the diagnosis of COVID-19.
the COVID-19 cases from the Chinese population,
044028). Methods The model discrimination was assessed by the
model validation in other populations might be war-
area under the receiver operating characteristic curve
Q-LW and JM contributed ranted before its direct application.
(AUC) and Somers’ D test, and calibration was examined
equally. Keywords: COVID-19; prediction; survival, risk factor;
by the calibration plot. Decision curve analysis was
prognosis
conducted.
Received 23 August 2020
Revised 20 November 2020 Main outcome measures The primary outcome was
Accepted 23 November 2020 all-cause mortality within 60 days after the diagnosis of
COVID-19. 2019. The number of confirmed cases is
Results The full model included seven predictors of continuing to rise and the related deaths pile
age, respiratory failure, white cell count, lymphocytes,
up, making it a great challenge for the health-
platelets, D-dimer and lactate dehydrogenase. The simple
care resources to meet the increased demand
model contained five indicators of age, respiratory failure,
coronary heart disease, renal failure and heart failure. After for hospital beds and medical equipment
cross-validation, the AUC statistics based on derivation (eg, ventilators). A prediction model for
cohort were 0.96 (95% CI, 0.96 to 0.97) for the full model prognosis is needed for the risk stratification
and 0.92 (95% CI, 0.89 to 0.95) for the simple model. of confirmed cases. Early identification and
The AUC statistics based on the external validation cohort intervention of patients with COVID-19 can
were 0.97 (95% CI, 0.96 to 0.98) for the full model and reduce mortality and morbidity as well as miti-
0.88 (95% CI, 0.80 to 0.96) for the simple model. Good gating the burden on the healthcare system.
calibration accuracy of these two models was found in the There are two assessment tools to evaluate
© Author(s) (or their
derivation and validation cohort. community- acquired pneumonia including
employer(s)) 2020. Re-use
permitted under CC BY-NC. No Conclusion The prediction models showed good model
CURB-65 and Pneumonia Severity Index for
commercial re-use. See rights performance in identifying patients with COVID-19 with a
high risk of death in 60 days. It may be useful for acute
adults. However, these tools were not specific
and permissions. Published by
BMJ. risk classification. for COVID-19 and they do not include known
For numbered affiliations see Web calculator We provided a freely accessible web risk factors for COVID-19-related prognosis.
end of article. calculator (https://www.whuyijia.com/). Previous studies have well documented the
association between laboratory indicators or
Correspondence to comorbidities and COVID-19 severity. The
Dr Jiang Yue;
yuejiang@whu.edu.cn and INTRODUCTION reported risk factors associated with the poor
Dr Qiao-Li Wang; The pandemic of COVID-19 has spread prognosis include older age, cardiovascular
qiaoli.wang@k i.se rapidly across the world since December metabolic diseases, respiratory disease and
Mei J, et al. BMJ Open 2020;10:e044028. doi:10.1136/bmjopen-2020-044028 1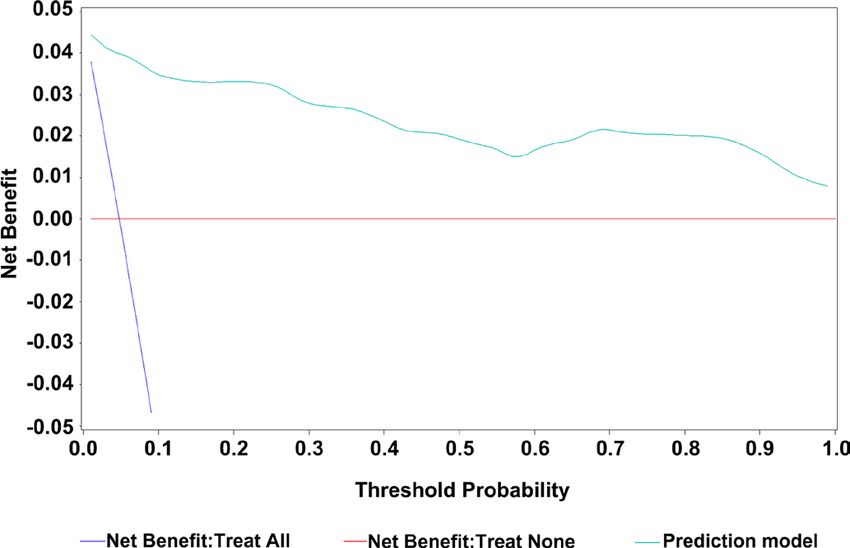
Open access
BMJ Open: first published as 10.1136/bmjopen-2020-044028 on 24 December 2020. Downloaded from http://bmjopen.bmj.com/ on March 17, 2021 by guest. Protected by copyright.
increased blood lactate dehydrogenase level.1–5 However, count, neutrophils and lymphocytes) were collected at
there are currently few models to predict mortality risk the time point for the patients’ first hospital admission.
among patients with COVID-19, and these models had a
high risk of selection and detection bias as well as model Derivation of the models
overfitting.6 Model calibration and external validation of For both the derivation cohort and external validation
risk prediction models are also lacking in the models.7–9 cohort, multiple imputations based on the multivariate
Therefore, this study aimed to develop a valid and easy- normal distribution were conducted for variables with
to-use risk prediction algorithm that estimates the risk of more than 5% missing rate.15–18 Ten imputations were
short-term mortality and to externally validate the model conducted for missing variables. We identified potential
in an independent population. auxiliary variables that had absolute correlations greater
than 0.4 with variables with missing data.19 The conver-
gence of multiple imputation models performed well,
METHODS and it was assessed by trace plots and autocorrelation
Study design, participants and data collection plots. To explore the risk pattern of short-term mortality
We performed a multicentre retrospective cohort study of among patients with COVID-19, univariate logistic regres-
1364 confirmed cases from designated tertiary hospitals sion was conducted to estimate the odds ratio (OR) with
in Hubei province, China. All confirmed 1088 cases of a 95% CI for each of the 51 variables.
COVID-19 in the derivation cohort were from two desig- We initially included all predictor variables in a multi-
nated tertiary hospitals in Wuhan (the Fifth Hospital of variate logistic regression model. Then the stepwise
Wuhan and Hubei No. 3 People’s Hospital of Jianghan selection approach was applied for prediction selection,
University) during the period of 8 January 2020–19 March with a predefined nominal significance level of 0.05 for
2020. All diagnosed patients with COVID-19 (n=276) from both model entry and retention.20 21 To avoid substantial
three designated tertiary hospitals outside Wuhan (Jiayu improvement of the goodness of model fit in the likeli-
People’s Hospital, Jingzhou First People’s Hospital and hood ratio test by the omitted predictors, the excluded
People’s Hospital of Nanzhang County) were included as predictors from the first step were later re-entered into
an independent validation cohort. the model and re-evaluated one by one. Age was included
All the patients were diagnosed by the confirmatory without any evaluation as older age has been reported to
testing for COVID-19, a real- time reverse transcrip- be strongly associated with death in patients with COVID-
tion-PCR assay with nasal and pharyngeal swab specimens 19.2 22 23 Interaction terms of predictors were tested and
according to the WHO interim guidance.10 The virus added to the model. The risk equation for predicting the
detection was repeated two times for each patient. The log odds of short-term mortality after COVID-19 infection
patients were followed up for maximal 60 days after the was computed using the estimated β estimates multiplied
diagnosis. We extracted the medical records and collected by the corresponding selected predictors, along with the
the information using a standardised case report form. average intercept. The predicted log odds of mortality
Data collection included demographic factors (eg, age (marked as µ) from the derivative model were further
at diagnosis and sex), medical history (eg, COVID-19 used for computing the predicted absolute risk of short-
diagnosis date, death or discharge status and comorbid- term mortality with the algorithm of predicted risk=1/
ities at diagnosis), symptoms and vital signs at admission, (1+e−µ).
and laboratory indicators (eg, C- reactive protein and For a quick classification of patients with COVID-19
D-dimer) for each participant. Inclusion criteria were with a high risk of short-term death, we also developed
confirmed COVID-19 cases aged ≥20 years old during the a simple model excluding laboratory tests but including
study period. comorbidities which had been previously reported to be
associated with the poor prognosis among patients with
Outcomes COVID-19. The simple model was developed without
The primary outcome was all-cause mortality, using the any predictor evaluation because all included predic-
date of death recorded on the medical records. Patients tors have been previously reported to be risk factors for
were followed up for a maximum of 60 days until the mortality among patients with COVID-19.2 12 13 22–26 The
occurrence of death or discharge. model performance of both the full and simple models
was assessed.
Candidate predictor variables
We examined candidate predictor variables based on Test of model performance and external validation
risk factors highlighted in related literature and routine The prediction accuracy of the model was assessed by the
blood laboratory tests.3 4 11–14 All demographic and epide- area under the receiver operating characteristic curve (AUC)
miological variables (eg, age, sex and smoking status), and the Somers’ D statistic.27 The AUC assessed the model’s
symptoms at diagnosis (eg, fever, headache and cough), ability to distinguish patients with from patients without
comorbidities (eg, hypertension, diabetes and respira- the outcome of interest. Somers’ D statistic measured the
tion failure), vital signs (eg, temperature, pulse rate and strength and direction of correlations between observed
respiration rate) and laboratory indicators (eg, white cell outcomes and predicted probabilities. To avoid model
2 Mei J, et al. BMJ Open 2020;10:e044028. doi:10.1136/bmjopen-2020-044028Open access
BMJ Open: first published as 10.1136/bmjopen-2020-044028 on 24 December 2020. Downloaded from http://bmjopen.bmj.com/ on March 17, 2021 by guest. Protected by copyright.
overfitting, a leave- one-out cross-
validation strategy was directly. No patients were asked to advise on interpreta-
conducted to retest the model performance.28 Unbiased tion or the writing up of results.
AUC and Somers’ D statistics were thus estimated with the
predicted probability for each patient by a model ignoring
this patient. Model calibration was assessed by comparing
the predicted risk of 60 days of death with the observed RESULTS
risks by 10th of the predicted risk. To evaluate the predicted Clinical characteristics of patients in the derivation cohort
risk distribution in various centiles, we computed the sensi- In the derivation cohort, 50% of the inpatients were
tivity, specificity, positive and negative predictive number of women, and the median age was 58 years (interquartile
deaths in the model. range [IQR], 46–66) (online supplemental table S1).
We applied the developed risk prediction algorithms About 82% of the patients had comorbidity, and the
on the independent validation cohort. We accessed both most common comorbidities were hypertension (31%),
discrimination and calibration accuracies in these patients. diabetes (17%), respiratory failure (7%), coronary heart
disease (7%) and liver disease (7%). The most common
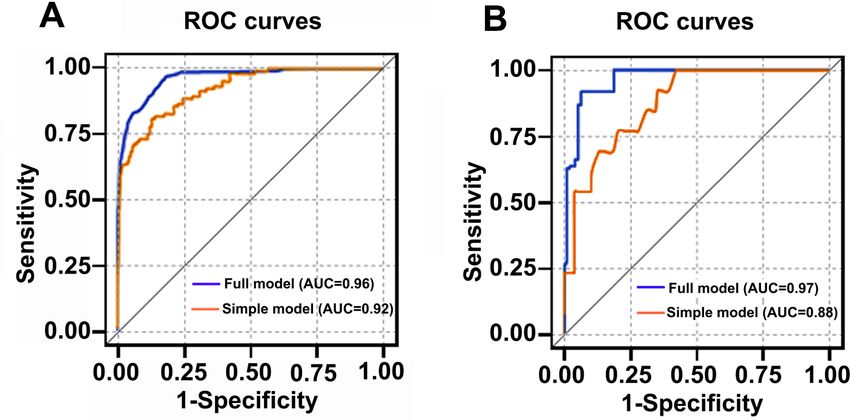
Decision curve analysis symptoms at admission were fever, cough, fatigue and
To evaluate the clinical utility, a decision curve analysis breathlessness (70%, 57%, 27% and 27%, respectively).
was conducted in the external validation cohort.29 We A total of 103 deaths (9.5%) were reported from the
assessed the net benefit of the prediction model by esti- patients in the derivation cohort (online supplemental
mating the differences between the proportion of true table S2).
positive and false positive value and they were later multi-
plied by the risk odds. The decision curve evaluated the Predictor variables
net benefit of correctly identifying patients who would The ORs and 95% CIs of 51 predictor variables in the
have an event with the relative harms of a false-positive univariable logistic regression models were shown in
prediction across a wide range of threshold probabilities. online supplemental table S3. The full model included
The strategy of risk prediction model application was predictors of age (per year increase, continuous), respi-
then compared with strategies of ‘treat all patients’ and ratory failure (yes vs no), white cell count (per 109/L
‘treat no patient’. increase, continuous), lymphocytes (per 109/L increase,
This study followed the Transparent Reporting of a continuous), platelets (per 109/L increase, continuous),
multivariable Prediction model for Individual Prognosis D-dimer (per 1 µg/mL increase, continuous), lactate
or Diagnosis guidelines and checklist.30 31 The statistical dehydrogenase (per 1 U/L increase, continuous), and
software package SAS 9.4 for Windows was used for statis- two interactions of white cell count with platelets and
tical analysis. D-dimer with lactate dehydrogenase. In this model, an
increased risk of mortality was markedly associated with
Patient and public involvement respiratory failure (OR 53; 95% CI, 22 to 128) (table 1).
No patients were involved in the study design or in setting The simple model included age, respiratory failure,
the research questions or in the outcome measures coronary heart disease, renal failure, heart failure, and
Table 1 Association between included predictor variables and 60-day mortality in the full model, expressed as ORs with 95%
CIs and beta coefficients in the model
Factors OR (95% CI) P value β coefficients
Age (per year increase) 1.07 (1.03 to 1.10) 0.0001 0.069800
Respiratory failure 4.120200
No ReferenceOpen access
BMJ Open: first published as 10.1136/bmjopen-2020-044028 on 24 December 2020. Downloaded from http://bmjopen.bmj.com/ on March 17, 2021 by guest. Protected by copyright.
Figure 1 The receiver operating characteristic curves
(ROCs) for the full model and simple model. (A) The full and
simple models after cross-validation; (B) the full and simple
models in external validation. AUC, area under the receiver
operating characteristic curve.
interaction between age and renal failure. Both risk
prediction algorithms can be found in the supplemental
document.
Figure 2 Calibration plots in the study cohorts for prediction
Model performance models. (A) Calibration plot of the derivation cohort based on
The receiver operating characteristic curves for the the full model; (B) calibration plot of the external validation
prediction models were shown in figure 1 and table 2. cohort based on the full model; (C) calibration plot of the
The AUC statistics without cross-validation based on the derivation cohort based on the simple model; (D) calibration
derivation cohort were 0.97 (95% CI, 0.96 to 0.97) for plot of the external validation cohort based on the simple
the full model and 0.92 (95% CI, 0.90 to 0.95) for the model.
simple model. After cross-validation, the AUC statistics
were lightly declined to 0.96 (95% CI, 0.96 to 0.97) in the External validation
full model and 0.92 (95% CI, 0.89 to 0.95) in the simple In the validation cohort, 55% of the patients were
model, indicating the comparable performance of the women (online supplemental table S1). The median
simple model with the full model. age was 49 years (IQR, 36–62) and the proportion of
A good performance was observed between the death was 5.1% (14/276) (online supplemental table
observed and predicted proportion of events in both S2). About 39% of the patients had comorbidity, and
the full and simple models from the derivation cohort the most common comorbidities were hypertension
and external validation cohort, indicating that the (18%), liver disease (8%) and diabetes (5%). The AUC
algorithms were well calibrated (figure 2). The sensi- statistics based on the external validation cohort were
tivity, specificity, positive predictive value and negative 0.97 (95% CI, 0.96 to 0.98) for the full model and 0.88
predictive value of the risk prediction model across (95% CI, 0.80 to 0.96) for the simple model.
various risk thresholds based on the derivation cohort
were shown in online supplemental table S4. For Decision curve analysis
example, with a risk threshold of 30%, the model has a The decision curve analysis showed the net benefit in
sensitivity for identifying deaths of 74.2%, a specificity 60 days after COVID-19 diagnosis in adults using the
of 97.2%, a positive predictive value of 71.7% and a short-term mortality algorithm of the full model. The
negative predictive value of 97.5%. figure indicated an overall higher net benefit of the risk
Table 2 Performance of prediction model for COVID-19 mortality risk
Original without cross-validation Leave-one-out cross validation External validation
AUC AUC AUC
Model (95% CI) Somers' D (95% CI) Somers' D (95% CI) Somers' D
Full model 0.97 0.94 0.96 0.92 0.97 0.93
(7 variables) (0.96 to 0.97) (0.96 to 0.97) (0.96 to 0.98)
Simple model 0.92 0.85 0.92 0.84 0.88 0.76
(5 variables) (0.90 to 0.95) (0.89 to 0.95) (0.80 to 0.96)
AUC, area under the receiver operating characteristic curve.
4 Mei J, et al. BMJ Open 2020;10:e044028. doi:10.1136/bmjopen-2020-044028Open access
BMJ Open: first published as 10.1136/bmjopen-2020-044028 on 24 December 2020. Downloaded from http://bmjopen.bmj.com/ on March 17, 2021 by guest. Protected by copyright.
was preferred over the Hosmer-Lemeshow tests because
the latter are powerless in detecting the overfitting of
predictor effects and sensitive to sample size.32–34
There are also limitations. Misclassification is unavoid-
able for self-reported variables, for example, smoking
history. Yet they were not selected in the full model and all
the final included predictors were clinically relevant data
that were directly retrieved from clinical medical records,
which ensured its accuracy. Both the mortality and comor-
bidity rates were higher in the derivation cohort compared
with the validation cohort because the derivation cohort
was based on the data from Wuhan, which was the centre
of the COVID-19 outbreak and had more severe patients.
The differences in mortality and comorbidity rate might
Figure 3 Decision curve analysis for the risk prediction affect the calibration of the validation cohort. Missing
algorithm of COVID-19.
predictor variables from both the derivation and valida-
tion cohorts were reported. Although these variables with
a missing rate of more than 5% were imputed for 10 times
prediction algorithm compared with the approaches
by the multiple imputations approach, potential infor-
based on considering either no patients or all patients
mation bias cannot be ruled out. Co-linearity was iden-
for intervention, across all risk thresholds (figure 3).
tified, which complicated the full model. Therefore, we
Model presentation introduced the interaction terms. In addition, concerns
We constructed an interactive web tool that integrated the of representativeness of the validation cohort might be
risk prediction algorithms based on either the full model possible given the cohort sample size. Since the predic-
or the simple model (https://www.whuyijia.com/). For tion models were developed based on the Chinese popu-
COVID-19-confirmed cases, the risk calculator provides lation, model validation in other populations might be
the probabilities of mortality in 60 days with a numerical necessary before its direct application.
scale. A recent systematic review of prediction models for
diagnosis and prognosis of COVID-19 pointed out that
the existing prognostic models had high or unclear risks
DISCUSSION of both bias and overfitting.6 Moreover, the mortality
This study developed a full model to predict individual prediction models did not present any applicable equa-
risk of short- term mortality after COVID-19 diagnosis, tions or web calculators, which made it impossible to use
with predictors of age, respiratory failure, white cell count, or verify. Among eight mortality prediction models, only
lymphocytes, platelets, D-dimer and lactate dehydroge- one model assessed the calibration.7 8 35–40 It has been
nase. The model showed good performance regarding found that the predicted mortality risk of that model was
discrimination and calibration accuracy in both the deri- too high for low-risk patients and too low for high-risk
vation and validation cohorts. We also developed a simple patients when applied to new patients.38 The disagree-
and easy-to-use model with only five readily available vari- ment between the observed and predicted proportion
ables including age, comorbidities of respiratory failure, of events may be due to the small size of cases and the
coronary heart disease, renal failure and heart failure, selection bias in a case-control setting. A mortality model
which can be used as a clinical risk stratification tool. A based on 117 000 confirmed cases was developed using
higher net benefit of the prediction model was observed artificial intelligence, and the accuracy of the predic-
compared with treat- all or treat-none approaches at tion rate was 93%. However, the predictors included in
various risk thresholds, indicating the potential clinical the final model were unclear, and no application equa-
usefulness. The risk prediction algorithms were inte- tion was provided.36 Although comorbidities have been
grated as an online risk calculator. reported to be associated with the worse outcome, only a
Strengths of this study included the cohort design few comorbidities have been screened during the model
with complete follow-up and limited bias from patients’ development in these studies. Specifically, the simple
selection or disease detection. We involved all patients model developed in this study was based on the well-
with COVID-19 in the defined hospitals during the study known risk factors of prognosis of COVID-19 (ie, indi-
period and followed them up for the coming 60 days at vidual comorbidities conditions such as coronary heart
hospitals. An independent population from other cities disease and renal failure). This model also presented a
was applied for external validation of the prediction good model performance and is easy to use with only five
model. The model performance was assessed using a readily available predictors.
cross-validation strategy, and the calibration plots of both Our full model included seven key determinants of
the derivation and external validation cohorts indicated a death after COVID-19 infection, such as age, respiratory
good performance of the full model. The calibration plot failure, white cell count, lymphocytes, platelets, D-dimer
Mei J, et al. BMJ Open 2020;10:e044028. doi:10.1136/bmjopen-2020-044028 5Open access
BMJ Open: first published as 10.1136/bmjopen-2020-044028 on 24 December 2020. Downloaded from http://bmjopen.bmj.com/ on March 17, 2021 by guest. Protected by copyright.
2
and lactate dehydrogenase. These variables have been Department of Respiratory and Critical Care, Jingzhou First People's Hospital,
documented to be associated with the mortality risk of Jingzhou, China
3
Emergency Department, Fifth Hospital in Wuhan, Wuhan, Hubei, China
COVID-19.2 4 22 23 25 26 41–47 The data from different regions 4
Department of Cardiology, Hubei No.3 People's Hospital of Jianghan University,
suggest that the risk of severity and mortality of COVID-19 Wuhan, Hubei, China
increases with age.1 2 22 It has been reported that the average 5
Department of Cardiology, Internal Medicine, Jiayu People's Hospital, Jiayu, China
6
death rate for adults over 80 was about 9.3%, but the death Department of Pharmacology, School of Basic Medical Sciences, Wuhan University,
rate for adults under 60 was less than 0.2%.2 Despite the Wuhan, China
7
Institute of Hepatobiliary Diseases of Wuhan University, Zhongnan Hospital of
higher OR found among men in the univariate analysis Wuhan University, Wuhan, China
of this study, sex was not included in the full model after 8
Hubei Province Key Laboratory of Allergy and Immunology, Wuhan, China
multivariate analysis as it did not reach the predefined 9
Department of Medical Epidemiology and Biostatistics, Karolinska Institutet,
nominal significance level of entry and retention criteria. Stockholm, Sweden
COVID-19 mainly affected the respiratory system, and
the mortality risk significantly increased in patients who Acknowledgements We thank Maoqing Ye, Mengya Fan, Niuniu Gao, Fangfang
Wang, Yulu Feng, Rui Zhang, Shiyan Chen, Jianfang Ye, Junlu Tong, Zhanjin Lu,
had severe respiratory failure.25 26 The mortality rate in Feina Cai, Mingxuan Li and Yiding Qi for their efforts in collecting the information.
critical cases of COVID-19 with respiratory failure has
Contributors QW and JM contributed equally and share the first authorship. QW,
been reported between 26% and 61.5%.41 42 46 Lympho- JM, WH, QC, CL, ZC, QY and JY—study conception and design. QW, JM, WH, QC,
penia, D-dimer and lactate dehydrogenase have also been CL, ZC, YF, ST, ZZ, BL and JY—data collection, analysis and review. QW and JY—
shown as independent risk factors associated with the statistical analysis and interpretation. JM and JY—administrative and technical
support. QW, JM and JY—drafting of the manuscript. QW, JM, WH, QC, CL, ZC, YF,
severity and mortality of COVID-19.4 43–45 47 Lymphopenia
ST, ZZ, BL, QY and JY—critical revision of the manuscript.
was associated with a 2.99-fold higher risk of COVID-19
Funding This study was supported by the National Natural Science Foundation
severity and an increase per 1 U/L of lactate dehydroge- of China (No. 81970653) and Medical Science Advancement Program (Clinical
nase was independently related to 1.012 higher risk for Medicine) of Wuhan University (Grant No. TFLC 2018003).
disease severity.5 41 The OR of COVID-19 mortality was Competing interests None declared.
2.14 higher when D-dimer reached 0.5 µg/ml or higher.4
Patient consent for publication Not required.
These laboratory predictors themselves might also serve
Ethics approval The study was approved by the institutional board of Ningbo
as indicators of other severe diseases, such as heart failure First Hospital of Zhejiang University (2020-R120) with a waiver of written informed
or renal failure. consent. The study was in accordance with the ethical standards of the institutional
This prediction model might be useful for clinicians to and national research committee and with the 1964 Helsinki Declaration and its
identify confirmed patients with COVID-19 who are at a later amendments or comparable ethical standards.
very high risk of mortality. We have provided a novel algo- Provenance and peer review Not commissioned; externally peer reviewed.
rithm to predict the 60-day mortality risk of confirmed Data availability statement No data are available.
patients with COVID-19, which may help clinicians do the Supplemental material This content has been supplied by the author(s). It has
objective decision-making based on medical and epidemi- not been vetted by BMJ Publishing Group Limited (BMJ) and may not have been
ological evidence. The web-based risk calculator is freely peer-reviewed. Any opinions or recommendations discussed are solely those
of the author(s) and are not endorsed by BMJ. BMJ disclaims all liability and
accessible and could serve as a resource to support patient responsibility arising from any reliance placed on the content. Where the content
education and inform discussions around outcome includes any translated material, BMJ does not warrant the accuracy and reliability
expectations and management, including rehabilitation of the translations (including but not limited to local regulations, clinical guidelines,
needs. It can also serve as a data-driven tool to enable terminology, drug names and drug dosages), and is not responsible for any error
and/or omissions arising from translation and adaptation or otherwise.
patients and their relatives to effectively participate in
making clinical decisions together with clinicians. Our Open access This is an open access article distributed in accordance with the
Creative Commons Attribution Non Commercial (CC BY-NC 4.0) license, which
simple model including age, respiratory failure, coronary permits others to distribute, remix, adapt, build upon this work non-commercially,
heart disease, renal failure and heart failure is potentially and license their derivative works on different terms, provided the original work is
useful for the quick risk classification of patients at admis- properly cited, appropriate credit is given, any changes made indicated, and the use
sion. The laboratory markers included in the algorithm is non-commercial. See: http://creativecommons.org/licenses/by-nc/4.0/.
indicated that these indicators might be involved in the ORCID iD
pathophysiological mechanism of COVID-19 infection. Jiang Yue http://orcid.org/0000-0001-8906-1253
CONCLUSION
In this study, we developed the prediction algorithms REFERENCES
1 Chen T, Wu D, Chen H, et al. Clinical characteristics of 113 deceased
of 60-day mortality risk among patients with COVID-19. patients with coronavirus disease 2019: retrospective study. BMJ
The easy- to-
use model presented good discrimination 2020;368:m1091.
and calibration ability and was well externally validated 2 Jordan RE, Adab P, Cheng KK. Covid-19: risk factors for severe
disease and death. BMJ 2020;368:m1198.
in an independent population. The online risk calculator 3 Li B, Yang J, Zhao F, et al. Prevalence and impact of cardiovascular
could provide immediate risk prediction for clinical use. metabolic diseases on COVID-19 in China. Clin Res Cardiol
2020;109:531–8.
4 Zhou F, Yu T, Du R, et al. Clinical course and risk factors for mortality
Author affiliations of adult inpatients with COVID-19 in Wuhan, China: a retrospective
1
Central Laboratory, Ningbo First Hospital, Zhejiang University, Ningbo, China cohort study. Lancet 2020;395:1054–62.
6 Mei J, et al. BMJ Open 2020;10:e044028. doi:10.1136/bmjopen-2020-044028Open access
BMJ Open: first published as 10.1136/bmjopen-2020-044028 on 24 December 2020. Downloaded from http://bmjopen.bmj.com/ on March 17, 2021 by guest. Protected by copyright.
5 Shi J, Li Y, Zhou X, et al. Lactate dehydrogenase and susceptibility to 28 Thrift AP, Kendall BJ, Pandeya N, et al. A model to determine
deterioration of mild COVID-19 patients: a multicenter nested case- absolute risk for esophageal adenocarcinoma. Clin Gastroenterol
control study. BMC Med 2020;18:168. Hepatol 2013;11:138–44.
6 Wynants L, Van Calster B, Collins GS, et al. Prediction models for 29 Vickers AJ, Elkin EB. Decision curve analysis: a novel method for
diagnosis and prognosis of covid-19 infection: systematic review and evaluating prediction models. Med Decis Making 2006;26:565–74.
critical appraisal. BMJ 2020;369:m1328. 30 Moons KGM, Altman DG, Reitsma JB, et al. Transparent reporting
7 Caramelo F, Ferreira N, Oliveiros B. Estimation of risk factors for of a multivariable prediction model for individual prognosis or
COVID-19 mortality - preliminary results. medRxiv 2020. diagnosis (TRIPOD): explanation and elaboration. Ann Intern Med
8 Shi Y, Yu X, Zhao H, et al. Host susceptibility to severe COVID-19 2015;162:W1–73.
and establishment of a host risk score: findings of 487 cases outside 31 Collins GS, Reitsma JB, Altman DG, et al. Transparent reporting of a
Wuhan. Crit Care 2020;24:108. multivariable prediction model for individual prognosis or diagnosis
9 Wang S, Zha Y, Li W, et al. A fully automatic deep learning system (TRIPOD): the TRIPOD statement. BMJ 2015;350:g7594.
for COVID-19 diagnostic and prognostic analysis. Eur Respir J 32 Kramer AA, Zimmerman JE. Assessing the calibration of mortality
2020;56:2:2000775. benchmarks in critical care: the Hosmer-Lemeshow test revisited.
10 World Health Organization. Clinical management of severe acute Crit Care Med 2007;35:2052–6.
respiratory infection when novel coronavirus (2019-nCoV) infection is 33 Collins GS, de Groot JA, Dutton S, et al. External validation
suspected: interim guidance, 2020. Available: https://www.who.int/ of multivariable prediction models: a systematic review of
publications/i/item/laboratory-testing-of-2019-novel-coronavirus-(- methodological conduct and reporting. BMC Med Res Methodol
ncov)-in-suspected-human-cases-interim-guidance-17-january-20 2014;14:40.
11 Lei F, Liu Y-M, Zhou F, et al. Longitudinal association between 34 Alonzo TA. Clinical prediction models: a practical approach to
markers of liver injury and mortality in COVID-19 in China. development, validation, and updating: by Ewout W. Steyerberg. Am
Hepatology 2020;72:389–98. J Epidemiol 2009;170:528.
12 Li X, Xu S, Yu M, et al. Risk factors for severity and mortality 35 Lu J, Hu S, Fan R, et al. ACP risk grade: a simple mortality index
in adult COVID-19 inpatients in Wuhan. J Allergy Clin Immunol for patients with confirmed or suspected severe acute respiratory
2020;146:110–8. syndrome coronavirus 2 disease (COVID-19) during the early stage of
13 Shi S, Qin M, Shen B, et al. Association of cardiac injury with outbreak in Wuhan, China. SSRN Journal 2020.
mortality in hospitalized patients with COVID-19 in Wuhan, China. 36 Pourhomayoun MSM. Predicting mortality risk in patients with
JAMA Cardiol 2020;5:802. covid-19 using artificial intelligence to help medical decision-making.
14 Zhu L, She Z-G, Cheng X, et al. Association of blood glucose control medRxiv 2020.
and outcomes in patients with COVID-19 and pre-existing type 2 37 Sarkar J, Chakrabarti P. A machine learning model reveals older age
diabetes. Cell Metab 2020;31:1068–77. and delayed hospitalization as predictors of mortality in patients with
15 Moons KGM, Donders RART, Stijnen T, et al. Using the outcome COVID-19. medRxiv 2020.
for imputation of missing predictor values was preferred. J Clin 38 Xie J, Hungerford D, Chen H, et al. Development and external
Epidemiol 2006;59:1092–101. validation of a prognostic multivariable model on admission for
16 Schafer JL. Multiple imputation: a primer. Stat Methods Med Res hospitalized patients with COVID-19. SSRN Journal 2020.
1999;8:3–15. 39 Yan L, Zhang H-T, Xiao Y, et al. Prediction of criticality in patients with
17 Schafer JL, Graham JW. Missing data: our view of the state of the severe Covid-19 infection using three clinical features: a machine
art. Psychol Methods 2002;7:147–77. learning-based prognostic model with clinical data in Wuhan.
18 Steyerberg EW, van Veen M. Imputation is beneficial for handling medRxiv 2020.
missing data in predictive models. J Clin Epidemiol 2007;60:979. 40 Yuan M, Yin W, Tao Z, et al. Association of radiologic findings with
19 Enders CK. Applied missing data analysis. New York: Guilford Press, mortality of patients infected with 2019 novel coronavirus in Wuhan,
2010: xv, 377. China. PLoS One 2020;15:e0230548.
20 Xie S-H, Santoni G, Mälberg K, et al. Prediction model of long-term 41 Bhatraju PK, Ghassemieh BJ, Nichols M, et al. Covid-19 in Critically
survival after esophageal cancer surgery. Ann Surg 2019:9000. Ill Patients in the Seattle Region - Case Series. N Engl J Med
21 Wang Q-L, Lagergren J, Xie S-H. Prediction of individuals at high 2020;382:2012–22.
absolute risk of esophageal squamous cell carcinoma. Gastrointest 42 Grasselli G, Zangrillo A, Zanella A, et al. Baseline characteristics and
Endosc 2019;89:726–32. outcomes of 1591 patients infected with SARS-CoV-2 admitted to
22 Banerjee A, Pasea L, Harris S, et al. Estimating excess 1-year ICUs of the Lombardy region, Italy. JAMA 2020;323:1574.
mortality associated with the COVID-19 pandemic according to 43 Lippi G, Favaloro EJ. D-Dimer is associated with severity of
underlying conditions and age: a population-based cohort study. coronavirus disease 2019: a pooled analysis. Thromb Haemost
Lancet 2020;395:1715–25. 2020;120:876–8.
23 Chen Z, Fan H, Cai J, et al. High-resolution computed tomography 44 Mardani R, Ahmadi Vasmehjani A, Zali F, et al. Laboratory
manifestations of COVID-19 infections in patients of different ages. parameters in detection of COVID-19 patients with positive
Eur J Radiol 2020;126:108972. RT-PCR; a diagnostic accuracy study. Arch Acad Emerg Med
24 Cheng Y, Luo R, Wang K, et al. Kidney disease is associated 2020;8:e43.
with in-hospital death of patients with COVID-19. Kidney Int 45 Tan L, Wang Q, Zhang D, et al. Lymphopenia predicts disease
2020;97:829–38. severity of COVID-19: a descriptive and predictive study. Signal
25 Severe Covid-19 GWAS Group, Ellinghaus D, Degenhardt F, et al. Transduct Target Ther 2020;5:33.
Genomewide association study of severe Covid-19 with respiratory 46 Yang X, Yu Y, Xu J, et al. Clinical course and outcomes of critically ill
failure. N Engl J Med 2020;383:1522–34. patients with SARS-CoV-2 pneumonia in Wuhan, China: a single-
26 Li X, Ma X. Acute respiratory failure in COVID-19: is it "typical" centered, retrospective, observational study. Lancet Respir Med
ARDS? Crit Care 2020;24:198. 2020;8:475–81.
27 Steyerberg EW, Vickers AJ, Cook NR, et al. Assessing the 47 Zhao Q, Meng M, Kumar R, et al. Lymphopenia is associated with
performance of prediction models: a framework for traditional and severe coronavirus disease 2019 (COVID-19) infections: a systemic
novel measures. Epidemiology 2010;21:128–38. review and meta-analysis. Int J Infect Dis 2020;96:131–5.
Mei J, et al. BMJ Open 2020;10:e044028. doi:10.1136/bmjopen-2020-044028 7You can also read