Effects of Vitamin D Supplementation During Pregnancy on Birth Size: A Systematic Review and Meta-Analysis of Randomized Controlled Trials - MDPI
←
→
Page content transcription
If your browser does not render page correctly, please read the page content below
nutrients
Review
Effects of Vitamin D Supplementation During
Pregnancy on Birth Size: A Systematic Review and
Meta-Analysis of Randomized Controlled Trials
Andrea Maugeri , Martina Barchitta , Isabella Blanco            and Antonella Agodi *
 Department of Medical and Surgical Sciences and Advanced Technologies “GF Ingrassia”, University of Catania,
 Via S. Sofia 87, 95123 Catania, Italy; andreamaugeri88@gmail.com (A.M.); martina.barchitta@unict.it (M.B.);
 dott.ssa.blanco.isabella@gmail.com (I.B.)
 * Correspondence: agodia@unict.it

 Received: 23 January 2019; Accepted: 15 February 2019; Published: 20 February 2019

 Abstract: During pregnancy, vitamin D supplementation may be a feasible strategy to help
 prevent low birthweight (LBW) and small for gestational age (SGA) births. However, evidence
 from randomized controlled trials (RCTs) is inconclusive, probably due to heterogeneity in study
 design and type of intervention. A systematic literature search in the PubMed-Medline, EMBASE,
 and Cochrane Central Register of Controlled Trials databases was carried out to evaluate the effects of
 oral vitamin D supplementation during pregnancy on birthweight, birth length, head circumference,
 LBW, and SGA. The fixed-effects or random-effects models were used to calculate mean difference
 (MD), risk ratio (RR), and 95% Confidence Interval (CI). On a total of 13 RCTs, maternal vitamin D
 supplementation had a positive effect on birthweight (12 RCTs; MD = 103.17 g, 95% CI 62.29–144.04 g),
 length (6 RCTs; MD = 0.22 cm, 95% CI 0.11–0.33 cm), and head circumference (6 RCTs; MD:0.19 cm,
 95% CI 0.13–0.24 cm). In line with these findings, we also demonstrated that maternal vitamin D
 supplementation reduced the risk of LBW (3 RCTs; RR = 0.40, 95% CI 0.22–0.74) and SGA (5 RCTS;
 RR = 0.69, 95% CI 0.51–0.92). The present systematic review and meta-analysis confirmed the
 well-established effect of maternal vitamin D supplementation on birth size. However, further
 research is required to better define risks and benefits associated with such interventions and the
 potential implications for public health.

 Keywords: nutrition; diet; vitamin D; birthweight; birth length; head circumference; gestational age;
 pregnancy outcomes

1. Introduction
     Nutrition in women of childbearing age has a critical role on their health as well as on infant
outcomes. A balanced supply of maternal nutrients, before conception, during pregnancy, and during
breastfeeding, promotes optimal growth and development both in fetus and offspring [1,2]. During
pregnancy, the fetus is entirely dependent on maternal sources of vitamin D, which also regulates
placental function [3]. Several observational studies have shown that pregnancy is a crucial period
in which vitamin D deficiency may affect mother and neonatal outcomes, thereby influencing the
risk of recurrent pregnancy losses, preeclampsia, gestational diabetes, maternal infections, preterm
birth, low birthweight (LBW), small for gestational age (SGA), and poor offspring health [4]. Thus,
hypovitaminosis D in pregnancy requires an adequate treatment, and vitamin D supplementation
represents a valid strategy for preventing and controlling vitamin D deficiency [5]. The Food and
Nutrition Board at the Institute of Medicine of the National Academies suggests that a proper
integration of vitamin D in pregnancy and in lactation is 15 micrograms (600 IU) per day [6]. Recently,

Nutrients 2019, 11, 442; doi:10.3390/nu11020442                               www.mdpi.com/journal/nutrients
Nutrients 2019, 11, 442 2 of 16
many randomized controlled trials (RCTs) have been conducted to evaluate the benefits of vitamin D
supplementation in pregnancy. Although vitamin D supplementation may increase serum 25(OH)D
levels in both mothers and infants [7], it remains unclear whether vitamin D supplementation is
protective for LBW, SGA or intrauterine growth restriction, and generally for long-term offspring
health. To our knowledge, the meta-analysis by Thorne-Lyman et al. was the first to summarize
the effect of vitamin D on birthweight and LBW incidence [8]. Pooled estimates of observational
studies showed a positive relationship between vitamin D status and birthweight [8]. However,
pooled analysis of interventional studies suggested, on one hand, no significant effect on mean
birthweight, but on the other hand a lower risk of LBW newborns in women supplemented with
vitamin D [8]. A recent systematic review by Harvey et al. [4] partially confirmed these results:
out of seven studies, three trials showed that maternal vitamin D supplementation significantly
increased birthweight in infants [4]. Although this evidence was also corroborated by Perez-Lopez
et al. in a meta-analysis of 8 RCTs, the authors did not demonstrate the influence on the risk of LBW
and SGA (3 RCTs, respectively) [5]. In contrast, four trials included in the most recent systematic
review by De-Regil et al. reported that maternal vitamin D supplementation significantly reduced
the risk of LBW [7]. However, no difference was reported in the mean birthweight of infants [7].
Therefore, evidence is currently inconclusive to drawn convincing assumptions on the usefulness of
maternal vitamin D supplementation against LBW and SGA births. Moreover, previous mentioned
reviews [4,5,7,8] showed heterogeneity in dose, duration and timing of supplementation, and study
design (i.e., observational studies, quasi-RCTs, and RCTs). Herein, we provide a systematic review and
a meta-analysis of data from RCTs, to evaluate the effects of oral vitamin D supplementation during
pregnancy on fetal growth as indicated by neonatal anthropometric measures and incidence of LBW
and SGA births. Moreover, we also performed subgroup analyses to demonstrate whether alternative
formulations and regimens had different effect on birth size.
2. Materials and Methods
2.1. Literature Search
A systematic literature search in the PubMed-Medline, EMBASE, and Cochrane Central Register
of Controlled Trials databases was carried out for RCTs investigating the role of oral vitamin D
supplementation during pregnancy on neonatal anthropometric measures and incidence of LBW
and SGA. Literature search was conducted independently by two authors (A.M. and I.B.) using the
following keywords: (vitamin d OR ergocalciferol OR cholecalciferol OR calcifediol OR vitamin d
supplementation OR 25-hydroxyvitamin D) AND (birth size OR birth weight OR birth length OR
head circumference OR low birth weight OR SGA OR neonatal anthropometric measures). Full details
of literature search terms are included in Supplementary Materials. The databases were searched
from inception to May 2017 without language restriction; abstracts and unpublished studies were
not included. Moreover, the reference lists from selected articles, including relevant review papers,
were searched to identify all relevant studies. The preferred reporting items for systematic reviews
and meta-analysis (PRISMA) guidelines were followed [9].
2.2. Inclusion and Exclusion Criteria
Studies were selected only if they satisfied the following criteria: (1) RCTs, with randomization
at either individual or cluster level, (2) of pregnant women of any gestational age (3) without
pregnancy complications, (4) that assessed the effect of oral vitamin D supplementation, irrespective
of dose, duration or time of commencement, on birthweight, birth length, head circumference,
and incidence of LBW, and/or SGA. Eligible intervention groups included daily or single-intermitted
vitamin D supplementation (vitamin D2 or D3), alone or in combination with calcium and/or other
micronutrients. For studies with more than two intervention groups, we combined disaggregated data
into subgroup category to create a single pair-wise group comparison [10]. Control groups includedNutrients 2019, 11, 442 3 of 16
no treatment or placebo. Exclusion criteria were as follows: (1) systematic reviews or meta-analyses;
(2) observational studies, cross-over trials, or quasi-RCTs; (3) no appropriate treatment group (pregnant
women with pre-existing pregnancy complications); (4) no appropriate control group (i.e., vitamin D
supplementation); (5) not available data on birth size and/or incidence of LBW and SGA.
2.3. Study Selection and Data Extraction
Two of the authors (A.M. and I.B.) independently assessed for inclusion all the references identified
through the literature search. From all the eligible studies, two authors (A.M. and I.B.) independently
extracted the following information in a standard format: first author’s last name, year of publication,
country, and latitude where the study was performed, season when the study was performed, number
of participants, age and information about vitamin D intervention (i.e., Formulation, regimen, method
of administration, and treatment duration). Primary outcomes were birthweight (g), birth length
(cm), head circumference (cm), low birthweight (LBW;Nutrients 2019, 11, 442 4 of 16
heterogeneity, otherwise the random-effects model (Der Simonian-Laird method). In the random
effect model, the between-study variance was estimated using the tau-squared (τ2) statistic [10].
The leave-one-out sensitivity analysis was performed by the omission of a single study at a time,
to assess whether a particular omission could affect effect sizes and heterogeneity across studies.
Sensitivity analysis by the omission of studies with daily vitamin D dose of 200 IU [13,14] was also
performed to assess whether they affected the pooled effect sizes. We also performed subgroup
analyses by formulation (vitamin D alone vs. vitamin D in combination with calcium and/or other
micronutrients) and supplementation regimen (daily vs. single/intermitted high dose). Since vitamin
D might have a dose-dependent effect on birth sizes, we performed a meta-regression using the
Comprehensive Meta-analysis software (Version 2.0; Biostat Inc., Englewood, NJ, USA). Particularly,
meta-regression analyses were performed on those outcomes with at least three studies evaluating daily
vitamin D supplementation alone [15]. Heterogeneity in formulation, dose, duration, and timing of
supplementation, did not allow us to perform meta-regression of studies with single supplementation
and/or combination of supplements. In those outcomes with at least two group comparisons for
subgroup, we assessed subgroup differences by the χ2 statistic, and the interaction test I2 value. In those
outcomes with 10 or more group comparisons, the presence of publication bias was investigated
by visually assessment of funnel plot asymmetry, followed by Begg’s test and Egger’s regression
asymmetry test [16,17]. Except for the Q-test, p < 0.05 was considered statistically significant, and
all tests were 2-sided. All statistical analyses were performed using the Review Manager software
(RevMan, version 5.3).
3. Results
3.1. Study Selection
The detailed steps of the study selection are given as a PRISMA flow diagram in Figure 1.
A total of 669 abstracts were retrieved from the databases; 542 were excluded after reading titles
and/or abstracts, and 127 articles were subjected to a full-text review. From these, 114 studies
were excluded according to selection criteria, whereas 13 RCTs, published between 1980 and 2016,
were included in the meta-analysis [13,14,18–28]. However, since four articles showed more eligible
intervention groups [19–21,28], the meta-analysis reported data on 17 group comparisons between
eligible intervention (n = 17) and control groups (n = 13) (Table 1).Nutrients 2019, 11, 442 5 of 16
Nutrients 2018, 10, x FOR PEER REVIEW 5 of 16
Figure 1. PRISMA flow diagram of study selection.
Figure 1. PRISMA flow diagram of study selection.
Table 1. Characteristics of randomized controlled trials included in the meta-analysis.
Table 1. Characteristics of randomized controlled trials included in the meta-analysis.
Size of Treatment
First Author, Treatment (Vitamin CONTROL
Country Intervention/ Duration Outcomes
Year Treatment
D Dosage) GROUP Size of Treatmen
First Author, Countr Control Control Groups (Week)
(vitamin D intervention/c t duration Outcomes
year2016
Asemi, y Vit D3 + Ca (200 group Birthweight, birth length,
[13]
Iran dosage)
IU/day)
Placebo ontrol21/21
groups (week)
9
head circumference
Vit D3 + Ca Birthweight, birth length,
Asemi, 2016 [13]
Brooke, 1980
Iran Vit IU/day)
D2 (1000
Placebo 21/21 9 Birthweight, birth length,
UK (200 Placebo 59/67 8–12 headhead circumference
circumference, LBW,
[18] IU/day)
Birthweight,
SGA birth length,
Vit D2 (1000
Brooke, 1980 [18] UK Vit D3 + Placebo 59/67 8-12 head circumference, LBW,
Brough, 2010 IU/day) Birthweight, head
UK micronutrients (200 Placebo 88/61 NA SGA
[14] circumference, LBW, SGA
IU/day)
Vit D3 +
Brough, 2010 Vit D + Ca (1000 Birthweight, head
Charandabi, UK micronutrients Placebo 88/61
40/42 NA Birthweight, birthLBW,
length,SGA
[14] Iran IU/day) Placebo 9 circumference,
2015 [19] (200 IU/day) head circumference
Vit D (1000 IU/day) 42/42
Vit D + Ca (1000
Vit D2 (800 IU/day) No 40/42 Birthweight
Goldring,
Charandabi, UK IU/day) 56/50 12 Birthweight, birth length,
Iran Vit D3 (single dose intervention
Placebo 9
2013 [19]
2015 [20] Vit D (1000 head circumference
of 200000 IU)
42/42
IU/day)
Vit D3 +
Vit D2 (800
micronutrients 122/111
Birthweight
USA Placebo 24–28
Hollis, 2011 (1600 IU/day)
IU/day) No
Goldring,
[21] 2013 Vit D3 +
UK Vit D3 (single
micronutrients interventi 56/50
117/111 12 Birthweight
[20]
dose
(3600ofIU/day)
200000 on
IU)
Vit D3 +
Hollis, 2011 [21] USA micronutrients Placebo 122/111 24-28 Birthweight
(1600 IU/day)Nutrients 2019, 11, 442 6 of 16
Table 1. Cont.
Size of Treatment
First Author, Treatment (Vitamin CONTROL
Country Intervention/ Duration Outcomes
Year D Dosage) GROUP
Control Groups (Week)
Hossain, Vit D3 (4000 No Birthweight, birth length,
Pakistan 86/89 16
2014 [22] IU/day) intervention head circumference, SGA
Marya, 1988 Vit D3 (two doses of No
India 100/100 12 Birthweight, birth length
[23] 600000 IU) intervention
Naghshineh, No
Iran Vit D (600 IU/day) 68/70 20 Birthweight
2016 [24] intervention
Roth, 2013 Vit D3 (35,000 Birthweight, birth length,
Bangladesh Placebo 80/80 12
[25] IU/week) head circumference
Sabet, 2012 Vit D3 (100000
Iran Placebo 25/25 12 Birthweight, birth length
[26] IU/mol)
Vit D3
(single-intermitted
Sablok, 2015 No
India dose depending 108/57 16 Birthweight, SGA
[27] intervention
upon the serum
25OHD levels)
Vit D2 (800 IU/d) No 60/59
UK 13 LBW, SGA
Yu, 2009 [28] Vit D2 (single dose intervention
60/59
of 200000 IU)
Abbreviations: Ca, Calcium; IU, International Unit; 25-OHD, 25-hydroxyvitamin D; LBW, low birth weight; SGA,
small for gestational age; NA, not available.
3.2. Systematic Review
A total of 8 studies were from Asian countries, 4 from European countries, and 1 from USA.
Accordingly, the latitude of the setting was the Northern tropic in all the included studies. To avoid
confounding due to seasonal variation in sunlight exposure, 6 RCTs were carried out in different
seasons [14,18,22,24,26,27]. Otherwise, the seasons varied from winter [19] to spring-summer
period [13,20,25,28]; this information was not available for 2 RCTs [21,23]. Overall, sample sizes
ranged between 40 and 400 pregnant women, and neonatal outcomes of 2016 newborns were reported:
1184 from mothers in the intervention groups and 832 from controls. All the eligible studies were
carried out using an individual randomization. Intervention groups were characterized by vitamin
D2 (n = 4) or D3 (n = 10) supplementation alone (n = 12) or in combination with calcium (n = 2) or
other micronutrients (n = 3). Two trials did not report the vitamin D form used in 3 intervention
groups [19,24]. The duration of vitamin D intervention was 6–28 weeks of gestation. Women
in 11 intervention groups were supplemented with daily dose of vitamin D, whereas subjects in
the remaining 6 intervention groups were supplemented with single-intermitted high dose. The
daily dose ranged from 200 IU to 4000 IU; among single-intermitted interventions, the high dose
varied from 35000 IU to 600000 IU. Control groups included patients who received placebo (n = 8)
or no treatment (n = 5). In those studies evaluating the effect of vitamin D supplementation on
25-hydroxyvitamin D levels, the intervention significantly increased 25-OHD concentration in both
mothers [13,14,18,21–23,25–28] and infants [21,22,25–28]. Although 3 RCTs suggested that women
who received vitamin D supplementation during pregnancy had a lower risk of preterm birth than
controls [13,24,27], in other trials the intervention did not affect gestational age [13,14,20–22,24] and
preterm birth risk [14,19,22].
3.3. Meta-Analysis
3.3.1. Birthweight
The effect of vitamin D supplementation on birthweight was assessed by 12 RCTs [13,14,18–27] and
15 group comparisons. Compared to controls, birthweight was significantly higher in the intervention
groups (MD: 103.17 g, 95% CI 62.29–144.04 g; p < 0.001). Q-test and I2 statistics showed no significant
heterogeneity across studies (p > 0.1; I2 = 7.0%). Particularly, vitamin D supplementation alone,
but not in combination with other micronutrients, significantly increased birthweight (MD: 118.46 g,Nutrients 2018, 10, x FOR PEER REVIEW 7 of 16
intervention
Nutrients 2019, groups
11, 442 (MD: 103.17 g, 95% CI 62.29–144.04 g; p < 0.001). Q-test and I2 statistics showed 7 of 16
no significant heterogeneity across studies (p > 0.1; I2 = 7.0%). Particularly, vitamin D
supplementation alone, but not in combination with other micronutrients, significantly increased
95%
birthweight (MD: 118.46g,g,p95%
CI 70.47–166.45 < 0.001; MD: 62.76
CI 70.47–166.45 g, pg, 95% CI
< 0.001; MD:−62.76
15.24–140.77
g, 95% CI g, p = 0.520, g,respectively)
−15.24–140.77 p=
(Figure
0.520, respectively) (Figure 2). The effect of vitamin D in combination with otherremained
2). The effect of vitamin D in combination with other micronutrients no significant
micronutrients
also after no
remained thesignificant
omissionalsoof studies
after thewith daily
omission of vitamin D dose
studies with dailyof 200 IUD[13,14]
vitamin dose of(MD:
200 IU49.30 g, 95% CI
[13,14]
−(MD: 49.30 g, 95%
43.52–142.11 g, CI
p=−43.52–142.11 g, p = 0.300).
0.300). Particularly, Particularly, meta-regression
meta-regression did not revealdid not reveal a dose-
a dose-dependent effect
dependent
of vitamineffect of vitamin D supplementation
D supplementation alone on birthweight
alone on birthweight (p = 0.773).
(p = 0.773). SubgroupSubgroup analysis
analysis by regimen
by regimen
showed thatshowed that both
both daily anddaily and single-intermitted
single-intermitted high supplementation
high dose dose supplementation significantlyincreased
significantly
increased birthweight (MD: 74.66 g, 95% CI 18.80–130.52 g, p < 0.001; MD: 136.02 g, 95% CI 76.05–
birthweight (MD: 74.66 g, 95% CI 18.80–130.52 g, p < 0.001; MD: 136.02 g, 95% CI 76.05–195.98 g,
195.98 g, p < 0.001, respectively).
p < 0.001, respectively).
Figure 2.
Figure 2. Forest
Forest plot
plotofofthethe
effect of vitamin
effect D intervention
of vitamin alonealone
D intervention or in or
combination with micronutrients
in combination with
on birthweighton(g),
micronutrients based on(g),
birthweight thebased
fixed-effects model. Charandabi
on the fixed-effects 2015 (a):2015
model. Charandabi Vit D
(a):+Vit
CaD(1000
+ Ca IU/day);
Charandabi
(1000 IU/day);2015 (b): Vit D
Charandabi (1000
2015 (b):IU/day); Goldring
Vit D (1000 2013
IU/day); (a): Vit2013
Goldring D2 (800 IU/day);
(a): Vit D2 (800Goldring
IU/day); 2013 (b):
Vit D3 (single
Goldring dose
2013 (b): VitofD3
200000
(singleIU);
doseHollis 2011 IU);
of 200000 (a): Hollis
Vit D32011
+ micronutrients (1600 IU/day);
(a): Vit D3 + micronutrients Hollis 2011
(1600
IU/day); Hollis 2011 (b): Vit D3 + micronutrients
(b): Vit D3 + micronutrients (3600 IU/day). (3600 IU/day).
3.3.2. BirthLength
3.3.2. Birth Length
The
The effect
effectof ofvitamin
vitaminD supplementation
D supplementation on birthonlength birthwaslength
assessedwasby assessed
7 RCTs by 7
[13,18,19,22,23,25,26] and 8 group comparisons. The Q-test and I2 statistics
RCTs [13,18,19,22,23,25,26] and 8 group comparisons. The Q-test and I2 statistics showed showed significant
heterogeneity
significant across studiesacross
heterogeneity (p < 0.001; I2 = (p
studies 75.2%). Based
< 0.001; I2 on the random
= 75.2%). Basedeffect
onmodel, birth length
the random effect model,
was significantly higher in the intervention groups than in controls (MD: 0.50 cm, 95% CI 0.08–0.92
birth length was significantly higher in the intervention groups than in controls (MD: 0.50 cm,
cm; p = 0.020). Moreover, we performed a leave-one-out sensitivity analysis to investigate the sources
95% CI 0.08–0.92 cm; p = 0.020). Moreover, we performed a leave-one-out sensitivity analysis to
of heterogeneity across studies. The sensitivity analysis found that the study by Marya et al. [23]
investigate the sources of heterogeneity across studies. The sensitivity analysis found that the study
affected the heterogeneity across studies. When this study was omitted, the between-studies
by
heterogeneity al.
Marya et [23] affected
decreased the
(p > 0.1; I2 heterogeneity
= 0.0%) and birth across
length studies.
remained When this study
significantly wasinomitted,
higher the the
between-studies heterogeneity decreased (p > 0.1; I2 = 0.0%) and birth length
intervention groups than in controls (MD: 0.22 cm, 95% CI 0.10–0.34 cm; p < 0.001). Meta-regressionremained significantly
higher in theaintervention
did not reveal dose-dependent groups
effect than in controls
of vitamin (MD: 0.22 alone
D supplementation cm, 95% CI 0.10–0.34
on birth length (p = cm; p < 0.001).
0.895).
Meta-regression
Subgroup analysisdid by not reveal a showed
formulation dose-dependent
that vitamin effect of vitamin D supplementation
D supplementation alone, but not inalone on
combination
birth with
length (p other micronutrients,
= 0.895). Subgroup analysis significantly increased showed
by formulation birth length
that(MD: 0.22 D
vitamin cm, 95% CI
supplementation
0.10–0.34 cm, p < 0.001; MD: 0.21 cm, 95% CI −0.49–0.92 cm, p = 0.700, respectively)
alone, but not in combination with other micronutrients, significantly increased birth length (Figure 3). (MD:
0.22 cm, 95% CI 0.10–0.34 cm, p < 0.001; MD: 0.21 cm, 95% CI −0.49–0.92 cm, p = 0.700, respectively)
(Figure 3). Subgroup analysis by regimen showed that both daily and single-intermitted high dose
supplementation significantly increased birth length (MD: 0.20 cm, 95% CI 0.08–0.32 cm; p = 0.001;
MD: 0.50 cm, 95% CI 0.02–0.97 cm; p = 0.041, respectively).supplementation significantly increased birth length (MD: 0.20 cm, 95% CI 0.08–0.32 cm; p = 0.001;
Nutrients 2018, 10, x FOR PEER REVIEW 8 of 16
MD: 0.50 cm, 95% CI 0.02–0.97 cm; p = 0.041, respectively).
Subgroup analysis by regimen showed that both daily and single-intermitted high dose
supplementation significantly increased birth length (MD: 0.20 cm, 95% CI 0.08–0.32 cm; p = 0.001;
MD: 0.50
Nutrients 2019,cm, 95% CI 0.02–0.97 cm; p = 0.041, respectively).
11, 442 8 of 16
Figure 3. Forest plot of the effect of vitamin D intervention alone or in combination with
micronutrients
Figure 3. Forest on birth
plot length
of the effect(cm), based D
of vitamin onintervention
the fixed-effects
alonemodel. Charandabiwith
or in combination 2015micronutrients
(a): Vit D + Ca
Figure
(1000 3. Forest
IU/day); plot of 2015
Charandabi the effect
(b): ofDvitamin
Vit (1000 D intervention alone or in combination with
IU/day).
on birth length (cm), based on the fixed-effects model. Charandabi 2015 (a): Vit D + Ca (1000 IU/day);
micronutrients on birth length (cm), based on the fixed-effects model. Charandabi 2015 (a): Vit D + Ca
Charandabi 2015 (b): Vit D (1000 IU/day).
(1000 IU/day); Charandabi 2015 (b): Vit D (1000 IU/day).
3.3.3. Head Circumference
3.3.3. Head Circumference
TheHead
3.3.3. effect of vitamin D supplementation on head circumference was assessed by 6 RCTs
Circumference
The effect
[13,14,18,19,22,25] of vitamin
The effect ofand
vitamin
7 group D comparisons.
supplementation
D supplementation
on head
Compared
on
circumference
to controls,
head circumference washead
assessed
wasby assessed
circumference
6 RCTs was
by
6significantly
RCTs [13,14,18,19,22,25]
greater in theand 7 group
intervention comparisons.
groups (MD: Compared
0.19 cm, to
95% controls,
[13,14,18,19,22,25] and 7 group comparisons. Compared to controls, head circumference wasCI head
0.13–0.24 circumference
cm; p < 0.001). was
Q-test
significantly
and greater
I2 statistics
significantly showed
greater ininthenointervention
the groups(MD:
significant heterogeneity
intervention groups (MD:0.190.19 cm,95%
across
cm, 95% CICI
studies (p0.13–0.24I2 cm;
> 0.1;cm;
0.13–0.24 p < 0.001).
=p 2.0%).
< 0.001). Q-testQ-test
Particularly,
and I2 statistics
vitamin
and I2D showed
showedno
supplementation
statistics nosignificant heterogeneity
alone, butheterogeneity
significant not in combination across
across studies
with
studies (p >(p0.1;
other >micronutrients,
0.1;
I2 =I2 = 2.0%).
2.0%). Particularly,
significantly
Particularly,
vitamin
increased
vitamin D head
supplementation
D circumference
supplementation alone,
(MD:but
alone, 0.19 not
notcm,in95%
in combination
CI 0.14–0.25
combination with
with cm,other
other < micronutrients,
pmicronutrients,
0.001; MD: −0.06 significantly
cm, 95% CI
significantly
increased
increased
−0.41–0.28head head circumference
cm, pcircumference (MD: 0.19
(MD: 0.19
= 0.720, respectively; cm, 95%
cm, 95%
Figure CI 0.14–0.25 cm,
CI 0.14–0.25 cm, did
4). Meta-regression p < 0.001;
p < 0.001;MD:MD: −
not reveal−0.06 cm,
a 0.06 95% CI CI
cm, 95%
dose-dependent
− −0.41–0.28
0.41–0.28
effect cm,
cm,
of vitamin p =pD0.720,
=supplementation
0.720, respectively;Figure
respectively; Figure
alone 4).4).
on Meta-regression
Meta-regression
head circumference didnot
did (pnot reveala aSubgroup
=reveal
0.746). dose-dependent
dose-dependent effect
analysis by
of effect
vitamin of vitamin
D D supplementation
supplementation alone onalone
head on head circumference
circumference (p = (p =
0.746).
regimen showed that daily maternal vitamin D supplementation significantly increased head 0.746). Subgroup
Subgroup analysis
analysis by by
regimen
regimen thatshowed that daily maternal vitamin D supplementation
showed
circumference daily
(MD: maternal
0.19 cm, vitamin
95%DCI supplementation p < 0.001).significantly
0.14–0.24 cm; significantly increased
Regardingheadincreased head
circumference
single-intermitted
circumference (MD: 0.19 cm, 95% CI 0.14–0.24 cm; p < 0.001). Regarding single-intermitted
(MD: 0.19 cm,Roth
intervention, 95% et CIal.
0.14–0.24
reported nopsignificant
cm; < 0.001). Regarding
effect [25].single-intermitted intervention, Roth et al.
intervention, Roth et al. reported no significant effect [25].
reported no significant effect [25].
Figure 4. Forest plot of the effect of vitamin D intervention alone or in combination with micronutrients
on head circumference (cm), based on the fixed-effects model. Charandabi 2015 (a): Vit D + Ca
(1000 IU/day); Charandabi 2015 (b): Vit D (1000 IU/day).
3.3.4. Low Birthweight
The effect of vitamin D supplementation on incidence of LBW was assessed by 3 RCTs [14,18,28]
and 4 group comparisons. Compared to control groups, the risk of LBW newborns was lower in themicronutrients on head circumference (cm), based on the fixed-effects model. Charandabi 2015 (a):
3.3.4. Low Vit
Birthweight
D + Ca (1000 IU/day); Charandabi 2015 (b): Vit D (1000 IU/day).
The effect of vitamin D supplementation on incidence of LBW was assessed by 3 RCTs [14,18,28]
3.3.4. Low Birthweight
and 4 group comparisons. Compared to control groups, the risk of LBW newborns was lower in the
intervention The
Nutrients groups
effect
2019, (RR = 0.40, D
of vitamin
11, 442 95% CI 0.22–0.74; p on
supplementation = 0.003) (Figure
incidence 5). Interestingly,
of LBW was assessedthe byomission of9 of 16
3 RCTs [14,18,28]
the study
and by Brough
4 group [14], showed
comparisons. that women
Compared supplemented
to control groups, with vitamin
the risk of LBW D alone had awas
newborns lower risk in the
lower
of LBW than controls
intervention (RR (RR
groups = 0.47, 95%95%
= 0.40, CI 0.23–0.97; p = 0.040).
CI 0.22–0.74; p = 0.003)In contrast,
(Figure 5). Brough et al. reported
Interestingly, no
the omission of
intervention
significant groups
effectbyofBrough
the study (RR
vitamin = 0.40,
D showed
[14], 95% CI
supplementation0.22–0.74;
that women with p = 0.003) (Figure
micronutrients
supplemented 5).
with[14]. Interestingly,
Q-test
vitamin the
and I2had
D alone omission
statistics
a lower risk of
showedthe study
of no
LBW by Brough
significant
than controls[14],
(RRshowed
heterogeneity that
95%women
across
= 0.47, studies supplemented
(p > 0.1;
CI 0.23–0.97; p =I20.040).with
= 0%). vitaminanalysis
Subgroup
In contrast, D alone et
Brough had
by areported
lower risk
regimen
al. no
showedof LBW than controls
that dailyeffect
significant maternal (RR = 0.47, 95% CI 0.23–0.97;
vitaminDDsupplementation
of vitamin supplementation with p = 0.040).
significantly In contrast,
reduced[14].
micronutrients Brough
the risk et al.
of LBW
Q-test and I2reported no
(RRstatistics
=
0.40, significant
95%
showed effect
CI 0.21–0.78;
no of vitamin
significant D supplementation
p = 0.007). Regarding
heterogeneity with micronutrients
single-intermitted
across studies (p > 0.1;intervention,
I2 = 0%). Q-test
[14]. Subgroup
Yu and I2reported
et al. statistics
analysis by showed
no
regimen
no significant
significant
showedeffect
that heterogeneity
[28].
daily maternalacross
vitamin studies (p > 0.1; I2 = 0%).
D supplementation Subgroupreduced
significantly analysisthe by risk
regimenof LBW showed
(RR =
that daily maternal vitamin D supplementation significantly reduced the
0.40, 95% CI 0.21–0.78; p = 0.007). Regarding single-intermitted intervention, Yu et al. reportedrisk of LBW (RR = 0.40,
no
95% CI 0.21–0.78; p =
significant effect [28]. 0.007). Regarding single-intermitted intervention, Yu et al. reported no significant
effect [28].
Figure 5. Forest plot of the effect of vitamin D intervention on the risk of low birthweight, based on
the fixed-effects model. Yu 2009 (a): Vit D2 (800 IU/day); Yu 2009 (b): Vit D2 (single dose of 200000
Figure5.5.Forest
IU). Figure Forestplot
plotofof
the effect
the of of
effect vitamin D intervention
vitamin on the
D intervention riskrisk
on the of low birthweight,
of low based
birthweight, on the
based on
fixed-effects model. Yu 2009 (a): Vit D2 (800 IU/day); Yu 2009 (b): Vit D2 (single dose of 200000
the fixed-effects model. Yu 2009 (a): Vit D2 (800 IU/day); Yu 2009 (b): Vit D2 (single dose of 200000 IU).
3.3.5.3.3.5.
SmallSmall
for Gestational
IU). Age Age
for Gestational
The Theeffect effect
of vitamin D supplementation
of vitamin on incidence of SGA was assessed by 5 RCTs
3.3.5. Small for Gestational AgeD supplementation on incidence of SGA was assessed by
[14,18,22,27,28] and 6 group comparisons.
5 RCTs [14,18,22,27,28] Compared to control
and 6 group comparisons. Comparedgroups,to the risk of
control SGA was
groups, thelower
risk of in SGA
the intervention
The groups
effect of(RR = 0.69,
vitamin 95%
D CI 0.51–0.92;
supplementation p = 0.018)
on (Figure
incidence 6).
of Interestingly,
SGA was
was lower in the intervention groups (RR = 0.69, 95% CI 0.51–0.92; p = 0.018) (Figure 6). Interestingly, the
assessed omission
by 5 RCTs
of thethe
study by Brough
[14,18,22,27,28]
omission of the [14],
andstudy showed
6 group that women
comparisons.
by Brough supplemented
Compared
[14], showed thattowomen with vitamin
controlsupplemented D
groups, the riskalone had
of SGA
with a
vitamin lower
wasD lower
alonein
risk of SGA
the than controls
intervention groups(RR =
(RR0.70,
= 95%
0.69, CI
95% 0.47–0.97;
CI p
0.51–0.92; = 0.047).
p = In
0.018) contrast,
(Figure Brough
6). et al.
Interestingly,
had a lower risk of SGA than controls (RR = 0.70, 95% CI 0.47–0.97; p = 0.047). In contrast, Brough et al. reported
the omission
no significant
reported effect
of the study
no byofBrough
vitamin
significant D supplementation
[14],
effect showed
of vitamin that womenwith supplemented
micronutrients
D supplementation [14].vitamin
with Q-test and
with micronutrients I2 statistics
D[14].
alone had aand
Q-test lower
I2
showed risknoofsignificant
SGA than heterogeneity
controls (RR across
= 0.70, studies
95% CI (p > 0.1; I2
0.47–0.97; =p16.2%).
= Meta-regression
0.047). In contrast,
statistics showed no significant heterogeneity across studies (p > 0.1; I2 = 16.2%). Meta-regression did did
Brough notet reveal
al. reported
a dose-dependent
no reveal
not significant effect
effectofof
a dose-dependent vitamin
vitamin DD
effect supplementation
supplementation
of alone
withon
vitamin D supplementation SGA alone
(p = 0.903).
micronutrients on [14].
SGASubgroup
Q-test andanalysis
(p = 0.903). I2 statistics
Subgroup
by regimen
showed demonstrated
no significant that both daily
heterogeneity and
acrosssingle-intermitted
studies (p > 0.1; dose
I2 = significantly
16.2%). reduced
Meta-regression
analysis by regimen demonstrated that both daily and single-intermitted dose significantly reduced the
did risk
not reveal
of SGA (RR
risk=of0.73,
a dose-dependent
the SGA 95%
(RRCI = 0.51–0.98;
effect
0.73,of95% p =0.51–0.98;
vitamin
CI 0.042; RR p= =0.58,
D supplementation 95%
0.042; RRCI =0.32–0.99;
alone on95%
0.58, SGApCI= 0.32–0.99;
(p 0.048).
= 0.903). Subgroup
p = 0.048).analysis
by regimen demonstrated that both daily and single-intermitted dose significantly reduced the risk
of SGA (RR = 0.73, 95% CI 0.51–0.98; p = 0.042; RR = 0.58, 95% CI 0.32–0.99; p = 0.048).
Figure 6. Forest plot of the effect of vitamin D intervention on the risk of small for gestational age,
Figure 6. Forest
based on theplot of the effect
fixed-effects of vitamin
model. D (a):
Yu 2009 intervention onIU/day);
Vit D2 (800 the risk Yu
of small for Vit
2009 (b): gestational age,
D2 (single dose of
based200000
on the IU).
fixed-effects model. Yu 2009 (a): Vit D2 (800 IU/day); Yu 2009 (b): Vit D2 (single dose of
200000Figure
IU). 6. Forest plot of the effect of vitamin D intervention on the risk of small for gestational age,
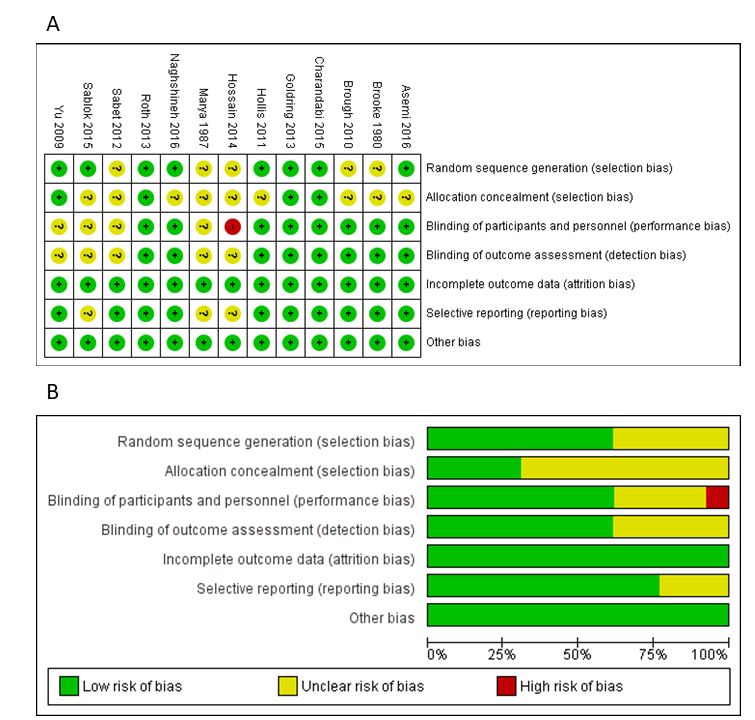
3.4. Risk-of-Bias and Quality Assessment
based on the fixed-effects model. Yu 2009 (a): Vit D2 (800 IU/day); Yu 2009 (b): Vit D2 (single dose of
200000 IU). assessment was shown in Figure 7. Overall, we identified low risk of attrition and
Risk-of-bias
other biases; however, unclear and/or high risk of selection, performance, detection, and reporting
biases cannot be excluded. Overall, the quality of evidence varied from very low (head circumference)
to moderate (birthweight, birth length, LBW, and SGA). The main reasons for downgrading the quality
of evidence were the risk of bias of RCTs (i.e., high risk of bias for blinding) and the imprecision (i.e.,
low sample size and/or number of events which resulted in wide 95% CI). Full details of risk-of-bias
and quality assessment are included in Supplementary Materials.biases cannot be excluded. Overall, the quality of evidence varied from very low (head
circumference) to moderate (birthweight, birth length, LBW, and SGA). The main reasons for
downgrading the quality of evidence were the risk of bias of RCTs (i.e., high risk of bias for blinding)
and the imprecision (i.e., low sample size and/or number of events which resulted in wide 95%CI).
Nutrients
Full of11,
2019,
details 442
risk-of-bias and quality assessment are included in Supplementary Materials. 10 of 16
Figure7.7.
Figure Risk-of-bias
Risk-of-bias assessment
assessment of randomized
of randomized controlled
controlled trials trials included
included in the meta-analysis.
in the meta-analysis. Risk-
Risk-of-bias
of-bias summarysummary
(A) and(A) and graph
graph (B), according
(B), according to the to the Cochrane’s
Cochrane’s Collaboration
Collaboration tool
tool for for assessing
assessing risk
risk of bias in randomized
of bias in randomized trials. trials.
3.5. Publication Bias
3.5. Publication Bias
The funnel plot of the effect of vitamin D supplementation on birthweight appeared symmetric
The funnel plot of the effect of vitamin D supplementation on birthweight appeared symmetric
(Figure 8). Accordingly, Begg’s rank correlation method and Egger’s weighted regression method
(Figure 8). Accordingly, Begg's rank correlation method and Egger's weighted regression method
showed no sources of publication bias (p-values > 0.05). Regarding other outcomes, due to the limited
showed no sources of publication bias (p-values > 0.05). Regarding other outcomes, due to the limited
number of studies, the extent of publication biases cannot be excluded because the power of the tests
number of studies, the extent of publication biases cannot be excluded because the power of the tests
for funnel plot asymmetry was too low to identify a real asymmetry [10].
for funnel plot asymmetry was too low to identify a real asymmetry [10].Nutrients 2019, 11, 442 11 of 16
Nutrients 2018, 10, x FOR PEER REVIEW 11 of 16
Figure 8. Funnel plot with estimated 95% confidence intervals for meta-analysis of the effect of vitamin
Figure 8. Funnel plot with estimated 95% confidence intervals for meta-analysis of the effect of
D intervention on birthweight.
vitamin D intervention on birthweight.
4. Discussion
4. Discussion
When interpreting findings about the effect of maternal vitamin D supplementation on birth size,
Whenininterpreting
differences study designfindingsand typeabout the effect should
of intervention of maternal vitamin DTosupplementation
be considered. reduce heterogeneity, on birth
we
size, differences
limited our analysisin studyofdesign
to RCTs pregnant andwomentype without
of intervention
pregnancyshould be considered.
complications, To reduce
with randomization
atheterogeneity,
either individual weor limited our We
cluster level. analysis
excluded to observational
RCTs of pregnant women trials,
studies, cross-over without pregnancy
or quasi-RCTs.
complications, with randomization at either individual or cluster
Moreover, to demonstrate whether alternative formulations and/or regimens had different effect on level. We excluded observational
studies,
birth size,cross-over
we performed trials,subgroup
or quasi-RCTs.
analyses.Moreover,
Overall, to we
demonstrate
comparedwhether the effect alternative formulations
of oral vitamin D (D2
or D3 form) supplementation, alone or in combination with other micronutrients, with placebo we
and/or regimens had different effect on birth size, we performed subgroup analyses. Overall, or
compared
no treatment. the Most
effect of oral vitamin D (D2provided
the interventions or D3 form) supplementation,
daily alone or in combination
vitamin supplementation, and to a lesser with
other intermitted
extent micronutrients, withhigh
or single placebo or no
doses. To treatment. Most of the interventions
date, the recommended dose of vitamin provided daily vitamin
D supplementation,
supplementation,
during pregnancy and to a lesser extent intermitted or single high doses.
lactation, is 600 IU per day [6]. This recommendation, based on outcomes To date, the recommended
dose oftovitamin
related skeletalDhealth,
supplementation,
was proposed during
as thepregnancy
amount of and lactation,
vitamin D toismaintain
600 IU per blooddaylevels
[6]. This
of
recommendation,
25(OH)D above 50 basednmol/L on[29].
outcomes
However, related to skeletal
several lines of health,
evidence was proposed
argued as the amount
that deficiency should of
vitamin D to maintain blood levels of 25(OH)D above 50 nmol/L
be defined at thresholds of 75 nmol/L or higher [30–34]. The majority of RCTs included in our work [29]. However, several lines of
evidence argued
evaluated that deficiency
the benefits should be defined
of a supplementation greateratthan thresholds
600 IUofper 75 day.
nmol/L Theordaily
higher [30–34].
doses rangedThe
majority of RCTs included in our work evaluated the benefits of a
from 200 IU to 4000 IU while, among high single-intermitted interventions, the doses varied from supplementation greater than 600
IU per day. The daily doses ranged from 200 IU to 4000 IU while,
35000 IU to 600000 IU. During pregnancy, the tolerable upper intake level of vitamin D is now set at among high single-intermitted
interventions,
4000 the doses
IU/day, although thevaried
adversefrom 35000
effects IU to 600000
of higher levels areIU. uncertain
During pregnancy, the tolerable
[30]. As suggested upper
by several
intake level of vitamin D is now set at 4000 IU/day, although the adverse
RCTs included in the present systematic review, interventions which reached or exceed the tolerable effects of higher levels are
uncertain
upper intake[30]. As suggested
level did not manifestby several RCTseffects
adverse included in the present systematic
[20,22,23,25,26,28]. However,review, interventions
due to inconclusive
which reached
evidence, monitoring or exceed
of toxicitytheand tolerable
potential upper
adverse intake
effectslevel did intermittent
of high not manifest adverse
dosages should effects
be
[20,22,23,25,26,28]. However, due
an important consideration in RCTs design [30]. to inconclusive evidence, monitoring of toxicity and potential
adverse effects ofadd
Our findings high to intermittent
the growing dosages should be
body of evidence an important
about the effect of consideration in RCTs design
vitamin D supplementation
[30].
on neonatal anthropometric measures and incidence of LBW and SGA births. Compared to previous
Our findings
meta-analyses [5,8],addourtowork
the growing
summarized body data
of evidence
from 13about RCTs,the effect of vitamin
published until May D supplementation
2017, providing
aon neonatal
larger number anthropometric measures and
of group comparisons for incidence
each outcome of LBW and SGAWe
of interest. births. Compared
confirmed that to previous
vitamin D
meta-analyses [5,8], our work summarized data from 13 RCTs, published
supplementation alone, but not in combination with other micronutrients, significantly increased until May 2017, providing
a larger number
birthweight, birthoflength,
groupand comparisons for each outcome
head circumference. Compared of interest.
to the We mostconfirmed that vitaminofD
recent meta-analysis
supplementation
RCTs by Perez-Lopez alone, but[5],
et al. notwe in also
combination
showed that with newborns
other micronutrients,
from womensignificantly
supplemented increased
with
birthweight, birth length, and head circumference. Compared to
vitamin D alone had a lower risk of LBW. This evidence was consistent with four trials included the most recent meta-analysis of
RCTs
in by Perez-Lopez
the recent systematicet al. [5],bywe
review also showed
De-Regil et al. [7]thatand newborns from women
pooled results supplemented
by Thorne-Lyman et al.with
[8].
vitamin D alone had a lower risk of LBW. This evidence was consistent
Although birthweight and length are the most used indicators for the assessment of intrauterine with four trials included in
the recent systematic review by De-Regil et al. [7] and pooled results
growth, the evaluation of weight distribution at birth is more adequate when it is adjusted for by Thorne-Lyman et al. [8].
Although birthweight and length are the most used indicators for the assessment of intrauterine
growth, the evaluation of weight distribution at birth is more adequate when it is adjusted forNutrients 2019, 11, 442 12 of 16
gestational age. Accordingly, the reduction of LBW is not the best goal of intervention of RCTs, because
it does not distinguish between suboptimal fetal growth and shortened gestation [35]. Evidence
about the effect of vitamin D supplementation on gestational age and preterm birth is controversial;
De-Regil et al. reported that vitamin D supplementation alone may reduce the risk of preterm birth,
while the combined supplementation with calcium increased the risk [7]. Findings from RCTs
included in the present study suggested that women who received vitamin D supplementation
alone [24,27] or in combination with calcium [13] had a lower risk of preterm birth. However,
in other RCTs the intervention did not affect gestational age [13,14,20–22,24] and preterm birth
incidence [14,19,22]. To our knowledge, the present study is the first demonstrating that maternal
vitamin D supplementation alone significantly reduced the risk of SGA births, defined as birthweight
below the 10th percentile for sex and gestational age. SGA newborns show a higher risk of neonatal
and infant mortality, childhood malnutrition, neurocognitive disorders, and adulthood metabolic
diseases [36]. Subgroup analysis by regimen showed that both daily and high single-intermitted
dose significantly increased birthweight and length, reducing the risk of SGA births. In fact, the
fat-soluble properties of vitamin D allow the single-intermitted dosage during pregnancy, which may
be a feasible strategy against adverse neonatal outcomes in low income countries with poor health
infrastructures [8].
Since we included studies with different interventions, we assessed the dose-dependent effect of
vitamin D supplementation on birth size. For this purpose, we performed meta-regression analyses
of those outcomes with at least three studies evaluating daily vitamin D supplementation alone.
By contrast, heterogeneity in formulation, dose, duration, and timing of supplementation, did not
allow us to perform meta-regression of studies with single supplementation and/or combination of
supplements. However, our analysis did not reveal a dose-dependent effect of vitamin D on birth sizes,
probably due to the limited number of studies. Moreover, very few studies investigated the effect of
vitamin D supplementation with other micronutrients, and hence we were not able to understand
whether the combination with other supplements might affect the efficacy of intervention. Although
single and combination interventions were based on similar vitamin D doses, we cannot exclude an
antagonistic effect of other micronutrients. Given these limitations, further research is needed to assess
the dose-dependent effect of vitamin D alone or in combination with other micronutrients.
The positive effect of maternal vitamin D supplementation on birth size and risk of LBW
and SGA might be mediated by changes in fetal cell mass and function, skeletal mineralization,
and metabolism [37]. Moreover, maternal serum vitamin D insufficiency is associated with an
increased risk of preterm birth [38–40]. The main role of vitamin D in the human body is to maintain
adequate levels of calcium and phosphate, enabling the critical processes of bone mineralization and
development during fetal life [37]. In many fetal tissues, the active form of vitamin D binds to the
vitamin D receptors, regulating genes responsible for the proper implantation of the placenta [41],
which is important for fetal growth. Moreover, vitamin D could influence the maternal immune
response to the placenta [42] and the expression of human chorionic gonadotropin and sex steroids [43].
Some experimental studies have also proposed the role of vitamin D in glucose and insulin metabolism,
affecting availability of energy to the fetus [44], as well as its influence on musculoskeletal growth [45].
Potential weaknesses of our work include the limited number of databases searched. According to
selection criteria, some data, such as conference abstracts and/or unpublished reports, were excluded.
Our reluctance to include unpublished results is based on: (i) the absence of peer-review of unpublished
literature; (ii) the studies that can be located may be an unrepresentative sample of all unpublished
studies; (iii) unpublished studies may be of lower methodological quality than published studies [10].
To address publication biases, we visually assessed funnel plot asymmetry followed by Begg’s test
and Egger’s regression asymmetry test. However, in those outcomes with less than 10 intervention
groups, the extent of publication bias cannot be completely excluded. Beyond potential reporting and
publication biases, we assessed an unclear risk of bias for random sequence generation, allocation
concealment, selective reporting and blinding (i.e., absence of blinding should be considered whenNutrients 2019, 11, 442 13 of 16
interpreting results by Hossain et al. [22]). Accordingly, the quality of evidence varied from very low
to moderate. The main reasons for downgrading the quality of evidence were the high risk of bias for
blinding and the low sample size, which resulted in wide 95% CI. We also recognize that including
more group comparisons could have the potential of overestimating or underestimating the effect of
vitamin D supplementation. To solve this issue, where possible, we performed subgroup analyses
that classified group comparison into different subgroups, whenever possible. Another weakness
is the potential effect of confounders. To control for factors that could contribute to the effect of
vitamin D supplementation on birth size, RCTs should be based on more standardized protocols [46]:
dosage for vitamin D supplementation should be chosen upon the maternal serum 25OHD levels at
baseline [8], as performed by Sablok et al. [27], and such trials should take into account risk factors for
vitamin D deficiency (i.e., genetic factors, latitude, lifestyles, dietary intake and seasonality) [47–49].
To avoid confounding due to seasonal variation in sunlight exposure, several RCTs were carried out
in different seasons [14,18,22,24,26,27]. Taking into account the abovementioned limitations, further
research and large multicenter RCTs, evaluating the effect of genetic, environmental, sociodemographic,
and life-style factors, is needed.
5. Conclusions
Despite growing interest in the relationship between vitamin D supplementation and pregnancy
outcomes, previous evidence about the effect on birth size remained weak. Findings from these
systematic review and meta-analysis confirm vitamin D as an essential nutrient for fetal growth and
development, with well-established effects on birth size. Moreover, to our knowledge, this work
represents the first meta-analysis of RCTs which demonstrates a significant positive effect of maternal
vitamin D supplementation on the risk of SGA births. However, further RCTs of vitamin D
supplementation during pregnancy are required to better define risks and benefits associated
with such interventions and the potential implication as a feasible strategy to prevent adverse
pregnancy outcomes.
Supplementary Materials: The following are available online at http://www.mdpi.com/2072-6643/11/2/442/s1,
S1: Prisma 2009 Checklist, S2: Search strategy used for PubMed and Cochrane Central Register of Controlled
Trials databases, S3: Search strategy used for EMBASE database, S4: Full details of risk of bias assessment,
S4: Assessment of the quality of the evidence using the GRADE approach.
Author Contributions: Conceptualization, A.A.; methodology, A.M., M.B., and I.B.; formal analysis, A.M., M.B.,
and I.B.; data curation, A.M., M.B., and I.B.; writing—original draft preparation, A.M., M.B., I.B., and A.A.;
writing—review and editing, A.M., M.B., I.B., and A.A.; supervision, A.A.
Funding: A.M., M.B., and A.A were partially funded by the Department of Medical and Surgical Sciences and
Advanced Technologies “GF Ingrassia”, University of Catania (Piano Triennale di Sviluppo delle Attività di
Ricerca Scientifica del Dipartimento–2016–2018).
Conflicts of Interest: The authors declare no conflict of interest.
References
1. Ramakrishnan, U.; Grant, F.; Goldenberg, T.; Zongrone, A.; Martorell, R. Effect of women’s nutrition before
and during early pregnancy on maternal and infant outcomes: A systematic review. Paediatr. Perinat.
Epidemiol. 2012, 26 (Suppl. 1), 285–301. [CrossRef] [PubMed]
2. Agodi, A.; Barchitta, M.; Valenti, G.; Marzagalli, R.; Frontini, V.; Marchese, A.E. Increase in the prevalence of
the MTHFR 677 TT polymorphism in women born since 1959: Potential implications for folate requirements.
Eur. J. Clin. Nutr. 2011, 65, 1302–1308. [CrossRef] [PubMed]
3. Holick, M.F. Vitamin D: A d-lightful solution for health. J. Investig. Med. 2011, 59, 872–880. [CrossRef]
[PubMed]
4. Harvey, N.C.; Holroyd, C.; Ntani, G.; Javaid, K.; Cooper, P.; Moon, R.; Cole, Z.; Tinati, T.; Godfrey, K.;
Dennison, E.; et al. Vitamin D supplementation in pregnancy: A systematic review. Health Technol. Assess.
2014, 18, 1–190. [CrossRef] [PubMed]Nutrients 2019, 11, 442 14 of 16
5. Pérez-López, F.R.; Pasupuleti, V.; Mezones-Holguin, E.; Benites-Zapata, V.A.; Thota, P.; Deshpande, A.;
Hernandez, A.V. Effect of vitamin D supplementation during pregnancy on maternal and neonatal outcomes:
A systematic review and meta-analysis of randomized controlled trials. Fertil. Steril. 2015, 103, 1278–1288.
[CrossRef] [PubMed]
6. Ross, A.C. The 2011 report on dietary reference intakes for calcium and vitamin D. Public Health Nutr. 2011,
14, 938–939. [CrossRef] [PubMed]
7. De-Regil, L.M.; Palacios, C.; Lombardo, L.K.; Peña-Rosas, J.P. Vitamin D supplementation for women during
pregnancy. Sao Paulo Med. J. 2016, 134, 274–275. [CrossRef] [PubMed]
8. Thorne-Lyman, A.; Fawzi, W.W. Vitamin D during pregnancy and maternal, neonatal and infant health
outcomes: A systematic review and meta-analysis. Paediatr. Perinat. Epidemiol. 2012, 26 (Suppl. 1), 75–90.
[CrossRef] [PubMed]
9. Moher, D.; Shamseer, L.; Clarke, M.; Ghersi, D.; Liberati, A.; Petticrew, M.; Shekelle, P.; Stewart, L.A.;
Group, P.-P. Preferred reporting items for systematic review and meta-analysis protocols (PRISMA-P) 2015
statement. Syst. Rev. 2015, 4, 1. [CrossRef] [PubMed]
10. Higgins, J.; Green, S. Cochrane Handbook for Systematic Reviews of Interventions, Version 5.1.0 ed.; The Cochrane
Collaboration: London, UK, 2008.
11. Guyatt, G.; Oxman, A.D.; Akl, E.A.; Kunz, R.; Vist, G.; Brozek, J.; Norris, S.; Falck-Ytter, Y.; Glasziou, P.;
DeBeer, H.; et al. GRADE guidelines: 1. Introduction-GRADE evidence profiles and summary of findings
tables. J. Clin. Epidemiol. 2011, 64, 383–394. [CrossRef] [PubMed]
12. Higgins, J.P.; Thompson, S.G. Quantifying heterogeneity in a meta-analysis. Stat. Med. 2002, 21, 1539–1558.
[CrossRef] [PubMed]
13. Asemi, Z.; Samimi, M.; Siavashani, M.A.; Mazloomi, M.; Tabassi, Z.; Karamali, M.; Jamilian, M.;
Esmaillzadeh, A. Calcium-Vitamin D Co-supplementation Affects Metabolic Profiles, but not Pregnancy
Outcomes, in Healthy Pregnant Women. Int. J. Prev. Med. 2016, 7, 49. [CrossRef] [PubMed]
14. Brough, L.; Rees, G.A.; Crawford, M.A.; Morton, R.H.; Dorman, E.K. Effect of multiple-micronutrient
supplementation on maternal nutrient status, infant birth weight and gestational age at birth in a low-income,
multi-ethnic population. Br. J. Nutr. 2010, 104, 437–445. [CrossRef] [PubMed]
15. Thompson, S.G.; Sharp, S.J. Explaining heterogeneity in meta-analysis: A comparison of methods. Stat. Med.
1999, 18, 2693–2708. [CrossRef]
16. Begg, C.B.; Mazumdar, M. Operating characteristics of a rank correlation test for publication bias. Biometrics
1994, 50, 1088–1101. [CrossRef] [PubMed]
17. Egger, M.; Davey Smith, G.; Schneider, M.; Minder, C. Bias in meta-analysis detected by a simple,
graphical test. BMJ 1997, 315, 629–634. [CrossRef]
18. Brooke, O.G.; Brown, I.R.; Bone, C.D.; Carter, N.D.; Cleeve, H.J.; Maxwell, J.D.; Robinson, V.P.; Winder, S.M.
Vitamin D supplements in pregnant Asian women: Effects on calcium status and fetal growth. Br. Med. J.
1980, 280, 751–754. [CrossRef]
19. Mohammad-Alizadeh-Charandabi, S.; Mirghafourvand, M.; Mansouri, A.; Najafi, M.; Khodabande, F. The
Effect of Vitamin D and Calcium plus Vitamin D during Pregnancy on Pregnancy and Birth Outcomes: A
Randomized Controlled Trial. J. Caring Sci. 2015, 4, 35–44. [CrossRef]
20. Goldring, S.T.; Griffiths, C.J.; Martineau, A.R.; Robinson, S.; Yu, C.; Poulton, S.; Kirkby, J.C.; Stocks, J.;
Hooper, R.; Shaheen, S.O.; et al. Prenatal vitamin d supplementation and child respiratory health:
A randomised controlled trial. PLoS ONE 2013, 8, e66627. [CrossRef]
21. Hollis, B.W.; Johnson, D.; Hulsey, T.C.; Ebeling, M.; Wagner, C.L. Vitamin D supplementation during
pregnancy: Double-blind, randomized clinical trial of safety and effectiveness. J. Bone Miner. Res. 2011, 26,
2341–2357. [CrossRef]
22. Hossain, N.; Kanani, F.H.; Ramzan, S.; Kausar, R.; Ayaz, S.; Khanani, R.; Pal, L. Obstetric and neonatal
outcomes of maternal vitamin D supplementation: Results of an open-label, randomized controlled trial of
antenatal vitamin D supplementation in Pakistani women. J. Clin. Endocrinol. Metab. 2014, 99, 2448–2455.
[CrossRef] [PubMed]
23. Marya, R.K.; Rathee, S.; Dua, V.; Sangwan, K. Effect of vitamin D supplementation during pregnancy on
foetal growth. Indian J. Med. Res. 1988, 88, 488–492. [PubMed]
24. Naghshineh, E.; Sheikhaliyan, S. Effect of vitamin D supplementation in the reduce risk of preeclampsia in
nulliparous women. Adv. Biomed. Res. 2016, 5, 7. [CrossRef] [PubMed]You can also read