Amicus Plato, sed magis amica veritas: There is a - arXiv.org
←
→
Page content transcription
If your browser does not render page correctly, please read the page content below
Amicus Plato, sed magis amica veritas: There is a
reproducibility crisis in COVID-19 Computational
 Fluid Dynamics studies

 Khalid M. Saqr, Ph.D.
 Innovation Hub, Arab Academy for Science, Technology and Maritime
 Transport, Al-Alamein Campus, 51718, EGYPT
 Email: k.saqr@aast.edu
 (ORCID: 0000-0002-3058-2705)

 ABSTRACT
There is overwhelming evidence on SARS-CoV-2 Airborne Transmission (AT) in the ongoing
COVID-19 outbreak. It is extraordinarily difficult, however, to deduce a generalized
framework to assess the relative airborne transmission risk with respect to other modes. This
is due to the complex biophysics entailed in such phenomena. Since the SARS outbreak in
2002, Computational Fluid Dynamics (CFD) has been one of the main tools scientists used to
investigate AT of respiratory viruses. Now, CFD simulations produce intuitive and physically
plausible colour-coded results that help scientists understand SARS-CoV-2 airborne
transmission patterns. In addition to validation requirements, for any CFD model to be of
epistemic value to the scientific community; it must be reproducible. In 2020, more than 45
published studies investigated SARS-CoV-2 airborne transmission in different scenarios using
CFD. Here, I systematically review the published CFD studies of COVID-19 and discuss their
reproducibility criteria with respect to the CFD modeling process. Using a Weighted Scoring
Model (WSM), I propose a novel reproducibility index for CFD simulations of SARS-CoV-2
AT. The proposed index (0 ≤ ≤ 1) relies on three reproducibility criteria comprising 10
elements that represent the possibility of a CFD study ( ) to be reproduced. Frustratingly, only
3 of 23 studies (13%) achieved full reproducibility index ( ≥ 0.9) while the remaining
87% were found generally irreproducible( < 0.9). Without reproducible models, the
scientific benefit of CFD simulations will remain hindered, fragmented and limited. In
conclusion, I call the scientific community to apply more rigorous measures on reporting and
publishing CFD simulations in COVID-19 research.

Keywords: COVID-19, SARS-CoV-2, airborne transmission, computational fluid dynamics,
reproducibility

 1
INTRODUCTION

 To the date of writing this article, COVID-19 pandemic outbreak has resulted in 1.6
million deaths and a historic crash of financial markets[1] leading to major fractures in the
world economy[2]. This pandemic challenges our healthcare systems, economic models and
social lifestyle[3]. Many countries refuged to enforcing nationwide curfew[4], travel ban and
quarantine[5], social distancing and obligatory use of face masks[6] as measures to mitigate
the outbreak. Despite few earlier controversies[7, 8], now there is a widely accepted theory
among scientists now proposing that airborne transmission (AT) is a major infection scenario
of COVID-19[9-11]. Few days after the WHO declared COVID-19 a pandemic[12], a
study[13] published in New England Journal of Medicine demonstrated the possibility of
SARS-CoV-2 AT experimentally. The study compared the stability of SARS-CoV-1 and
SARS-CoV-2 in aerosols and on surfaces. It was evidently shown that SARS-CoV-2 has an
aerosol stability similar to SARS-CoV-1 and remains infectious in aerosols for hours. SARS-
CoV-2 infected patients were shown to exhibit high viral loads in the upper-respiratory
tract[14], manifesting the possibility of producing highly infectious aerosols even from
asymptomatic patients[15]. Infectious aerosols are often categorized according to the droplet
particle size. During a sneeze or a cough, aerosols of respiratory tract fluid are produced
containing large particles (i.e. droplets) typically greater than 5 µm in diameter. These particles
impact directly on a susceptible individual. On the other hand, a susceptible individual could
possibly inhale microscopic aerosol particles consisting of the residual solid components of
evaporated respiratory droplets, which are small enough ( 4 and 1 − 4 . Razzini et al[22]
confirmed the persistence of SARS-CoV-2 RNA in air samples taken from ICU room and
corridor of a hospital in Milan, Italy. In highly populated communities and crowded spaces,
AT could lead to catastrophic rise in infection probability[23, 24]. Therefore, investigating AT

 2
aerodynamics is of eminent importance to help mitigate infection risk at different scales and
scenarios[25]. Computational Fluid Dynamics (CFD) is a very useful tool to manifest such
importance by providing rapid evaluation method to identify AT risk at virtually any given
scenario[26].

RELEVANCE OF CFD MODELS IN SARS-2002 OUTBREAK

 SARS-CoV-2 is an enveloped virus with a diameter of 0.1 , aerosol half-life of 1
hour and a concentration of 104 − 1011 RNAs/mL in respiratory fluids[27]. These are typical
numbers for the Coronaviridae[28], including SARS-CoV-1 that caused the first pandemic of
the 21st century. It has been established that viral RNA is carried in fluid particles produced
by symptomatic patients while coughing and breathing[29] leading to AT of the virus. The
degree to which AT constitutes infection risk depends on many variables that are yet to be
comprehensively understood. The pathogenic similarity between the SARS-CoV-1 and SARS-
CoV-2[30] establishes relevance between the role of AT in the two corresponding pandemics.
The studies conducted on the 2002 SARS outbreak in Amoy Gardens housing complex of Hong
Kong presented important insights. Yu et al[31] studied the distribution of the initial 187 cases
of SARS in Hong Kong while searching for a possible transmission pathway to justify that
cluster infection. Using logistic regression and CFD simulations, they showed that the infection
risk pattern corresponded well with the predicted aerosol transfer pattern between apartments.
In another study, Chu et al[32] analyzed the correlation between nasopharyngeal viral load of
SARS patients on hospital admission and their geographic/location distribution in Amoy
Gardens. They evidently concluded that AT played an important role in the Hong Kong
outbreak. Li et al[33] used multi-zone airflow modeling to study the infection risk of 300
patients in the same housing complex. By comparing the virus concentration and aerosol
dispersion predicted by their model and the distribution of infected patients in the housing
blocks, they provided another evidence on AT. Moreover, Booth et al [34] conducted PCR tests
on air samples collected from patient rooms during the Toronto outbreak. By detecting active
SARS-CoV-1 in air around patients, they indicated AT possibility experimentally. These
studies, all involving CFD simulations, showed that AT has played a significant role in SARS
pandemic outbreak. This historic experience provided sufficient reasoning to consider AT risk
of SARS-CoV-2 at the early beginning of COVID-19 outbreak.

 3
PURPOSE, SCOPE AND REVIEW APPROACH

 The purpose of this article is to promote better reporting practice of CFD studies related
to COVID-19 research and biomedical research at large. The scope is limited to the concept of
reproducibility in CFD practice. The establishment of any CFD study requires proper level of
verification, validation and reproducibility otherwise, it would not be possible to confirm the
study’s conclusion[35]. In COVID-19 air transmission research, CFD models represent the
interface between the biomedical and managerial aspects of the COVID-19 infection control
problem. The rapid, aggressive and mutating COVID-19 outbreak compels certain level of
diligence to support balanced and effective decision making strategies of infection control. The
scope of reproducibility here refers to the minimum level of details at which a CFD model
could be reproduced with a quantifiable measure of error or deviation.

 Similar to SARS-CoV-1, the importance of CFD in investigating SARS-CoV-2 AT is
driven by its parametrization capability that identifies AT patterns of virtually any given
scenario. Each scenario reveals aerodynamic aspects specific to the settings, physical models
and validation data of the CFD simulation. To compile a comprehensive resource of COVID-
19 CFD studies and their reproducibility criteria, a systematic review of the CFD studies is
conducted and discussed. The search engine Scopus was used to identify the reviewed studies.
On December 23rd 2020, a search in TIT-ABS-KEY field yielded 49 studies with the search
string: TITLE-ABS-KEY ( "computational fluid dynamics" OR "CFD" ) AND TITLE-ABS-
KEY ( "Covid-19" OR "SARS-CoV-2" OR "Coronavirus" ) AND ( LIMIT-TO ( PUBYEAR
, 2021 ) OR LIMIT-TO ( PUBYEAR , 2020 ) OR LIMIT-TO ( PUBYEAR , 2019 ) ). The
studies were obtained, reviewed to identify the main corpus of this review. A total of 23 studies
were found to report formal and conclusive CFD results. The studies were then classified
according to transmission scenario, solver, computational model, physics, and settings of each
respective CFD model. The studies were classified into three sets. Set (A)[36-43] represents
the studies conducted on COVID-19 in healthcare facilities such as hospital wards and care
rooms. Set (B)[44-52] represents the studies conducted on SARS-CoV-2 AT in respiratory
scenarios such as in nasopharyngeal and pulmonary spaces. Finally, set (C)[53-58] represents
the studies conducted on COVID-19 in generic spaces and buildings.

 4
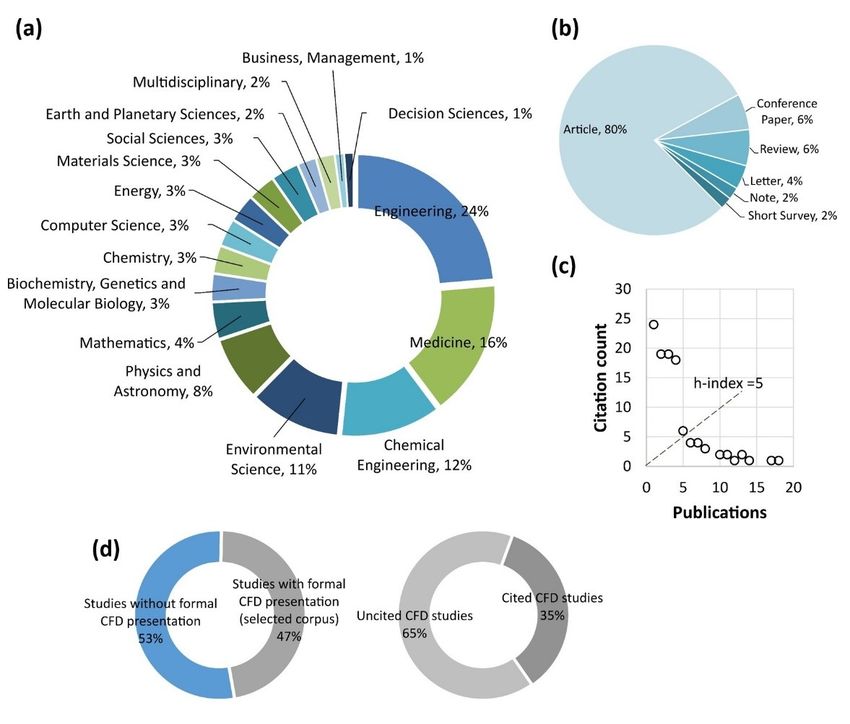
Bibliometric insight

 By subject area, 24% of the studies were published in engineering journals while
the publications in medicine, chemical and environmental engineering were 16%, 12%
and 11%, respectively. It must be noted that many studies are published under more
than one subject area. The 49 studies received 117 citations in total achieving a Scopus
h-index value of 5 until the December 23rd. The studies published under medicine
research area received 52 citations (44% of the total citation count). Eight of the 23
CFD studies received 86 citations (73.5% of the total citation count). By article type,
the 49 studies were classified into 80% articles, 6% reviews and 14% of other article
types. Overall, self-citations constituted only 8.5% of the total citation count. Figure 1
shows a graphical representation of bibliometric data. The supplementary materials
include tabulated data of the citation count of the 49 studies.

Figure 1. Bibliometric insight into the COVID-19 CFD published studies showing (a)
contributions by subject area, (b) by publication type and (c) h-graph indicating h-index
value of 5 and (d) percentage of cited CFD studies compared to the selected corpus.

 5
METHOD: A REPRODUCIBILITY INDEX FOR CFD MODELS OF
COVID-19

 There are three criteria of reproducibility that any fluid dynamicist with firsthand
experience in modern CFD software needs to address in order to replicate a simulation case[59,
60]. The first criterion deals with the numerical formulation of the model, the second one deals
with physical formulation and the third deals with the parametric framework of the simulation
being reproduced. The elements of each reproducibility level are detailed in table 1. In order to
evaluate the 23 CFD studies, a novel reproducibility index is proposed. The index is developed
based on the weighted scoring model (WSM) commonly used in engineering project
management. The importance of each element relevant to COVID-19 research is assigned a
numerical weight = [5,10, 20] representing low, medium and high importance to the
reproducibility process, respectively. Each element in each study is assigned a binary score =
[0,1] to represent the reproducibility of each element. Then, the CFD reproducibility index is
calculated as:

 ∑
 =1
 = ∑
 (1)
 =1

where is the study index and is the number of reproducibility elements, respectively.
Equation (1) dictates that 0 ≤ ≤ 1 where values at 0 and 1 represent entirely
irreproducible and reproducible simulations, respectively. The elements relevant to COVID-
19 research and the scope of this study and their corresponding weights are detailed in table
(2). The reasoning proposed for the weights of reproducibility elements is intuitive and derived
from the CFD modeling process. Two elements of high weight ( = 20) represent the
mandatory information required for the setup of the CFD simulation which are the model
dimensions and initial and boundary conditions (40% of the total weight per study). Five
elements with medium weight ( = 10) represent the information that would make
reproducibility possible (50% of the total weight per study). Two elements of low weight ( =
5) represent the information that would make the reproducibility process easy (10% of the total
weight per study). Here, we argue that for a study to be reproducible ≥ 0.9. Irreproducible
studies have ≤ 0.4 while studies with 0.4 < < 0.9 are difficult to reproduce as they
lack information necessary to perform CFD simulation.

 6
Table 1. Levels and elements of CFD simulation reproducibility process
 Reproducibility Level Elements
 1. Numerical formulation 1.1. Solver and/or iterative formulation
 1.2. Coupling and discretization of the governing equations
 1.3. Computational domain and grid (i.e. mesh)
 1.4. Time stepping
 1.5. Solution convergence criteria
 2. Physical formulation 2.1. Physical models (turbulence, energy, heat transfer, multiphase
 flow, magnetism…etc)
 2.2. Physical properties of working fluids
 2.3. Initial and boundary conditions
 3. Parametric framework 3.1. Independent variables and their values
 3.2. Dependent variables and their representation
 3.3. Validation of the CFD model and results

Table 2. COVID-19 CFD reproducibility elements and their corresponding WSM
weights
 Element
 1 if the solver was reported
 Solver 10
 formulation

 0 if the solver was not reported
 Numerical

 1 if the dimensions were reported
 Model Dimensions 20
 0 if the dimensions were not reported
 1 if the grid resolution was reported
 Grid resolution 10
 0 if the grid resolution was not reported
 1 if the turbulence model was reported
 Turbulence model 10
 0 if the turbulence model was reported
 1 if the aerosol model was reported
 Physical formulation

 Aerosol model 10
 0 if the aerosol model was not reported
 1 if the Reynolds number was reported
 Reynolds number 5
 0 if the Reynolds number was not reported
 1 if the initial and boundary conditions are
 Initial and Boundary FULLY reported
 20
 conditions 0 if any initial and/or boundary conditions are
 missing
 1 if the particle density was reported
 Particle density 5
 0 if the particle density was not reported
 Aerosol particle 1 if the particle diameter is reported
 Independent

 5
 variables

 diameter 0 if the particle dimeter is not reported

 1 if the study reports validation
 Validation 5
 0 if the study does not report validation

 ∑ =1 = 100 0 ≤ ∑ ≤ 100
 =1

 7
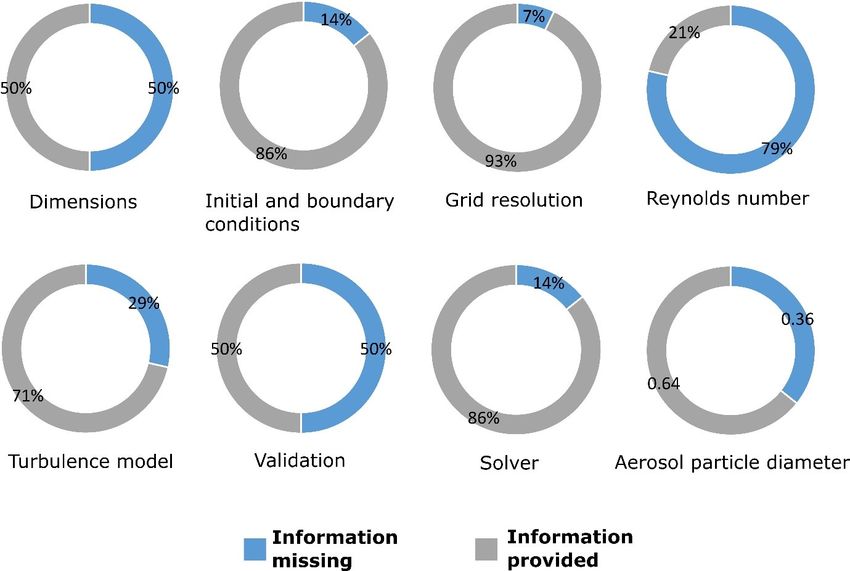
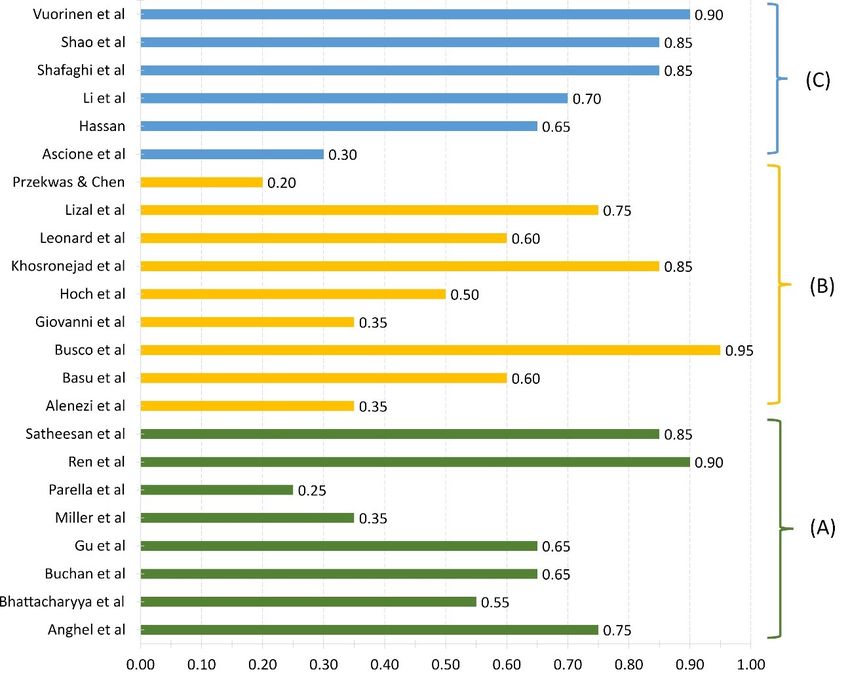
RESULTS AND DISCUSSION

 The distribution of among the 23 studies comprising sets A, B and C are
graphically presented in figure 2. The detailed calculations and scoring sheet is provided in the
supplementary materials. The mean value of was 0.62, 0.57 and 0.71 for sets A, B and
C, respectively. The values of of the 23 studies were found to be normally distributed
around mean (mean=0.62) as shown in figure 3. The distribution, however, is slightly skewed
for < 0.62. Three studies, one from each set[42, 46, 57], achieved full reproducibility

score ( ≥ 0.9) while six studies[40, 41, 44, 47, 52, 53] were found to be irreproducible

( ≤ 0.4). The remaining 14 studies were found to have a reproducibility score in the range
of 0.4 < < 0.9. These studies are difficult to reproduce as they lack important
information. The difficulty of reproducing these studies varies according to the missing
information. Figure 4 shows the missing and available information in the 14 studies according
to the elements presented in table 2. Missing information about Reynolds number and aerosol
particle diameter characterize 79% and 36% of these studies, respectively. Missing dimensions
and validation information characterize 50% of such studies while the remaining
reproducibility elements vary from one study to the other.

 Infection control in healthcare facilities is of crucial importance in managing COVID-
19 outbreak. Set (A) [36-43] comprises CFD studies of different AT scenarios in hospitals and
healthcare facilities. The computational domain in these studies always represent the air flow
around aerosol source of particular settings that represent SARS-CoV-2 AT. Grid resolution
ranged from 0.9 × 10⁶ in simple two-dimensional representation of generic care room[38] to
50 × 106 cells in three-dimensional representations in prefabricated inpatient ward[42]. The
use of RANS models was the main approach to model turbulence with just two studies were
reported using LES[38, 39]. Aerosol modeling was predominantly conducted using the
Eulerian-Lagrangian approach[61]. Only one study reported the Reynolds number value[38]
and another reported aerosol particle density[36] of the simulation. Four studies[36, 41-43]
reported the aerosol particle size in the simulations with a range from 0.69 to 500 . Relatively
similar approaches were identified in the studies comprising set (C)[53-58] where SARS-CoV-
2 AT was studied in generic building spaces. On the other hand, the respiratory studies
comprised in set (B)[44-52] had some different CFD approaches. The computational domain
in such studies represented either expiratory space[44, 46, 50] (i.e. space around person’s head)

 8
or inspiratory space[45, 51] (i.e. tracheobronchial or nasopharyngeal space). Grid resolution,
therefore, had a wide range from 0.15 × 10⁶ to 650 × 106 cells[46, 49]. The aerosol particle
diameter in set (C) studies[44, 45] ranged from 0.1 to 525 . Turbulence and aerosol models
were dominated by RANS and Eulerian-Lagrangian approaches similarly with sets (A) and
(C). These CFD studies should empower our understanding of COVID-19 outbreak[7, 26, 62,
63]. This is demonstrated by the citation data of these studies, as presented earlier in this article.
However, and unlike other important testing and characterization tools addressing this
unprecedented pandemic, published CFD studies suffer from a lack of sufficient reproducibility
criteria to advance infectious aerosol research. With more than half of the studies missing
information about domain dimensions, Reynolds number, particle density and validation; a
reproducibility crisis is identified and should be addressed. It is noteworthy to mention that
none of the studies included in this review has provided any form or format of digital files to
enable manipulation and processing of the CFD results.

Figure 2. Reproducibility index ( ) of the 23 CFD studies (sets A, B and C) of COVID-
19 airborne transmission.

 9
Figure 3. Normal distribution of values of the 23 studies (mean = 0.62, standard deviation
= 0.2, median = 0.65)\

Figure 4. Available and missing information of the reproducibility elements in 14 studies that
have reproducibility index in the range of 0.4 < < 0.9.

 10
CONCLUSION

A novel reproducibility index ( )is proposed to measure the possibility of a CFD study to
be reproduced. The index accounts for three criteria comprising a total of 10 elements that
comprise the essential information required for reproducing CFD simulation. When the index
was applied to 23 published CFD studies related to COVID-19, it revealed a reproducibility
crisis. The results were normally distributed around a mean value of 0.62 and revealed that
only 13% of the selected studies achieve the reproducibility criteria( ≥ 0.9). In
conclusion, we propose this novel reproducibility index as a criteria for publishing CFD studies
related to COVID-19 research in order to empower reproducibility and validation in this
important research topic.

CONFLICT OF INTEREST: NONE

FUNDING: NONE

REFERENCES
[1] Zhang D, Hu M, Ji Q. Financial markets under the global pandemic of COVID-19. Finance
 Research Letters. 2020:101528.
[2] Fernandes N. Economic effects of coronavirus outbreak (COVID-19) on the world
 economy. Available at SSRN 3557504. 2020.
[3] Gautam S, Hens L. COVID-19: Impact by and on the environment, health and economy.
 Springer; 2020.
[4] Koh D. COVID-19 lockdowns throughout the world. Occupational Medicine. 2020.
[5] Parmet WE, Sinha MS. Covid-19—the law and limits of quarantine. New England Journal
 of Medicine. 2020;382:e28.
[6] Rab S, Javaid M, Haleem A, Vaishya R. Face masks are new normal after COVID-19
 pandemic. Diabetes & Metabolic Syndrome: Clinical Research & Reviews. 2020;14:1617-
 9.
[7] Jayaweera M, Perera H, Gunawardana B, Manatunge J. Transmission of COVID-19 virus
 by droplets and aerosols: A critical review on the unresolved dichotomy. Environmental
 Research. 2020;188.
[8] Lewis D. Is the coronavirus airborne? Experts can’t agree. Nature. 2020;580:175.
[9] Morawska L, Cao J. Airborne transmission of SARS-CoV-2: The world should face the
 reality. Environ Int. 2020;139:105730-.
[10] Liu Y, Ning Z, Chen Y, Guo M, Liu Y, Gali NK, et al. Aerodynamic analysis of SARS-
 CoV-2 in two Wuhan hospitals. Nature. 2020;582:557-60.
[11] Hadei M, Hopke PK, Jonidi A, Shahsavani A. A Letter about the Airborne Transmission
 of SARS-CoV-2 Based on the Current Evidence. Aerosol and Air Quality Research.
 2020;20:911-4.

 11
[12] WHO. WHO Director-General's opening remarks at the media briefing on COVID-19.
 World Health Organization; 2020.
[13] van Doremalen N, Bushmaker T, Morris DH, Holbrook MG, Gamble A, Williamson BN,
 et al. Aerosol and Surface Stability of SARS-CoV-2 as Compared with SARS-CoV-1.
 New England Journal of Medicine. 2020;382:1564-7.
[14] Zou L, Ruan F, Huang M, Liang L, Huang H, Hong Z, et al. SARS-CoV-2 Viral Load in
 Upper Respiratory Specimens of Infected Patients. New England Journal of Medicine.
 2020;382:1177-9.
[15] Bai Y, Yao L, Wei T, Tian F, Jin D-Y, Chen L, et al. Presumed Asymptomatic Carrier
 Transmission of COVID-19. JAMA. 2020;323:1406-7.
[16] Asadi S, Bouvier N, Wexler AS, Ristenpart WD. The coronavirus pandemic and aerosols:
 Does COVID-19 transmit via expiratory particles? Aerosol Science and Technology.
 2020;54:635-8.
[17] Stadnytskyi V, Bax CE, Bax A, Anfinrud P. The airborne lifetime of small speech droplets
 and their potential importance in SARS-CoV-2 transmission. Proceedings of the National
 Academy of Sciences. 2020;117:11875-7.
[18] Santarpia JL, Herrera VL, Rivera DN, Ratnesar-Shumate S, Reid SP, Denton PW, et al.
 The Infectious Nature of Patient-Generated SARS-CoV-2 Aerosol. medRxiv.
 2020:2020.07.13.20041632.
[19] Jin T, Li J, Yang J, Li J, Hong F, Long H, et al. SARS-CoV-2 presented in the air of an
 intensive care unit (ICU). Sustainable Cities and Society. 2020:102446.
[20] Guo Z-D, Wang Z-Y, Zhang S-F, Li X, Li L, Li C, et al. Aerosol and surface distribution
 of severe acute respiratory syndrome coronavirus 2 in hospital wards, Wuhan, China,
 2020. Emerg Infect Dis. 2020;26:10.3201.
[21] Chia PY, Coleman KK, Tan YK, Ong SWX, Gum M, Lau SK, et al. Detection of air and
 surface contamination by SARS-CoV-2 in hospital rooms of infected patients. Nature
 Communications. 2020;11:2800.
[22] Razzini K, Castrica M, Menchetti L, Maggi L, Negroni L, Orfeo NV, et al. SARS-CoV-2
 RNA detection in the air and on surfaces in the COVID-19 ward of a hospital in Milan,
 Italy. Science of the Total Environment. 2020;742.
[23] Zhang R, Li Y, Zhang AL, Wang Y, Molina MJ. Identifying airborne transmission as the
 dominant route for the spread of COVID-19. Proceedings of the National Academy of
 Sciences. 2020;117:14857-63.
[24] Dai H, Zhao B. Association of the infection probability of COVID-19 with ventilation
 rates in confined spaces. Build Simul: Springer; 2020. p. 1321-7.
[25] Setti L, Passarini F, De Gennaro G, Barbieri P, Perrone MG, Borelli M, et al. Airborne
 transmission route of COVID-19: why 2 meters/6 feet of inter-personal distance could not
 Be enough. Multidisciplinary Digital Publishing Institute; 2020.
[26] Peng S, Chen Q, Liu E. The role of computational fluid dynamics tools on investigation
 of pathogen transmission: Prevention and control. Science of the Total Environment.
 2020;746.
[27] Bar-On YM, Flamholz A, Phillips R, Milo R. SARS-CoV-2 (COVID-19) by the numbers.
 Elife. 2020;9:e57309.
[28] Payne S. Chapter 17 - Family Coronaviridae. In: Payne S, editor. Viruses: Academic Press;
 2017. p. 149-58.
[29] Gralton J, Tovey ER, McLaws M-L, Rawlinson WD. Respiratory virus RNA is detectable
 in airborne and droplet particles. Journal of Medical Virology. 2013;85:2151-9.
[30] Rossi GA, Sacco O, Mancino E, Cristiani L, Midulla F. Differences and similarities
 between SARS-CoV and SARS-CoV-2: spike receptor-binding domain recognition and
 host cell infection with support of cellular serine proteases. Infection. 2020;48:665-9.

 12
[31] Yu ITS, Li Y, Wong TW, Tam W, Chan AT, Lee JHW, et al. Evidence of Airborne
 Transmission of the Severe Acute Respiratory Syndrome Virus. New England Journal of
 Medicine. 2004;350:1731-9.
[32] Chu CM, Cheng VCC, Hung IFN, Chan KS, Tang BSF, Tsang THF, et al. Viral load
 distribution in SARS outbreak. Emerging Infectious Diseases. 2005;11:1882-6.
[33] Li Y, Duan S, Yu ITS, Wong TW. Multi-zone modeling of probable SARS virus
 transmission by airflow between flats in Block E, Amoy Gardens. Indoor Air. 2005;15:96-
 111.
[34] Booth TF, Kournikakis B, Bastien N, Ho J, Kobasa D, Stadnyk L, et al. Detection of
 airborne severe acute respiratory syndrome (SARS) coronavirus and environmental
 contamination in SARS outbreak units. Journal of Infectious Diseases. 2005;191:1472-7.
[35] Davenport JH, Grant J, Jones CM. Data Without Software Are Just Numbers. Data Science
 Journal. 2020;19.
[36] Anghel L, Popovici CG, Stătescu C, Sascău R, Verdeș M, Ciocan V, et al. Impact of hvac-
 systems on the dispersion of infectious aerosols in a cardiac intensive care unit.
 International Journal of Environmental Research and Public Health. 2020;17:1-17.
[37] Bhattacharyya S, Dey K, Paul AR, Biswas R. A novel CFD analysis to minimize the
 spread of COVID-19 virus in hospital isolation room. Chaos, Solitons and Fractals.
 2020;139.
[38] Buchan AG, Yang L, Atkinson KD. Predicting airborne coronavirus inactivation by far-
 UVC in populated rooms using a high-fidelity coupled radiation-CFD model. Scientific
 Reports. 2020;10.
[39] Gu D, Zheng Z, Zhao P, Xie L, Xu Z, Lu X. High-efficiency simulation framework to
 analyze the impact of exhaust air from covid-19 temporary hospitals and its typical
 applications. Applied Sciences (Switzerland). 2020;10.
[40] Miller SL, Mukherjee D, Wilson J, Clements N, Steiner C. Implementing a negative
 pressure isolation space within a skilled nursing facility to control SARS-CoV-2
 transmission. American Journal of Infection Control. 2020.
[41] Perella P, Tabarra M, Hataysal E, Pournasr A, Renfrew I. Minimising exposure to droplet
 and aerosolised pathogens: a computational fluid dynamics study. British Journal of
 Anaesthesia. 2020.
[42] Ren J, Wang Y, Liu Q, Liu Y. Numerical Study of Three Ventilation Strategies in a
 prefabricated COVID-19 inpatient ward. Building and Environment. 2020.
[43] Satheesan MK, Mui KW, Wong LT. A numerical study of ventilation strategies for
 infection risk mitigation in general inpatient wards. Build Simul. 2020;13:887-96.
[44] Alenezi H, Cam ME, Edirisinghe M. A novel reusable anti-COVID-19 transparent face
 respirator with optimized airflow. Bio-Design and Manufacturing. 2020.
[45] Basu S, Holbrook LT, Kudlaty K, Fasanmade O, Wu J, Burke A, et al. Numerical
 evaluation of spray position for improved nasal drug delivery. Scientific Reports. 2020;10.
[46] Busco G, Yang SR, Seo J, Hassan YA. Sneezing and asymptomatic virus transmission.
 Physics of Fluids. 2020;32.
[47] Giovanni A, Radulesco T, Bouchet G, Mattei A, Révis J, Bogdanski E, et al. Transmission
 of droplet-conveyed infectious agents such as SARS-CoV-2 by speech and vocal exercises
 during speech therapy: preliminary experiment concerning airflow velocity. European
 Archives of Oto-Rhino-Laryngology. 2020.
[48] Hoch D, Azimian M, Baumann A, Behringer J, Niessner J. Comparison of Voxel-Based
 and Mesh-Based CFD Models for Aerosol Deposition on Complex Fibrous Filters.
 Chemical Engineering and Technology. 2020;43:2538-47.

 13
[49] Khosronejad A, Santoni C, Flora K, Zhang Z, Kang S, Payabvash S, et al. Fluid dynamics
 simulations show that facial masks can suppress the spread of COVID-19 in indoor
 environments. AIP Adv. 2020;10.
[50] Leonard S, Atwood CW, Jr., Walsh BK, DeBellis RJ, Dungan GC, Strasser W, et al.
 Preliminary Findings on Control of Dispersion of Aerosols and Droplets During High-
 Velocity Nasal Insufflation Therapy Using a Simple Surgical Mask: Implications for the
 High-Flow Nasal Cannula. Chest. 2020;158:1046-9.
[51] Lizal F, Elcner J, Jedelsky J, Maly M, Jicha M, Farkas Á, et al. The effect of oral and nasal
 breathing on the deposition of inhaled particles in upper and tracheobronchial airways.
 Journal of Aerosol Science. 2020;150.
[52] Przekwas A, Chen Z. Washing hands and the face may reduce COVID-19 infection.
 Medical Hypotheses. 2020;144.
[53] Ascione F, De Masi RF, Mastellone M, Vanoli GP. The design of safe classrooms of
 educational buildings for facing contagions and transmission of diseases: A novel
 approach combining audits, calibrated energy models, building performance (BPS) and
 computational fluid dynamic (CFD) simulations. Energy and Buildings. 2021;230.
[54] Hasan A. Tracking the Flu Virus in a Room Mechanical Ventilation Using CFD Tools and
 Effective Disinfection of an HVAC System. Intl J Air-Conditioning Refrig. 2020;28.
[55] Li YY, Wang JX, Chen X. Can a toilet promote virus transmission? From a fluid dynamics
 perspective. Physics of Fluids. 2020;32.
[56] Shafaghi AH, Talabazar FR, Koşar A, Ghorbani M. on the effect of the respiratory droplet
 generation condition on COVID-19 transmission. Fluids. 2020.
[57] Vuorinen V, Aarnio M, Alava M, Alopaeus V, Atanasova N, Auvinen M, et al. Modelling
 aerosol transport and virus exposure with numerical simulations in relation to SARS-CoV-
 2 transmission by inhalation indoors. Safety Science. 2020;130.
[58] Shao S, Zhou D, He R, Li J, Zou S, Mallery K, et al. Risk assessment of airborne
 transmission of COVID-19 by asymptomatic individuals under different practical settings.
 Journal of Aerosol Science. 2021;151.
[59] Mesnard O, Barba LA. Reproducible and Replicable Computational Fluid Dynamics: It’s
 Harder Than You Think. Computing in Science & Engineering. 2017;19:44-55.
[60] Benureau FC, Rougier NP. Re-run, repeat, reproduce, reuse, replicate: transforming code
 into scientific contributions. Frontiers in neuroinformatics. 2018;11:69.
[61] Löhner R, Antil H, Idelsohn S, Oñate E. Detailed simulation of viral propagation in the
 built environment. Computational Mechanics. 2020;66:1093-107.
[62] Mutuku JK, Hou WC, Chen WH. An overview of experiments and numerical simulations
 on airflow and aerosols deposition in human airways and the role of bioaerosol motion in
 covid-19 transmission. Aerosol and Air Quality Research. 2020;20:1172-96.
[63] Pica N, Bouvier NM. Environmental factors affecting the transmission of respiratory
 viruses. Curr Opin Virol. 2012;2:90-5.

 14
You can also read