AusNet Services Full Year Results 2019 Release and Presentation - Claire Hamilton
←
→
Page content transcription
If your browser does not render page correctly, please read the page content below
13 May 2019

                AusNet Services Full Year Results 2019
                     Release and Presentation
The following documents are attached:

1.   AusNet Services Full Year 2019 Results Release; and

2.   Investor Presentation.

Claire Hamilton
Company Secretary
13 May 2019

               AusNet Services Full Year 2019 Results
AusNet Services reported its full year results for the year ended 31 March 2019, recording a final dividend of
4.86cps (FY19 dividend of 9.72cps) up 5%, franked to 45% (FY19 franking 42.5%, 0% franked in FY18).

Cash flow from operations remain strong, underpinning our ability to fund capital investment and support the
increase in dividends.

As previously advised, the full year results have been negatively impacted by reduced regulated revenues;
namely hand-back of previously received metering revenue, lower reliability incentive revenue and a 9.4%
decrease in gas tariffs. The second half was positively impacted by prices resetting in both distribution
businesses on 1 January 2019.

The impact of lower revenues was materially offset by the cost-efficiency program, resulting in an EBITDA
decline of 0.8%, versus a revenue decline of 2.5%.

Compared to the prior period, results were also adversely impacted by increased depreciation consistent with
growth in asset base and increased finance costs resulting from hedging adjustments and discounting
changes to provisions. Both of these were non-cash items.

Nino Ficca, Managing Director of AusNet Services said, “We remain committed to putting customers at the
centre of what we do. We are striving to deliver positive customer experiences by enabling choice and doing
our part to make energy more affordable. We continue to play an essential role in supporting the transition to
renewables having invested over $200 million this financial year connecting new renewable generation
projects to our Electricity Transmission network.”

        A$M                                             FY 2019            FY 2018               Variance

        Revenues                                         1,861.5            1,909.8                 ↓2.5%

        EBITDA                                           1,134.2            1,142.9                 ↓0.8%

        Earnings before interest and tax                   677.8              700.5                 ↓3.2%

        Profit before income tax                           371.9              416.6                ↓10.7%

        Net profit after tax                               253.9              291.4                ↓12.9%

        Cash flow from operations                          813.7              886.4                 ↓8.2%

        Dividend (cps)                                      9.72                9.25               ↑ 5.1%

        Franking                                          42.5%                  0%               ↑ 42.5%
Operating and Financial Review
Electricity transmission
FY2019 FY2018 Movement %
Segment revenue ($M) 618.2 601.9 16.3 2.7
Segment result – EBITDA ($M) 390.4 379.8 10.6 2.8
Capital expenditure ($M) 211.1 163.8 47.3 28.9
Higher transmission revenues were due to a number of significant customer initiated replacement and
relocation projects.
Total transmission expenses increased $5.7 million relative to FY2018; $2.5 million additional costs in order
to respond to the large increase in new transmission connections driven by renewable generation and $3.2
million additional costs to implement several cost saving initiatives, particularly redundancies.
Capital expenditure increased primarily as a result of $33.2 million of wind farm connection interface works
(2018: $1.9 million) as well as an increase in excluded projects (primarily customer initiated relocations). Major
terminal station rebuilds at Richmond and West Melbourne make up $49.6 million of the spend.
Electricity distribution
FY2019 FY2018 Movement %
Segment revenue ($M) 866.2 891.4 (25.2) (2.8)
Segment result – EBITDA ($M) 528.5 540.2 (11.7) (2.2)
Volume (GWh) 7,608 7,716 (108) (1.4)
Connections 736,841 722,046 14,795 2.0
Capital expenditure ($M) 461.0 439.3 21.7 4.9
Revenue reductions, consistent with the half year, are due to $29.1 million lower incentive revenues ($31.0
million in FY2018, $1.9 million in FY2019 due to lower reliability performance in CY2016) and a $29.4 million
reduction in metering revenue, primarily due to the hand back of previously received excess expenditures
disallowed by the AER. Offsetting these is a $22.1 million increase in customer contributions, primarily new
housing developments and revenue cap outperformance of $3.8 million (see below for further comment).
Operating expenses decreased $13.5 million (net) as a result of the cost efficiency program, with new
contractual arrangements in vegetation management and corporate support functions, in particular, reducing
costs.
Capital expenditure rose as a result of a $23.6 million increase in the Rapid Earth Fault Current Limiter
(REFCL) program. REFCL devices are being installed to reduce the risk of a bushfire caused by a fallen
powerline.
Future revenue impacts
Revenue for distribution services is recognised when those services are provided, based on the prevailing
tariffs at the time. Our electricity distribution business is regulated by the AER and revenue is set on a calendar
year basis which differs to our financial year. Given the nature of the regulatory model and how tariffs are set,
there are a number of items that will impact future revenues for our electricity distribution business as follows:
There is a difference between the regulated revenue recognised under our accounting policy, and the revenue
cap under the Electricity Distribution Price Review (EDPR) determination. This difference is trued-up as an
adjustment to tariffs in future periods. At 31 March 2019 we have a cumulative over-recovery of $7.1 million which
will reduce our revenue in CY2019 and CY2020.
The AER’s decision on our 2016 Advanced Metering Infrastructure (AMI) Transition Charges Application will
result in future revenue reduction of $23 million (approximately $15 million in FY2020 and $8 million in FY2021).
In CY2019, we re-commenced earning incentive revenues under the Service Target Performance Incentive
Scheme (STPIS) and are entitled to $19.4 million as a result of our CY2017 network reliability performance of
which we have received $1.9 million and will receive approximately $7.8 million in the remainder of CY2019 and
$9.7 million in CY2020.
Operating & Financial Review (continued)

Gas distribution

                                                       FY2019           FY2018      Movement             %
               Segment revenue ($M)                      215.1            224.6           (9.5)        (4.2)
               Segment result – EBITDA ($M)              152.5            162.3           (9.8)        (6.0)
               Volume (PJ)                                63.3             66.0           (2.7)        (4.1)
               Connections                             711,310          692,282         19,028          2.7
               Capital expenditure ($M)                  106.8             96.9            9.9         10.2

Regulated gas distribution revenues and EBITDA declined as a result of a 9.4% decrease in gas tariffs for
CY2018.

The increase in capital expenditure reflects higher levels of customer connections and augmentations to the
network.

Mondo (previously Commercial Energy Services)

                                                       FY2019           FY2018      Movement             %
               Segment revenue ($M)                      172.1            206.2          (34.1)       (16.5)
               Segment result – EBITDA ($M)               62.8             60.6            2.2          3.6
               EBITDA Margin (%)                          36.5             29.4            7.1         24.1
               Capital expenditure ($M)                  190.9             50.2          140.7        280.3

The Mondo business provides a range of services and technology for essential infrastructure across the
energy, water and transport sectors. Mondo provides contracted infrastructure asset services and specialised
technology solutions to enable energy data and asset intelligence services. The contracted infrastructure asset
services business unit owns and operates a portfolio of assets not included in the regulated asset base. The
investments are made through directly negotiated agreements, under which we typically receive revenue over
the contract period in exchange for infrastructure use and operational services provided.

Revenues reduced by $34.1 million predominantly as a result of the strategic refocus executed in FY2018
reducing the provision of certain maintenance services resulting in exiting a number of field services
agreements. EBITDA margins improved as a result of the refocus and a change in revenue mix towards higher
margin infrastructure, energy data and asset intelligence projects.

Capital expenditure in FY2019 primarily relates to three wind farm connections under construction, the
completion of the Salt Creek, Bulgana and Crowlands windfarm connections and the Ballarat Battery Energy
Storage project.

                                                                                                               3
Outlook
For FY20, AusNet Services expects, subject to business conditions, to pay a total dividend of 10.2 cps, up 5%
on FY19, franked 40% to 50%. AusNet Services will continue to determine future dividends by reference to
operating cash flows (using EBITDA as a proxy) after servicing all of its maintenance capital expenditure and
a portion of its growth capital expenditure.

AusNet Services expects continued growth in its regulated asset base of around 3% per annum to FY22. The
business has increased the contracted energy infrastructure assets target from $1.0bn to $1.5bn by FY24 (at
appropriate risk adjusted rates of return). Net debt to regulated and contracted asset base is expected to
remain below 70% to FY22.

As part of AusNet Services Energising Futures Strategy, caring for our customers, enabling their choices and
doing our part to make their energy affordable are key priorities. To achieve this, AusNet Services will continue
to relentlessly focus on productivity and efficiency, targeting top quartile of efficiency benchmarks for all
networks.

                                                                                                               4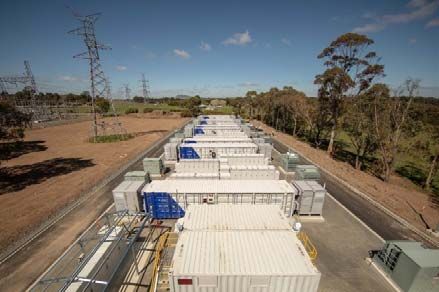
Dividend key dates

The 2019 final dividend of 4.86 Australian cps is 45% franked.

The Dividend Reinvestment Plan (DRP) will be in operation for the 2019 final dividend at a 2% discount to the
average trading price. The average trading price will be the average of the volume weighted average price of
shares sold in ordinary market transactions on the ASX between 24 May 2019 and 6 June 2019 (inclusive).

For further information please refer to the DRP rules at www.ausnetservices.com.au.

Relevant dates:

21 May 2019                 Ex-date for final dividend

22 May 2019                 Record date to identify shareholders entitled to the final dividend

23 May 2019                 Last election date for participation in the DRP

27 June 2019                Payment of final dividend

About AusNet Services
AusNet Services is the largest diversified energy network business in Victoria, owning and operating $12.8
billion of assets. The company owns and operates three regulated networks - electricity distribution, gas
distribution and the state-wide electricity transmission network. The company also has an unregulated
business called Mondo, focusing on contracted infrastructure, asset intelligence and energy services.

Headquartered in Melbourne, Australia, AusNet Services employs around 1,900 people to service over 1.4
million consumers. For more information visit AusNet Services’ website, www.ausnetservices.com.au.

                                                                                                           5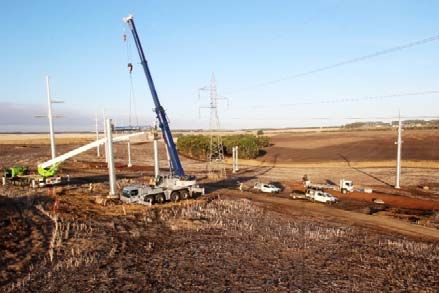
Full Year 2019 Results
For the financial year ended 31 March 2019
Disclaimer
The AusNet Services Group (AusNet Services) comprises AusNet Services Ltd and its subsidiaries.
The information in this presentation is not a prospectus, product disclosure statement or other offering document and does not constitute an offer, invitation or
recommendation to subscribe for, retain or purchase any securities in AusNet Services. The information is an overview (in summary form) and does not purport to be complete
or contain all the information necessary to make an investment decision. This presentation is not financial product advice and does not take into consideration the investment
objectives, financial situation or particular needs of any particular person. You should consider the appropriateness of the information having regard to your individual
objectives, financial situation (including taxation position) and needs, and seek independent professional advice. This presentation, and the information in this presentation,
will not form the basis of any contract or commitment.
This presentation has been prepared by AusNet Services on the information available. To the maximum extent permitted by law, no representation or warranty, express or
implied, is made as to the fairness, accuracy, completeness or correctness of the information, opinions and conclusions in this presentation and AusNet Services, its directors,
officers, employees, agents and advisers disclaim all liability and responsibility (including for negligence) for any direct or indirect loss or damage which may be suffered by
any recipient through use or reliance on anything contained in or omitted from this presentation.
This presentation contains certain “forward-looking statements” and prospective financial information. These forward looking statements and information are based on the
reasonably held beliefs of AusNet Services management as well as reasonable assumptions made by and information currently available to AusNet Services management, and
are current only as of the date of this presentation. All statements other than statements of historical facts included in this presentation, including without limitation,
statements regarding AusNet Services forecasts, business strategy, synergies, plans and objectives, are forward-looking statements. In addition, when used in this
presentation, the words “guidance”, “forecast”, “estimate”, “expect”, “anticipated” and similar expressions are intended to identify forward looking statements. Such statements
are subject to significant assumptions, risks and uncertainties, many of which are outside the control of AusNet Services and are not reliably predictable, which could cause
actual results to differ materially, in terms of quantum and timing, from those described in this presentation. In receiving this presentation, you agree to the above restrictions
and limitations.
Non-IFRS information
• Other than as indicated, the financial information contained in this document is directly extracted or calculated from the annual financial report. Throughout this document
  some non-IFRS financial information is stated (operating expenses excluding certain items and regulated and contracted asset bases). We believe these non-statutory
  measures provide useful information to understand the financial performance of the Group, but should not be considered as an indication of, or substitution for reported
  information.
• The non-IFRS financial information has not been audited by the Group’s auditors.
                                                                                                                                                                                      2
FULL YEAR 2019 RESULTS
•   Introduction
•   Financial Performance
•   Regulated Energy Services
•   Mondo (formerly Commercial Energy Services)
•   Outlook

                                                  3
Safety mission and performance

Leadership                                                                   35%
Embedding clear leadership accountabilities                                 Reduction in Recordable
for all employees and promoting improved
communication and recognition of safety
                                                                             Injury Frequency Rate
performance                                                                     (FY19 RIFR 3.53)

                                              Behaviour
                                              Taking responsibility for
Safe Working                                  safety. Knowing how to work
Environment                                   safely. Speaking up and
                                              keeping others safe
Strong focus on critical risks
including motor vehicle and
electrocution

                                                                                                      4
AUSNET SERVICES
• ASX Top 100, $6.5bn market capitalisation
• Unique set of critical infrastructure assets based
in Victoria (energy transmission and distribution)
• $10.3bn regulated & contracted asset base
• Over 1.4m customers
• Around 86% regulated revenues and growing
contracted revenues
• Own, operate and control asset base
5Energising Futures Strategy
AusNet Services’ vision is “to create energising futures by delivering value to our customers, communities and partners”
Energising Futures responds to industry transformation, which is characterised by a shift towards renewables, new technologies, changing customer
expectations and pressure on energy affordability
Objectives Targeted Outcomes
Accretive asset base growth • Stable, predictable long-term cash flows, supporting
Growth sustainable shareholder returns
Improve efficiency and reduce costs • Top quartile of efficiency benchmarks for all networks
Cost • Supporting affordable energy for customers
Efficiency
• Sustainable shareholder returns
Enable customer choice and control • Deliver safe and reliable energy to customers
Customer
Centricity • Enhanced customer experience across the portfolio
Invest in digital tools and processes to improve performance • Improved efficiency, safety and customer outcomes
Digital
• Capabilities to strengthen cyber resilience
Utility
Future-ready Ensure we have the right culture and capabilities for sustainable • Engaged employees and adaptive ways of working
Capabilities high performance and adapt to the future
• Stronger capabilities to ensure delivery of the strategy
& Culture 6Investment proposition
• Inflation linked revenues, next regulated revenue reset 1 Jan 2021 (Electricity Distribution) *
Stability • Long-term maintenance of A-range credit rating through prudent and sustainable financial
settings
• Stable, predictable cash flows, supporting dividend growth
Shareholder returns • Delivering a sustainable cost base
• Energising Futures strategy builds on Focus 2021
Strategy • Building a truly customer-focused, modern energy business
• Accretive growth in the contracted transmission asset base
• Currently top-quartile efficiency in Electricity Transmission and Gas Distribution
Operational excellence • Targeting top-quartile for Electricity Distribution benchmarking
*Subject to change. Victorian State Government has announced it intends to extend the current regulatory period by six months to align pricing for Distribution businesses to 30 June, consistent with 7
the rest of Australia. This is likely to defer price review timelines by six months.FY19 Achievements
• Continued positive trend in RIFR improvement (Recordable Injury Frequency Rate), down 35% to 3.53, a
record low result
Safety • Continued progress on Rapid Earth Fault Current Limiter program
• Maintained a bushfire mitigation index of ‘zero’ throughout the fire season and outperforming fire ignition
risk benchmark (as at 31 March 2019)
• FY19 dividend up 5% (42.5% franked)
• Around $1bn of capital investment, regulated asset base up 3.5%
Growth • Contracted transmission asset base of $949m, up over 30%*
• Total shareholder returns of 13.9%
• 30MWh Battery Energy Storage System integrated at Ballarat Terminal Station
Multiple community energy projects with the installation of behind-the-meter energy management
Innovation
•
systems, clean energy generation and battery storage
• First distribution business to trial customer forum process for a price reset, EDPR 2021-25 proposal
Efficiency • Electricity distribution benchmarked operating cost reduction of $41m from CY16 to CY18
8
* Growth inclusive of signed contractsFinancial Performance
9Financial performance
A$M FY 2019 FY 2018 Variance
Statutory Result
• Lower reliability incentive scheme
(↓$29m), metering (↓$29m) and Mondo Revenues 1,861.5 1,909.8 ↓2.5%
(↓$34m) revenues
EBITDA 1,134.2 1,142.9 ↓0.8%
• Decrease in operating expenses (↓$40m),
driven by cost efficiency program and Mondo EBIT 677.8 700.5 ↓3.2%
strategic refocus
PBT 371.9 416.6 ↓10.7%
• FY 2019 dividend up 5%, 42.5% franked
(FY18 franking 0%) NPAT 253.9 291.4 ↓12.9%
Cash flow from operations 813.7 886.4 ↓8.2%
Dividends (cps) 9.72 9.25 ↑5.1%
10Cash flow from operations
• Continued strong operating cash flows, despite lower revenues
27
4
13
$M
886 36
814
FY18 Cash flow EBITDA (excluding non-cash Net Finance Income Tax Change in Working Capital FY19 Cash flow
items) Costs Paid paid
11NPAT performance
• Decline in regulated revenues partially offset by cost efficiency program
• Increased net finance charges primarily relate to non-cash hedging adjustments and discounting changes to provisions
14
291
48
40
22
$M 7
254
NPAT FY18 Operating Revenues Operating Costs Depreciation & Net Finance Income Tax NPAT FY19
Amortisation Charges Expense
12Delivering a sustainable cost base
Around $114m reduction in operating costs since FY17
Achieved around $114m of operating cost efficiencies through:
• Headcount reduction of 24% (since April 2016)
• Mondo strategic refocus, exited a number of field services
agreements
• IT/Business process outsourcing program
• Property rationalisation
• Metering business efficiencies
559 58
• Procurement and contract savings
• Vegetation management efficiencies
$M • Automation and process improvements
56
20
464
Operating Costs FY17 Mondo Refocus Regulated operating cost savings Inflation * Operating Costs FY19
Note: Chart excludes pass through items such as Easement and land tax and Transmission Use of System Charges. Chart also excludes disposal of Property, Plant and Equipment and Guaranteed Service Level payments. 13
* Wage growth and inflation @ 2%.Capital investment
Total Capex
$970M
• Increase in Mondo growth capex due to
construction of wind farm connections and
Ballarat battery facility Total Capex
$750M 191
• Transmission renewable infrastructure interface
works $33m (FY18: $2m)
50 107
• Growth / maintenance capex split approximately 97
65/35 211
$M 164
• Continued significant investment in bushfire
mitigation $125m (FY18: $115m) and other safety
measures
• FY19 capital investment includes customer 439 461
contributions of $132m (FY18: $68m) of which
$25m relates to Ballarat Battery Energy Storage
Project
FY 2018 FY 2019
Electricity Distribution Electricity Transmission Gas Distribution Mondo
14Dividend and capital investment funding
• Dividends remain fully covered by strong operating cash flows (EBITDA is used as a proxy when considering dividends)
273
42
Growth Capex
326
$557m
$M
1,111
DRP 59
Debt
343 371
Cash 127
EBITDA (excluding non- Net Finance Income Tax Maintenance Capex Gross Dividend Growth Capex Funding
cash items) Costs Paid Paid
Note: Capital investment as per cash flow statement $883m. Estimated net regulatory depreciation $344m (Indexation $128m) 15Diversified debt portfolio
• $6,908m net debt hedged against movements in interest rates (99%). Over $1bn of debt raised during the period:
• $200m, 25-year Australian Dollar bonds
• $700m of 5, 6 and 7-year revolving bank debt facilities
• 10-year NOK bond (A$246m) and 15-year HKD bond (A$110m)
• As at 31 March 2019, $778m of undrawn committed bank debt facilities
• Swiss Franc senior notes (A$283m) repaid in April 2019 from cash reserves
160
100
246
200
284
283
A$'M
825
710
160
51 543 107 550
506
400 425
335 63
250 252
207 200
22.0 125 99 110
EUR A$ MTNs CHF HKD JPY Working Capital NOK USD USD Hybrid SGD Hybrid
16
Net debt = Debt at face value ($7,247) less cash of $339m. Offshore debt shown at hedged rates (face value). First call date for SGD and USD hybrid securities is September 2021.Regulated Energy Services
Industry developments

 EDPR 2021-25 Customer Forum                                                         Market reforms                                                    Regulatory developments

 • First distribution business to trial customer                          • AEMC to review the use of stand alone power                             • AER rate of return review Final Decision released
   forum process for a price reset                                          systems to serve existing customers where it is                           in December 2018
                                                                            efficient
 • Draft proposal to be lodged with AER in July                                                                                                     • AER tax review released in December 2018
   2019* after incorporating further feedback                             • Open Energy Networks, consultation with AEMO
   from customers                                                           and ENA on how best to transition to a two-way
                                                                            grid
 • AER draft decision expected in April 2020*
                                                                          • Potential transmission access reform requiring
                                                                            networks to provide sufficient capacity
                                                                            consistent with firm transmission rights
                                                                            purchased by generators

*Subject to change. Victorian State Government has announced it intends to extend the current regulatory period by six months to align pricing for Distribution businesses to 30 June, consistent     18
with the rest of Australia. This is likely to defer price review timelines by six months.
Rate of Return and Tax review
Rate of return and tax review to progressively impact revenues from FY21:
• Electricity Distribution Price Review (2021-2025)* commences 1 January 2021;
• Electricity Transmission Revenue Reset (2023-2027) commences 1 April 2022; and
• Gas Access Arrangement Review (2023-2027)* commences 1 January 2023.
Review Parameter Current Change
Rate of Return Equity risk premium 4.55% 3.66%
Debt risk premium Broad BBB curve 2/3 Broad BBB, 1/3 Broad A
Gamma 0.4 0.585
Tax Refurbishment capex and capitalised Depreciation of refurbishment capex and Immediate deduction of refurbishment
direct overheads capitalised direct overheads aligned to capex and capitalised direct overheads to
accounting treatment align to tax treatment
Tax depreciation treatment of new capex Common use of straight line depreciation Diminishing value depreciation for new
capex
*Subject to change. Victorian State Government has announced it intends to extend the current regulatory period by six months to align pricing for Distribution businesses to 30 June, consistent 19
with the rest of Australia. This is likely to defer price review timelines by six months.Operational highlights
Electricity Transmission Electricity Distribution Gas Distribution
• Completed Richmond terminal station rebuild • REFCL* Tranche 1 in progress, 6 out of 8 zone • Improved reliability by 9%. Continued network
(~$215m). West Melbourne terminal station substations conditionally compliant. Seeking extension expansion, with 260km of new gas pipelines
rebuild 48% complete (~$76m) until 1 November 2019 for the two remaining zone
substations to achieve conditional compliance • Bannockburn connected to natural gas in July 2018,
• North West Communications Loop project 62% concluding ‘Energy for the Regions’ program. Gas
complete (~$15m) • New solar and battery pre-approval tool launched to marketing trial highlights strong uptake from
enhance customer experience customers
• Continue to support Western Victoria and second
Bass Strait interconnector feasibility • Working with Victorian Government to implement solar • Significant reduction in unaccounted for gas resulting
subsidy in $2m p.a. in savings
• Executed contracts for 1,437MW for 7 wind and
solar farms • Information Management (IM) Platform implemented
enabling data analytics and visualisation and more
efficient asset management capability
20
* Rapid Earth Fault Current Limiter. REFCL devices are being installed to reduce the risk of a bushfire caused by a fallen powerline.Mondo
(formerly Commercial Energy Services)
21Contracted Infrastructure
On track to achieve $1bn asset base target 2 years ahead of plan. Strong pipeline supports increasing target to
$1.5bn by FY24, as transition to renewables across Australia maintains momentum
• Contracted transmission asset base of $949m, up over
30%*
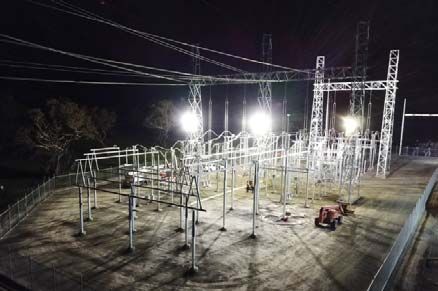
• Salt Creek, Crowlands and Bulgana Wind Farm
connections completed in FY19 (~ $100m)
• Ballarat Energy Storage System completed in FY19
Stockyard Hill Wind Farm | Transmission Line Bulgana Green Power Hub | Terminal Station
(~$35m)
• Stockyard Hill Wind Farm, Dundonnell Wind Farm and
Murra Warra Wind Farm connections under construction
(~ $275m)
• National pipeline of connection and augmentation
opportunities
• Preliminary works on several new connections
underway
Ballarat Energy Storage System Crowlands Terminal Station
22
* Growth inclusive of signed contractsBuilding capabilities to develop new energy solutions for customers
Existing unregulated operations are being leveraged to enter new markets disrupted by renewable energy and technology. Whilst
in trial phase, Mondo is working with customers to develop new energy solutions that are reliable and cost effective
Project Overview Business Model
Hume region
including
• Multiple community energy projects
• Infrastructure ownership
• Behind-the-meter energy management systems
• Energy services
• Clean energy generation and battery storage
Micro - grid
• University microgrid supported by 7.25 MW solar
• Infrastructure ownership
generation and 1 MWh battery storage, in addition
• Energy services
to small scale solutions
Battery storage
• Infrastructure ownership Yackandandah micro grid reaches 1GWh of
• 30MWh storage system at the transmission level locally generated renewable energy in
February 2019
Mondo’s work with Yackandandah has helped
the community manage it’s energy and move
Commercial & Industrial toward a 100% renewable future.
energy solutions • Rooftop solar system and battery storage (phase
• Infrastructure ownership
one), with a view to integrating hydrogen
• Energy services
generation
23Our People
Capability & Culture
• Culture blueprint established to underpin Energising
Futures strategy
• Company-wide Culture & Engagement survey
launched
• Improvement in critical capabilities for strategy
execution
• Launch of Energised Leader program
Diversity & Inclusion
• Refreshed Diversity & Inclusion Advisory Council
• Female representation increased from 21% to
23% through targeted Apprentice, Trainee and
Communications & Change
Graduate recruitment campaigns
• Engaged our people on strategy and vision
• Gender pay equity review underway, addressing all
through town halls, roadshows and new
identified issues
digital channels
• Established change management
community to support strategy execution
24Outlook
• FY20 dividend guidance of 10.2cps, up 5% expected to be franked 40% to 50% (subject to
Dividends business conditions)
• Regulated Asset Base growth forecast at around 3% p.a. to FY22
Asset Base and
• Targeting $1.5bn of contracted energy infrastructure assets by FY24 (at appropriate risk adjusted
Capital rates of return)
Management • Forecast Net Debt to Regulated and Contracted Asset Base ofAppendices
Electricity Transmission Network

 • Regulated revenues decreased by $2m to $531m as per                                   FY 2019   FY 2018   Variance
   regulated price path
                                                                  Revenue                 618.2     601.9    ↑2.7%
 • Excluded revenues $74m (FY18: $54m). Increase due to Metro
   Tunnel ($13m) and Waverley Park tower relocation works ($7m)
                                                                  EBITDA                  390.4     379.8    ↑2.8%
 • FY20 revenue cap $581m. Increase due to higher easement and
   land tax in FY20 of $176m (FY19: $143m), which is a pass       EBITDA Margin          63.2%     63.1%     ↑ 0.1%
   through item
                                                                  EBIT                    292.9     280.4    ↑4.5%

                                                                  EBIT Margin            47.4%     46.6%     ↑0.8%

                                                                  Regulated Asset Base    3,533     3,498    ↑1.0%

                                                                                                                        27
Electricity Distribution Network
FY 2019 FY 2018 Variance
• CY19 revenue cap $728m (includes TUOS pass through of around
$80m) and $10m STPIS revenue (entitled to $19.4m in CY19, Revenue 866.2 891.4 ↓2.8%
deferring remainder to CY20)
• ~Estimated CY20 revenue cap $760m (includes estimated TUOS EBITDA 528.5 540.2 ↓2.2%
pass through of around $86m), subject to confirmation by AEMO
EBITDA Margin 61.0% 60.6% ↑ 0.4%
• FY19 metering revenue $51m (FY18: $80m)
EBIT 244.1 266.3 ↓8.3%
• Expect CY19 and CY20 metering revenues of $50m and $46m
respectively
EBIT Margin 28.2% 29.9% ↓1.7%
• Customer contributions $70m (FY18: $48m). Increase due to new
housing estates Volumes (GWh) 7,608 7,716 ↓1.4%
• Excluded revenues $25m (FY18: $25m) Connections 736,841 722,046 ↑2.0%
Regulated Asset Base 4,427 4,185 ↑5.8%
28Gas Distribution Network
• 1 Jan 2019, average tariffs increased 1.3%
FY 2019 FY 2018 Variance
• 1 Jan 2018, average tariffs declined by 9.4%
Revenue 215.1 224.6 ↓4.2%
• Excluded services revenue of $4m, unchanged from FY18
EBITDA 152.5 162.3 ↓6.0%
• Customer contributions $7m (FY18: $11m)
EBITDA Margin 70.9% 72.3% ↓1.4%
• Other revenues of $5m (FY18: $1m) primarily relates to Bannockburn
gas new towns
EBIT 100.7 113.7 ↓11.4%
EBIT Margin 46.8% 50.6% ↓3.8%
Volume (PJ) 63.3 66.0 ↓4.1%
Connections 711,310 692,282 ↑2.7%
Regulated Asset Base 1,617 1,569 ↑3.1%
29FY 2019 FY 2018 Variance
• Revenue and operating cost decrease due to
strategic refocus away from certain maintenance Revenue 172.1 206.2 ↓16.5%
services, exiting a number of field service agreements
• Completed Salt Creek, Bulgana and Crowlands wind EBITDA 62.8 60.6 ↑3.6%
farm connections and Ballarat Energy Storage System
EBITDA Margin 36.5% 29.4% ↑7.1%
• Expect FY20 capex of around $140m on Stockyard
Hill, Dundonnell and Murra Warra 2 wind farm
EBIT 40.1 40.1 0.0%
connections, currently under construction
EBIT Margin 23.3% 19.4% ↑3.9%
Contracted
Infrastructure Asset 712 560 ↑27.1%
Base
30New lease accounting standard - AASB 16
• AASB 16 will require the recognition of all leases for a lessee on balance sheet, with limited exceptions for short term and low value
leases, thereby removing the off balance sheet treatment currently applied to operating leases
• AusNet Services will apply AASB 16 on 1 April 2019
• Refer to Note F5 of the financial statements for more information
31Sound fundamentals
Financial Metrics FY2019 FY2018
Market Capitalisation (as at 31 March) $6.5bn $6.1bn
Total Assets $12.8bn $12.5bn
Regulated / Contracted Asset Base $10.3bn $9.8bn
Total Borrowings (Face Value) $7.2bn $7.2bn
Net Debt 1 $7.6bn $6.9bn
Net Gearing (Carrying Value) 2 70% 66%
Net Debt (Face Value) to Regulated / Contracted Asset Base 3 67% 67%
Interest Cover 4 3.3x 3.6x
Credit Ratings (S&P / Moody’s) A- / A3 A- / A3
Note
1. Net debt is debt at carrying value. Includes full amount of $A706m in Hybrids, despite receiving 50% equity credit.
2. Calculated as net debt at carrying value divided by net debt at carrying value plus equity.
3. Debt at face value less cash divided by Regulated / Contracted Asset Base. Demonstrates how AusNet Services funds its capex in terms of debt vs. income generating assets. Includes full amount of
$A706m in Hybrids, despite receiving 50% equity credit.
4. Calculated as EBITDA less customer contributions and tax paid, divided by net interest expense (including return on desalination licence receivable). This is how interest cover is measured for internal
management purposes, as it provides an accurate reflection of how after-tax operating cash flows are used to meet interest payments. Includes full amount of $A706m in Hybrids, despite receiving 32
50% equity credit.Interest rate hedging profile
• As at 31 March 2019, the weighted average interest rate of the
total hedge portfolio was 2.70% vs 2.61% as at 31 March 2018
• AER approach assumes that every year, one-tenth (10%) of the
2,926
debt portfolio is refinanced
2,835
2,760
2,399
2,188
1,020 1,977
918
816
714 1,620
612
510
408 1,315
2,835 2,675 2,435 2,195 1,104
1,955 1,715 306
1,350 893
204
700 460 102 682
240
Mar-19 Mar-20 Mar-21 Mar-22 Mar-23 Mar-24 Mar-25 Mar-26 Mar-27 Mar-28 Mar-29
Electricity Distribution Hedges Gas Distribution Hedges Electricity Transmission Hedges
Note: Face value of hedges outstanding as at the end of the financial year. Electricity transmission hedges include unregulated transmission connection hedges which extend beyond FY29
33Regulatory Reset Summary
Around 86% of total revenues locked-in until 1 Jan 2021
2019 2020 2021 2022 2023 2024
Electricity Transmission
Electricity Distribution*
Gas Distribution*
Regulatory period Beginning of new reset period
*Subject to change. Victorian State Government has announced it intends to extend the current regulatory period by six months to align pricing for Distribution businesses to 30 June, consistent
34
with the rest of Australia. This is likely to defer price review timelines by six months.Current regulatory determinations
Gas distribution Electricity distribution Electricity transmission
Regulatory period
2018-22 2016-20 2017-22
Beta 0.70 0.70 0.70
Risk Free Rate 2.73% 2.93% 2.52%
Cost of Debt 5.04% 5.52% 4.94%
Gamma 0.40 0.40 0.40
Market Risk Premium 6.50% 6.50% 6.50%
Nominal Vanilla WACC 5.94% 6.31% 5.80%
Return on Equity 7.30% 7.50% 7.10%
Net Capex (Nominal) $522m $1,788m $780m
Opex (Nominal) $293m $1,355m $1,225m
Revenue (Nominal) $1,040m $3,524m $2,742m
Note: Data in table is based on original regulatory determinations
35Regulated network statistics
Around 86% of total revenues
Transmission
Electricity
• Over 6,700km of lines
• 53 terminal stations and switchyards
• Over 13,000 towers
Distribution
• 736,000 customers
Electricity
• 60 zone substations
• Over 7,500 Gwh of throughput p.a.
• Around 383,000 power poles
Distribution
• 711,000 customers
Gas
• 11,700km of gas mains
• 63 PJ of throughput p.a.
36Ownership Structure
AusNet Services Shareholders
Singapore Power State Grid International
Public investors
International Pte Ltd Development
49%
31.1% Limited 19.9%
AusNet Services Limited
AusNet Services AusNet Services AusNet Services Finance
(Distribution) Pty Ltd (Transmission) Pty Ltd Trust
• AusNet Services owns, operates and controls its assets, providing shareholders with a secure pathway to cash flows. AusNet Services is not an
infrastructure fund model.
• Singapore Power is a long term investor, purchasing the original Transmission assets in 2000 and the Distribution assets in 2004, prior to the listing of
AusNet Services in December 2005.
• State Grid Corporation of China is the largest utility in the world and became a substantial shareholder in AusNet Services on 3 January 2014.
37Further information and contacts
AusNet Services is the largest diversified energy network business in For further information contact:
Victoria, owning and operating $12.8 billion of assets.
The company owns and operates three regulated networks - electricity
distribution, gas distribution and the state-wide electricity transmission Investor Relations AusNet Services Ltd
network. The company also has an unregulated business called Mondo, John Nicolopoulos
Head of Investor Relations Level 31
focusing on contracted infrastructure, asset intelligence and energy 2 Southbank Boulevard Southbank
services. +61 3 9695 6301 or +61 409 672 912
Victoria 3006 Australia
Headquartered in Melbourne, Australia, AusNet Services employs 1,900
people to service over 1.4 million customers and is listed on the Locked Bag 14051
Australian Securities Exchange (ASX: AST). Melbourne City Mail Centre
Media Relations
Victoria 8001 Australia
Sarah Ward
For more information visit www.ausnetservices.com.au
Corporate Affairs Tel: +61 3 9695 6000
+61 3 9695 6521 or +61 447 289 452 Fax: +61 3 9695 6666
38You can also read