Osteoarthritis Changes Hip Geometry and Biomechanics Regardless of Bone Mineral Density-A Quantitative Computed Tomography Study - MDPI
←
→
Page content transcription
If your browser does not render page correctly, please read the page content below
Journal of
           Clinical Medicine

Article
Osteoarthritis Changes Hip Geometry
and Biomechanics Regardless of Bone Mineral
Density—A Quantitative Computed
Tomography Study
Jerzy Narloch 1,2 and Wojciech M. Glinkowski 1,2,3,4, *
 1    Chair and Department of Orthopaedics and Traumatology of the Locomotor System, Medical University of
      Warsaw, 02-005 Warsaw, Poland; jerzy.narloch@gmail.com
 2    Polish Telemedicine and eHealth Society, 03-728 Warsaw, Poland
 3    Centre of Excellence “TeleOrto” for Telediagnostics and Treatment of Disorders and Injuries of the
      Locomotor System, Department of Medical Informatics and Telemedicine, Medical University of Warsaw,
      02-005 Warsaw, Poland
 4    Department of Orthopaedics and Traumatology of the Locomotor System, Baby Jesus Clinical Hospital,
      02-005 Warsaw, Poland
 *    Correspondence: w.glinkowski@gmail.com; Tel.: +48-226-582-997 or +48-601-230-577

 Received: 15 April 2019; Accepted: 8 May 2019; Published: 12 May 2019

 Abstract: We aimed to compare proximal femur geometry and biomechanics in postmenopausal
 women with osteoarthritis (OA) and/or osteoporosis (OP), using quantitative computed tomography
 (QCT). A retrospective analysis of QCT scans of the proximal femur of 175 postmenopausal women
 was performed. Morphometric and densitometric data of the proximal femur were used to evaluate
 its biomechanics. We found, 21 had a normal bone mineral density (BMD), 72 had osteopenia, and 81
 were diagnosed with OP. Radiographic findings of hip OA were seen in 43.8%, 52.8%, and 39.5% of the
 normal BMD, osteopenic, and OP groups, respectively (p < 0.05). OA was significantly correlated with
 total hip volume (r = 0.21), intertrochanteric cortical volume (r = 0.25), and trochanteric trabecular
 volume (r = 0.20). In each densitometric group, significant differences in hip geometry and BMD were
 found between the OA and non-OA subgroups. Hip OA and OP often coexist. In postmenopausal
 women, these diseases coexist in 40% of cases. Both OA and OP affect hip geometry and biomechanics.
 OA does so regardless of densitometric status. Changes are mostly reflected in the cortical bone.
 OA leads to significant changes in buckling ratio (BR) in both OP and non-OP women.

 Keywords: quantitative computed tomography; hip; osteoarthritis; osteoporosis

1. Introduction
     The prevalence of osteoarthritis (OA) increases with age [1–4], as does osteoporosis (OP) [5–7].
The relationship between the diseases remain unclear, with variable reports on their coexistence [8–11].
     In adults, bone shape continues to be affected by periosteal apposition (modeling) and endosteal
resorption and formation (remodeling), resulting in substantial alteration of bone shape and size.
Pathological changes, i.e., OA and OP might add to the dynamics of these [12].
     Bone quality could not be solely attributed to BMD (bone mineral density) [13–15]. Bone
morphology and geometry considerably add to the strength model. Separate assessment of the
cortical and trabecular bones is necessary to distinguish the differences in their age-related changes,
biomechanics, and response to pharmacological and non-pharmacological treatments. The trabecular
bone is about eight times more metabolically active than the cortical bone and is subjected to early and
rapid changes with advancing age [13,14].

J. Clin. Med. 2019, 8, 669; doi:10.3390/jcm8050669                                www.mdpi.com/journal/jcm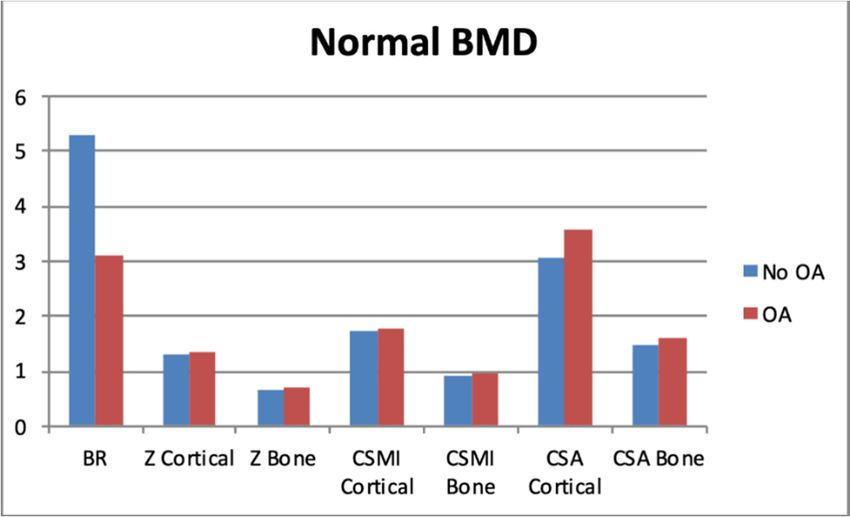
J. Clin. Med. 2019, 8, 669                                                                        2 of 10

     Quantitative computed tomography (QCT) allows analysis of all bone compartments, facilitating
the understanding of the three-dimensional bone structure and strength [12,16–20]. For these reasons,
increasing interest in QCT is noted in the literature recently [8,12–14,18–26].
     Both OA [27] and OP [28,29] affect hip geometry and strength, yet no quantitative radiological
data are comparing these in the literature. This study was aimed to compare proximal femur geometry
and biomechanics between postmenopausal women diagnosed with OA and and/or with OP, using
QCT, and to evaluate the extent to which the two diseases coexist in this group of patients.

2. Materials and Methods
     QCT- scans of the proximal femur of 175 consecutive postmenopausal women presenting with
low back (LBP) and groin pain to the emergency department or outpatient clinic were collected.
     A multi-detector-row CT (computed tomography) scanner (Aquilion16, Toshiba Medical Systems
Corporation, Tokyo, Japan) at the Radiology Department was used for evaluation of both the lumbar
spine and proximal femurs. Patients were scanned with conditions adjusted to 120 kV, 250 mA,
reconstruction thickness of 0.5 mm, and spatial resolution of 0.625 × 0.625 mm. For the proximal femur
analysis, patients were placed on a supine position with the solid calibration phantom (Mindways,
Austin, TX, USA) placed beneath the patient between the hips. The region scanned extended just above
the femoral head to 3.5 cm below the lesser trochanter. The CT scanner table height was set at the level
of the greater trochanter.
     Participants were categorized into subgroups due to OA (radiographic signs) and due to OP based
on BMD T-scores/or presence of osteoporotic vertebral compression fracture. Patients with chronic
endocrine diseases, taking antiresorptive drugs, and after total hip arthroplasties were excluded from
the study. The institutional review board approved the study. Informed consent was obtained from
the patients before study participation.
     Proximal femur analysis was performed using the QCT Pro Bone Investigational Toolkit (BIT,
Mindways, Austin, TX, USA) [30]. All volumetric bone mineral density (vBMD) measurements and
structural characteristics were extracted from our QCT Pro BIT database. The software separated the
cortical bone based on a fixed threshold of 350 mg/cm3 for all CT scans. The narrow femoral neck
(FN) region was found automatically as a perpendicular plane to the FN axis where the approximate
diameter ratio (superior-inferior and anterior-posterior) was 1.4, producing the lowest cross-sectional
area (CSA) of the FN. The produced cross-section was then divided automatically into 16 sectors
(defined by equal angles of 22.5◦ ) with the origin at the center of the mass. For all sectors, vBMD was
assessed separately for trabecular and cortical compartments. FN angle, width, overall CSA, volume,
and mass, hip axis length, cross-sectional moment of inertia (CSMI), section modulus (Z), and buckling
ratio (BR) were measured using BIT.
     The Z is a measure for withstanding bending stress. QCT Pro evaluates section modulus
along the strongest (Zmax—from the geometric center to periosteal surface) and weakest axis
(Zmin—corresponding periosteal distance along orthogonal to Zmax axis), which combined reflect
the ability to withstand torsion. CSMI is a derivative of section modulus, and measures the mass
distribution relative to the geometric center reflecting how effective a cross-section is at resisting
bending and torsion—depending on the axis chosen for calculation. Both Z and CSMI assume
homogenous distribution of cortical bone, however differences in porosity and mineralization lead to
varied voxel density. To address this, each voxel’s area is multiplied by the ratio of measured cortical
density to physiologic bone density to produce density-weighted Z and CSMI (DW-Z, DW-CSMI).
     The BR reflects strength against compressive stress leading to sudden sideways deflection of the
structural member. BR is a measure of cortical instability consequential of excessive cortical thinning.
BR relates the cortical thickness to the width of the femoral neck.
     Apart from the structural characteristics, we also evaluated density measures of the proximal
femurs, taking note of any signs of hip joint OA. The OA and sub-OA subgroups were defined based
on the hip joint CT assessment of cartilage destruction, and the presence of osteophytes. Lumbar spine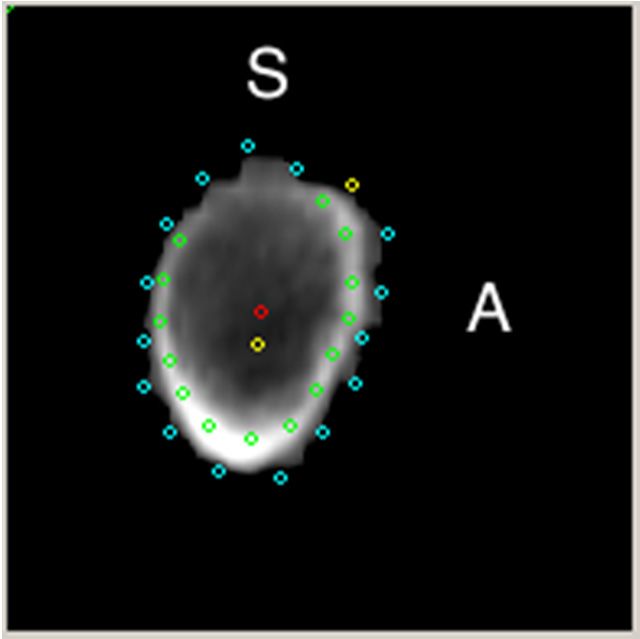
J. Clin. Med. 2019, 8, 669 3 of 10
scans were evaluated to identify vertebral compression fractures. Diagnosis of OP was based on the
QCT BMD criteria of the T score values using the National Health and Nutrition Examination Survey
(NHANES) DXA for hip QCT [19].
All of the analyses were carried out using TIBCO Software Inc. (2017) Statistica (data analysis
software system), version 13.1. Descriptive statistics of all variables were calculated. Normally
distributed quantitative variables were compared using the Student t-test; and non-normally distributed
categorical variables were compared using the U-Mann Whitney test and Kruskall–Wallis test.
Correlations between variables were calculated using Spearman’s Rank Correlation Coefficient.
The statistical level of significance was set at p = 0.05.
3. Results
3.1. Participants’ Baseline Characteristics
In the 175 postmenopausal women included in this study, the mean age was 68.8 years (standard
deviation (SD) 11.26 years, standard error (SE) 0.85 years), mean weight was 64.4 kg (SD 14.9 kg,
SE 4.87 kg), and mean height was 159 cm (SD 6 cm, SE 0.45 cm). Among the women, 12% had a normal
BMD, 41.1% met the densitometric criteria of osteopenia, and 46.9% were diagnosed with OP. Data on
patients’ baseline characteristics are summarized in Table S1.
Radiographic signs of hip OA were seen in 43.8%, 52.8%, and 39.5% in the normal BMD, osteopenic,
and OP groups (p < 0.05).
Nearly one-half (79 women −45%) of women had radiographic signs of at least unilateral hip
OA, whereas 45 (25.7%) sustained at least one vertebral compression fracture in the lumbar spine,
with 20 women (25.3%) having OA as a coexisting disease. Overall, 70 (40%) women had decreased
BMD (either osteopenia or OP) combined with radiographic hip OA, with 32 women (18.3% overall,
45.7% of the OA group) being osteoporotic.
Spearman’s rank correlation coefficient showed a weak, yet significant association between hip
OA and history of hip fracture (not site-matched), and the moderate association between densitometric
status and history of vertebral fractures (r = 0.16, p < 0.05 and r = 0.28, p < 0.05, respectively).
3.2. Morphological and Densitometric Findings
A number of morphological and densitometric measures proved to be significantly different
between the OA and non-OA subgroups (Table S2). FN characteristics (angle, width, and height) were
not different between the OA and non-OA subgroups, regardless of densitometric status. However,
the FN volume was significantly different in the patients with a decrease in overall BMD.
Patients’ physical characteristics were mostly correlated with hip axis length and total hip volume
(r = 0.36 and r = 0.46, respectively—p < 0.05), mostly reflected in the volume of the intertrochanteric
region (r = 0.43, p < 0.05). Weight was overall less correlated with hip characteristics but was mostly
correlated with cortical indices, such as total hip and intertrochanteric cortical volumes (r = 0.36 and
r = 0.38, respectively; p < 0.05). Hip BMD measurements did not reach those levels of association.
FN morphology expressed in angle, width, and length was mostly correlated with total hip and
trochanteric cortical volumes (r = 0.55 and r = 0.57, respectively; p < 0.05). Morphological indices of
FN were mostly insignificantly correlated with BMD measurements. Those that reached a level of
statistical significance had weak correlations.
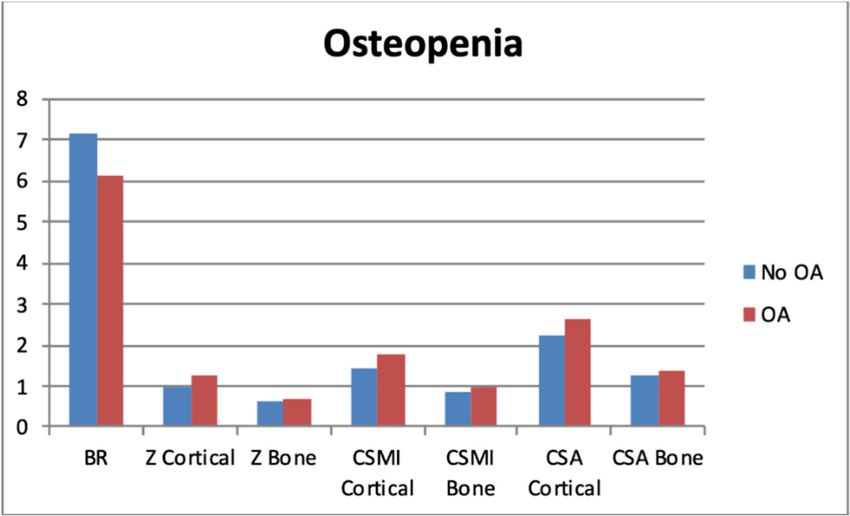
3.3. Biomechanical Findings
Collective biomechanical data of patients’ subgroups (OA vs. non-OA) are presented in Figure 1.
The gradual increase in BR with decreasing BMD can be noted from our data. There was a decrease in
Z, CSMI, and CSA across the groups (separately cortical and whole bone).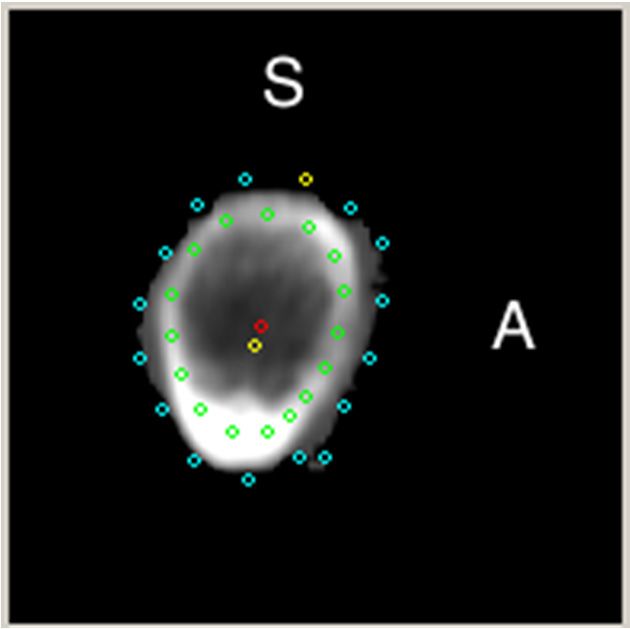
J. Clin. Med. 2019, 8, 669 4 of 10
J.
J. Clin.
Clin. Med.
Med. 2019,
2019, 8,
8, xx FOR
FOR PEER
PEER REVIEW
REVIEW 44 of
of 10
10
(a)
(a) (b)
(b)
Figure
Figure 1.1. Differences
1.Differences
Differences between
between
between cross-sectional
cross-sectional
cross-sectional area (CSA)
area and
area (CSA) (CSA) and
and biomechanical
biomechanical
biomechanical characteristics,
characteristics,
characteristics, depending
depending
on
depending on
on densitometric
densitometric status—separate
densitometric status—separate graphs
graphs for patients
status—separate with
graphs for patients
for(1b) with
with (1b)
and without
patients and
and without
(1a) osteoarthritis
(1b) (1a)
without(OA).
(1a)
osteoarthritis
Please (OA).
refer to(OA).
osteoarthritis Please
“Methods”. refer to “Methods”.
Cross-sectional
Please refer Cross-sectional
moment
to “Methods”. moment
of inertia (CSMI).
Cross-sectional of inertia (CSMI).
moment of inertia (CSMI).
In
In the
the normal
normal BMD
BMD group,
group, all
group, all indices,
all indices, except
indices, except cortical
except cortical CSMI,
cortical CSMI, were
CSMI, were significantly
were significantly different
significantly different between
different between
the
the OA
OA and
and non-OA subgroups. In
non-OA subgroups. In the
In the osteopenia
the osteopenia and
osteopenia and OP
and OP groups,
OP groups, the
groups, the differences
differences reach
reach statistical
statistical
significance
significance in
in all
all measurements
measurements (Figure
(Figure 2).
2).
(a)
(a)
(b)
(b)
Figure
Figure 2.2. Differences
2.Differences
Differences between
between
between cross-sectional
cross-sectional area
area (CSA)
cross-sectional (CSA)
area and and
and biomechanical
biomechanical
(CSA) characteristics,
characteristics,
biomechanical depending
characteristics,
depending
on the on
presence the
of presence of
osteoarthritis osteoarthritis
(OA)—separate (OA)—separate
graphs for graphs
patients for
with patients
normal BMD
depending on the presence of osteoarthritis (OA)—separate graphs for patients with normal with normal
(2a), BMD
osteopenia
BMD
(2a),
(2a), osteopenia
(2b), (2b),
(2b), and
and osteoporosis
osteopenia (2c).osteoporosis
and Please refer(2c).
osteoporosis Please
Please refer
refer to
to “Methods”.
(2c). to “Methods”.
“Methods”.
3.4.
3.4. Sectors
Sectors
J.
J. Clin.
Clin. Med.
Med. 2019,
2019, 8,
8, x;
x; doi:
doi: FOR
FOR PEER
PEER REVIEW
REVIEW www.mdpi.com/journal/jcm
www.mdpi.com/journal/jcm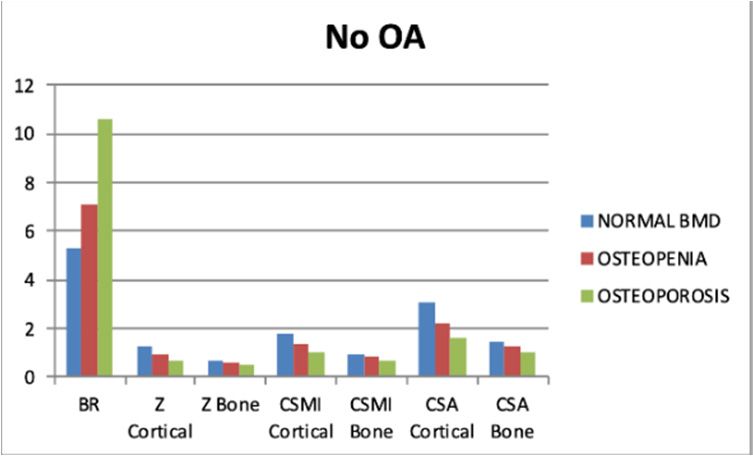
J. Clin. Med. 2019, 8, 669                                                                                        5 of 10

3.4.
J. Clin.Sectors
         Med. 2019, 8, x FOR PEER REVIEW                                                                          5 of 10

    Each sector was characterized by its perimeter, average cortical BMD, average trabecular BMD,
    Each
average   sectorthickness,
        cortical  was characterized by to
                            normalized itsBMD
                                          perimeter, average
                                               cortical       cortical
                                                        thickness,      BMD, average
                                                                   the average        trabecular
                                                                               distance          BMD,
                                                                                        from the center
average cortical thickness, normalized to BMD  cortical thickness, the average distance from the
of mass to the cortex, and average distance from the geometric center to the cortex (Figure 3).  center
of mass to the cortex, and average distance from the geometric center to the cortex (Figure 3).

                                                          (a)

                                                          (b)

                                                          (c)
      Figure 3. TheThe narrow
                       narrow femoral
                               femoral neck
                                         neck region
                                               region was
                                                      was found
                                                           found automatically
                                                                   automatically as  as a perpendicular
                                                                                          perpendicular plane
                                                                                                           plane to
      femoral
      femoral neck axis where the approximate diameter ratio (superior-inferior
                                                                    (superior-inferior and anterior-posterior)
                                                                                                anterior-posterior)
      was 1.4—producing the lowest cross-sectional area of the femoral neck. Note marked boundaries of
      16 sectors (from the most top, clockwise—Figure         Figure 3a
                                      clockwise—figure 3c). Figure   3a -- aa cross-section
                                                                              cross-section of
                                                                                            of patient
                                                                                               patient with
                                                                                                       with normal
                                                                                                            normal
      BMD, in Figure
                figure 3b3b analogous
                            analogous region
                                        region in a patient
                                                    patient with
                                                             with osteoporosis.
                                                                  osteoporosis. Note Note the diminished cortical
      thickness ininpostero-superior
                     postero-superiorregion withwith
                                        region   decreased  BMD.BMD.
                                                      decreased   S—superior,     A—anterior,
                                                                          S—superior,           red dot—geometric
                                                                                          A—anterior,    red dot—
      center, yellow  dot—center  of  mass.
      geometric center, yellow dot—center of mass.

     In the supero-posterior region (13th–16th sectors), there were no significant differences between
the normal BMD and osteopenic groups in the average trabecular BMD. In the posterior overlapping
region (10th–14th sectors), there were no significant differences between the osteopenic and OP

J. Clin. Med. 2019, 8, x; doi: FOR PEER REVIEW                                              www.mdpi.com/journal/jcm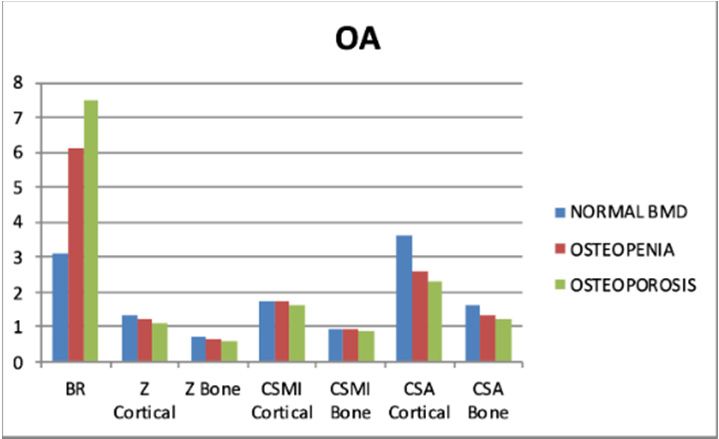
J. Clin. Med. 2019, 8, 669                                                                                 6 of 10

      In the supero-posterior region (13th–16th sectors), there were no significant differences between
the normal BMD and osteopenic groups in the average trabecular BMD. In the posterior overlapping
region (10th–14th sectors), there were no significant differences between the osteopenic and OP groups
in the average cortical BMD. All other measurements of the abovementioned characteristics were
statistically significant among the normal BMD, osteopenic, and OP groups.
      Spearman’s rank correlation coefficient showed no significant association between age and
cortical/trabecular BMD in the 10th–12th sectors of the femoral neck (infero-posterior part). At the same
time, significant correlations with average cortical thickness were found across all sectors. The highest
correlations were produced by adjacent sectors of the super-posterior/superior region [i.e., 15th, 16th,
1st, and 2nd sectors (r = −0.20 to r = −0.22, p < 0.05)]. Intersector correlations were the strongest between
adjacent sectors (of the same region), in terms of average cortical thickness (up to r = 0.84–0.85 for the
8th, 9th, and 10th sectors), average trabecular BMD (up to r = 0.7–0.76 for the 4th, 5th, and 6th sectors),
and average cortical BMD (up to r = 0.85 for the 15th and 16th sectors). Among the individual sectors,
the average trabecular BMD of the 10th sector was least significantly correlated with measurements of
other sectors. Most commonly, inverse intersector correlations between average trabecular and cortical
BMD were noted across all sectors.

4. Discussion
     In this study, we retrospectively investigated the coexistence of OP and hip OA in postmenopausal
women, and their quantitative effect on proximal femur geometry and biomechanics. Associations
between proximal femur three-dimensional architecture, cortical bone geometry and strength were
presented in previous studies [15,31]. Yet, there are no reports comparing OA and OP.
     In this studied cohort, we showed the prevalence of OP in the group with radiographically proven
hip OA (45.7%); of these, >25% sustained a vertebral compression fracture. If we include osteopenia,
the conditions coexist in 70 of 79 women with OA, which is higher compared to that reported in large
prospective population-based cohorts (20.7–28%).
     Our research focused on postmenopausal Caucasian women. Borggrefe et al. [12] investigated a
large cohort of older men, which were categorized according to the history of hip fracture. QCT-derived
measures of the femoral neck region showed more correlation between vBMD and Z or BR (Z − r =
0.47 vs. rnormal = 0.13, rosteopenia = 0.39, rosteoporosis = 0.64; rnormal was not statistically significant; BR −
r = −0.79 vs. rnormal = −0.81, rosteopenia = −0.72, rosteoporosis = −0.64). Both groups were older than the
women in our study, regardless of the densitometric status (mean 73.3–77.1 years vs. 63.1–71.8 years).
This discrepancy implies that gender-dependent proximal femur geometry contributes significantly to
the ability to withstand stress. Indeed, Yates et al. found in their hip structural analysis (HSA)-based
study, significant gender differences in hip structural geometry [32].
     Furthermore, the differences increased with age. The differences were seen in CSA (cross-sectional
area), outer diameter, cortical thickness, Z, and BR in both the femoral neck and intertrochanteric
regions. The findings were subsequently confirmed in a large QCT-based prospective population
study [33]. There is a recognized tendency of femoral neck expansion [8,12,32]. Periosteal apposition
leads to an increasing CSA of the femoral neck with age. The endosteal expansion resulting in widening
of the endosteal cavity can impact the stability of the femoral implant. In our group, cortical CSA of the
femoral neck decreased with decreasing BMD. Total hip volume (cortical and trabecular bone volumes
combined) differed between non-OP and OP women (266.1 cm3 vs. 198.7 cm3 ), but the difference was
non-significant. When comparing their hip compartments, both groups showed significant difference.
Overall, we observed, contrary to previous reports [8,12,32] that the OP group was characterized by
smaller volumes of different hip regions (total hip, femoral neck, greater trochanter, intertrochanteric
zone, and Ward’s triangle). This could be partially attributed to the less robust physical characteristics
(both weight and height). Indeed, these were mostly correlated with hip axis length and total hip
volume and mostly reflected in the volume of the intertrochanteric region [15]. Weight was overall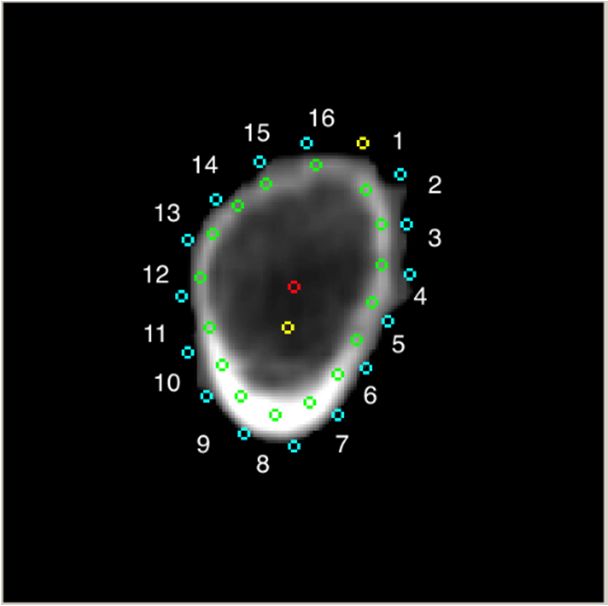
J. Clin. Med. 2019, 8, 669                                                                           7 of 10

weakly but significantly correlated with hip characteristics, mostly with cortical indices such as total
hip and intertrochanteric cortical volumes.
      The differences in the presence of OA in each densitometric group showed significantly higher
volumes in the cortical compartments in most regions in women with OA. The differences were not
conspicuous in trabecular compartments or overall. The presence of osteophytes contributing to the
increased in cortical volume might explain these observations. Volumetric data were reflected in
the biomechanical measurements for all densitometric groups. The OA affected hips showed better
mechanical strength. The angle, width, and height of the femoral neck did not show any differences
between OA and non-OA subgroups, regardless of the densitometric status. The femoral neck is an
area that usually does not encompass osteophytosis.
      Although the superior-posterior region undergoes gradual cortical thinning, the infero-posterior
region of the femoral neck cross-section is least likely to be affected by age-related changes. This is
in accordance with previous observations of femoral neck fractures, in which the decline in cortical
thickness and density of the superior half of the femoral neck averaged to 3.3% per year and 1.2% per
year, respectively, which is in contrast to losses of 0.9% per year and 0.4% per year, respectively, in the
inferior femoral neck [23,34]. When comparing the normal BMD and osteopenic groups, there were
significant differences in the average trabecular BMD in the superior-posterior region, which is a
tendency not seen between the osteopenic and OP group. Thus, initially, the bone stock seemed to
deplete significantly in the trabecular compartment, whereas cortical thinning was more noticeable with
decreasing BMD. This observation was mentioned only once recently by Khoo et al. [8], who reported a
quadratic vs. linear loss of volumetric BMD in the cortical and trabecular compartments, respectively.
      QCT relative to DXA (dual-energy X-ray absorptiometry) allows analysis of all bone compartments.
It is more sensitive in detecting diminished BMD, since the measurement is not affected by obesity,
degenerative changes, joint space narrowing, calcifications and osteophytes [35–38]. It facilitates
the understanding of the three-dimensional bone structure, which can be helpful in preoperative
planning [39–41], and therapy monitoring—either medical or implant-focused.
      Diagnosis of OA could not exclude the diagnosis of OP, especially in the elderly. OP in OA
patients requires medical attention. Proximal femur or vertebral compression fracture could be the
eventual consequence of low bone mineral density, adding to overall morbidity and mortality in
these patients. Untreated OP patients undergoing THA (total hip arthroplasty)have higher intra- and
post-operative risks, such as those of intraoperative fracture, periprosthetic osteolysis with implant
migration, and postoperative periprosthetic fracture [42]. Postoperative antiresorptive medication
reduce the risk of revision surgery by almost 60% [42]. A novel local osteo-enhancement procedure
could serve as a preventive measure against proximal femur fracture [43].
      The present study has several limitations. First, our analysis was based on QCT findings,
which have recognized technical limitations particularly concerning partial volume effects in the
cortical regions, which are caused by the limited spatial resolution, and overall beam hardening
artifacts, which can influence the measurements [44]. Second, the study included Caucasian women;
thus, the results cannot be fully extrapolated to other populations. Despite its insufficiencies, the study
has its strengths. It was conducted with a cohort of considerable size. Secondly, it raises an issue
generally neglected in studies on OA and OP, wherein patients presenting with specific complaints
(in our case LBP and groin pain) may prompt the treating physician to consider that the symptoms
could be caused by osteoporotic vertebral fractures (a consequence of OP), which requires prompt
medical attention, both general and, if OA patients are to referred to joint arthroplasty, implant oriented.

5. Conclusions
     Hip OA and OP often coexist. In postmenopausal women, these diseases may coexist in 40% of
cases. Both OA and OP differently affect hip geometry and biomechanics. OA does so regardless of
densitometric status, yet the discrepancy increased with a decline in bone stock. Changes are mostly
reflected in the cortical bone—total hip cortical BMD and volume, intertrochanteric cortical BMD and
J. Clin. Med. 2019, 8, 669 8 of 10
volume, and CSA, especially. Sectoral analysis showed cortical thinning in the superior-posterior
region of FN in women with OP, while osteopenia initially leads to trabecular loss in the same region.
In terms of biomechanics, OA leads to significantly notable decrease in BR of both OP and non-OP
women, and significant increase in Z and CSMI. QCT clearly shows the density and the architecture
of the proximal femur from a broader perspective to researchers as well as orthopedic surgeons and
practicing clinicians.
Supplementary Materials: The following are available online at http://www.mdpi.com/2077-0383/8/5/669/s1.
Table S1: Patients’ baseline characteristics. Mean values of selected morphometric and densitometric characteristics
in BMD-based groups, Table S2: Results (p-values) of U Mann-Whitney test comparing different densitometric
groups with regard to presence of radiographic signs of hip osteoarthritis.
Author Contributions: Conceptualization, J.N. and W.M.G.; Methodology, J.N. and W.M.G.; Software, J.N. and
W.M.G.; Validation, J.N.; Formal Analysis, J.N and W.M.G.; Investigation, J.N. and W.M.G.; Data Curation, J.N.
and W.M.G.; Writing—Original Draft Preparation, J.N. and W.M.G.; Writing—Review & Editing, J.N. and W.M.G.;
Supervision, W.M.G.; Funding Acquisition, W.M.G.
Funding: This research was supported by project NR13-0109-10/2010, which was funded by the National Center
for Research and Development, and partially by grant N404 695940, which was funded by the National Science
Center of Poland.
Acknowledgments: Authors thank J. Konfederak for technical assistance and M. Goł˛ebiowski for
organizational support.
Conflicts of Interest: Authors declare no conflict of interest.
References
1. Postler, A.; Ramos, A.L.; Goronzy, J.; Gunther, K.P.; Lange, T.; Schmitt, J.; Zink, A.; Hoffmann, F. Prevalence
and treatment of hip and knee osteoarthritis in people aged 60 years or older in Germany: An analysis based
on health insurance claims data. Clin. Interv. Aging 2018, 13, 2339–2349. [CrossRef]
2. Endres, H.; Schneider, O.; Scharf, H.P.; Kaufmann-Kolle, P.; Knapstein, S.; Hermann, C.; Lembeck, B.;
Flechtenmacher, J. Hip Osteoarthritis—Epidemiology and Current Medical Care Situation—Health Care
Data of 2.4 Million AOK Baden-Wurttemberg Insurees Aged 40 Years or Older. Z. Orthop. Unfall. 2018,
156, 672–684. [CrossRef] [PubMed]
3. Lespasio, M.J.; Sultan, A.A.; Piuzzi, N.S.; Khlopas, A.; Husni, M.E.; Muschler, G.F.; Mont, M.A. Hip
Osteoarthritis: A Primer. Perm. J. 2018, 22. [CrossRef] [PubMed]
4. Kiadaliri, A.A.; Lohmander, L.S.; Moradi-Lakeh, M.; Petersson, I.F.; Englund, M. High and rising burden
of hip and knee osteoarthritis in the Nordic region, 1990–2015. Acta Orthop. 2018, 89, 177–183. [CrossRef]
[PubMed]
5. Agrawal, N.K.; Sharma, B. Prevalence of osteoporosis in otherwise healthy Indian males aged 50 years and
above. Arch. Osteoporos. 2013, 8, 116. [CrossRef] [PubMed]
6. Schray, D.; Neuerburg, C.; Stein, J.; Gosch, M.; Schieker, M.; Bocker, W.; Kammerlander, C. Value of a
coordinated management of osteoporosis via Fracture Liaison Service for the treatment of orthogeriatric
patients. Eur. J. Trauma Emerg. Surg. 2016, 42, 559–564. [CrossRef]
7. Cipriani, C.; Pepe, J.; Bertoldo, F.; Bianchi, G.; Cantatore, F.P.; Corrado, A.; Di Stefano, M.; Frediani, B.; Gatti, D.;
Giustina, A.; et al. The epidemiology of osteoporosis in Italian postmenopausal women according to the National
Bone Health Alliance (NBHA) diagnostic criteria: A multicenter cohort study. J. Endocrinol. Investig. 2018,
41, 431–438. [CrossRef]
8. Khoo, B.C.; Brown, J.K.; Prince, R.L. Reconsideration of the Effects of Age on Proximal Femur Structure:
Implications for Joint Replacement and Hip Fracture. PLoS ONE 2016, 11, e0164949. [CrossRef]
9. Foss, M.V.; Byers, P.D. Bone density, osteoarthrosis of the hip, and fracture of the upper end of the femur.
Ann. Rheum. Dis. 1972, 31, 259–264. [CrossRef]
10. Stewart, A.; Black, A.J. Bone mineral density in osteoarthritis. Curr. Opin. Rheumatol. 2000, 12, 464–467.
[CrossRef] [PubMed]
11. Bultink, I.E.; Lems, W.F. Osteoarthritis and osteoporosis: What is the overlap? Curr. Rheumatol. Rep. 2013,
15, 328. [CrossRef] [PubMed]J. Clin. Med. 2019, 8, 669 9 of 10
12. Borggrefe, J.; de Buhr, T.; Shrestha, S.; Marshall, L.M.; Orwoll, E.; Peters, K.; Black, D.M.; Gluer, C.C.;
Osteoporotic Fractures in Men Study Research, G. Association of 3D Geometric Measures Derived From
Quantitative Computed Tomography With Hip Fracture Risk in Older Men. J. Bone Miner. Res. 2016,
31, 1550–1558. [CrossRef] [PubMed]
13. Lang, T.F.; Guglielmi, G.; van Kuijk, C.; De Serio, A.; Cammisa, M.; Genant, H.K. Measurement of bone
mineral density at the spine and proximal femur by volumetric quantitative computed tomography and
dual-energy X-ray absorptiometry in elderly women with and without vertebral fractures. Bone 2002,
30, 247–250. [CrossRef]
14. Lang, T.F.; Keyak, J.H.; Heitz, M.W.; Augat, P.; Lu, Y.; Mathur, A.; Genant, H.K. Volumetric quantitative
computed tomography of the proximal femur: Precision and relation to bone strength. Bone 1997, 21, 101–108.
[CrossRef]
15. Glinkowski, W.; Ciszek, B. Anatomy of the Proximal Femur-geometry and architecture. Morphologic
investigation and literature review. Ortop. Traumatol. Rehabil. 2002, 4, 200–208. [PubMed]
16. Hayes, W.C.; Piazza, S.J.; Zysset, P.K. Biomechanics of fracture risk prediction of the hip and spine by
quantitative computed tomography. Radiol. Clin. N. Am. 1991, 29, 1–18.
17. Kroger, H.; Lunt, M.; Reeve, J.; Dequeker, J.; Adams, J.E.; Birkenhager, J.C.; Diaz Curiel, M.; Felsenberg, D.;
Hyldstrup, L.; Kotzki, P.; et al. Bone density reduction in various measurement sites in men and women with
osteoporotic fractures of spine and hip: The European quantitation of osteoporosis study. Calcif. Tissue Int. 1999,
64, 191–199. [CrossRef]
18. Lochmuller, E.M.; Burklein, D.; Kuhn, V.; Glaser, C.; Muller, R.; Gluer, C.C.; Eckstein, F. Mechanical strength of
the thoracolumbar spine in the elderly: Prediction from in situ dual-energy X-ray absorptiometry, quantitative
computed tomography (QCT), upper and lower limb peripheral QCT, and quantitative ultrasound. Bone
2002, 31, 77–84. [CrossRef]
19. Khoo, B.C.; Brown, K.; Cann, C.; Zhu, K.; Henzell, S.; Low, V.; Gustafsson, S.; Price, R.I.; Prince, R.L.
Comparison of QCT-derived and DXA-derived areal bone mineral density and T scores. Osteoporos. Int.
2009, 20, 1539–1545. [CrossRef]
20. Adams, J.E. Quantitative computed tomography. Eur. J. Radiol. 2009, 71, 415–424. [CrossRef]
21. Prevrhal, S.; Fuerst, T.; Fan, B.; Njeh, C.; Hans, D.; Uffmann, M.; Srivastav, S.; Genant, H.K. Quantitative
ultrasound of the tibia depends on both cortical density and thickness. Osteoporos. Int. 2001, 12, 28–34.
[CrossRef]
22. Engelke, K.; Adams, J.E.; Armbrecht, G.; Augat, P.; Bogado, C.E.; Bouxsein, M.L.; Felsenberg, D.; Ito, M.;
Prevrhal, S.; Hans, D.B.; et al. Clinical use of quantitative computed tomography and peripheral quantitative
computed tomography in the management of osteoporosis in adults: The 2007 ISCD Official Positions.
J. Clin. Densitom. 2008, 11, 123–162. [CrossRef]
23. Johannesdottir, F.; Turmezei, T.; Poole, K.E. Cortical bone assessed with clinical computed tomography at the
proximal femur. J. Bone Miner. Res. 2014, 29, 771–783. [CrossRef]
24. Engelke, K.; Lang, T.; Khosla, S.; Qin, L.; Zysset, P.; Leslie, W.D.; Shepherd, J.A.; Shousboe, J.T. Clinical Use of
Quantitative Computed Tomography-Based Advanced Techniques in the Management of Osteoporosis in
Adults: The 2015 ISCD Official Positions—Part III. J. Clin. Densitom. 2015, 18, 393–407. [CrossRef]
25. Marques, E.A.; Gudnason, V.; Sigurdsson, G.; Lang, T.; Johannesdottir, F.; Siggeirsdottir, K.; Launer, L.;
Eiriksdottir, G.; Harris, T.B. Are bone turnover markers associated with volumetric bone density, size,
and strength in older men and women? The AGES-Reykjavik study. Osteoporos. Int. 2016, 27, 1765–1776.
[CrossRef]
26. Sfeir, J.G.; Drake, M.T.; Atkinson, E.J.; Achenbach, S.J.; Camp, J.J.; Tweed, A.J.; McCready, L.K.; Yu, L.;
Adkins, M.C.; Amin, S.; et al. Evaluation of cross-sectional and longitudinal changes in volumetric
bone mineral density in postmenopausal women using single- versus dual-energy quantitative computed
tomography. Bone 2018, 112, 145–152. [CrossRef]
27. Fazzalari, N.L.; Forwood, M.R.; Smith, K.; Manthey, B.A.; Herreen, P. Assessment of cancellous bone quality
in severe osteoarthrosis: Bone mineral density, mechanics, and microdamage. Bone 1998, 22, 381–388.
[CrossRef]J. Clin. Med. 2019, 8, 669 10 of 10
28. Kaneko, M.; Ohnishi, I.; Matsumoto, T.; Ohashi, S.; Bessho, M.; Hayashi, N.; Tanaka, S. Prediction of proximal
femur strength by a quantitative computed tomography-based finite element method—Creation of predicted
strength data of the proximal femur according to age range in a normal population. Mod. Rheumatol. 2016,
26, 151–155. [CrossRef] [PubMed]
29. Glinkowski, W.; Wojnarowski, J. Finite element modeling of strength of proximal femoral end during
osteoporosis.(pol.). Post. Osteoartrol. 1995, 7, 61–66.
30. Cann, C.E.; Adams, J.E.; Brown, J.K.; Brett, A.D. CTXA hip—An extension of classical DXA measurements
using quantitative CT. PLoS ONE 2014, 9, e91904. [CrossRef]
31. Glinkowski, W.; Ciszek, B. The topographic and comparative study of the calcar femorale. Folia Morphol.
1989, 48, 183–191.
32. Yates, L.B.; Karasik, D.; Beck, T.J.; Cupples, L.A.; Kiel, D.P. Hip structural geometry in old and old-old age:
Similarities and differences between men and women. Bone 2007, 41, 722–732. [CrossRef]
33. Johannesdottir, F.; Aspelund, T.; Reeve, J.; Poole, K.E.; Sigurdsson, S.; Harris, T.B.; Gudnason, V.G.;
Sigurdsson, G. Similarities and differences between sexes in regional loss of cortical and trabecular bone
in the mid-femoral neck: The AGES-Reykjavik longitudinal study. J. Bone Miner. Res. 2013, 28, 2165–2176.
[CrossRef]
34. Johannesdottir, F.; Poole, K.E.; Reeve, J.; Siggeirsdottir, K.; Aspelund, T.; Mogensen, B.; Jonsson, B.Y.;
Sigurdsson, S.; Harris, T.B.; Gudnason, V.G.; et al. Distribution of cortical bone in the femoral neck and hip
fracture: A prospective case-control analysis of 143 incident hip fractures; the AGES-REYKJAVIK Study.
Bone 2011, 48, 1268–1276. [CrossRef]
35. Smith, J.A.; Vento, J.A.; Spencer, R.P.; Tendler, B.E. Aortic calcification contributing to bone densitometry
measurement. J. Clin. Densitom. 1999, 2, 181–183. [CrossRef]
36. Liu, G.; Peacock, M.; Eilam, O.; Dorulla, G.; Braunstein, E.; Johnston, C.C. Effect of osteoarthritis in the
lumbar spine and hip on bone mineral density and diagnosis of osteoporosis in elderly men and women.
Osteoporos. Int. 1997, 7, 564–569. [CrossRef] [PubMed]
37. Guglielmi, G.; Floriani, I.; Torri, V.; Li, J.; van Kuijk, C.; Genant, H.K.; Lang, T.F. Effect of spinal degenerative
changes on volumetric bone mineral density of the central skeleton as measured by quantitative computed
tomography. Acta Radiol. 2005, 46, 269–275. [CrossRef] [PubMed]
38. Yu, E.W.; Thomas, B.J.; Brown, J.K.; Finkelstein, J.S. Simulated increases in body fat and errors in bone
mineral density measurements by DXA and QCT. J. Bone Miner. Res. 2012, 27, 119–124. [CrossRef] [PubMed]
39. Sugano, N.; Ohzono, K.; Nishii, T.; Haraguchi, K.; Sakai, T.; Ochi, T. Computed-tomography-based computer
preoperative planning for total hip arthroplasty. Comput. Aided Surg. 1998, 3, 320–324. [CrossRef] [PubMed]
40. Huppertz, A.; Radmer, S.; Wagner, M.; Roessler, T.; Hamm, B.; Sparmann, M. Computed tomography for
preoperative planning in total hip arthroplasty: What radiologists need to know. Skelet. Radiol. 2014,
43, 1041–1051. [CrossRef]
41. Inoue, D.; Kabata, T.; Maeda, T.; Kajino, Y.; Fujita, K.; Hasegawa, K.; Yamamoto, T.; Tsuchiya, H. Value
of computed tomography-based three-dimensional surgical preoperative planning software in total hip
arthroplasty with developmental dysplasia of the hip. J. Orthop. Sci. 2015, 20, 340–346. [CrossRef] [PubMed]
42. Prieto-Alhambra, D.; Javaid, M.K.; Judge, A.; Murray, D.; Carr, A.; Cooper, C.; Arden, N.K. Association
between bisphosphonate use and implant survival after primary total arthroplasty of the knee or hip:
Population based retrospective cohort study. BMJ 2011, 343, d7222. [CrossRef] [PubMed]
43. Kanis, J.A.; Cooper, C.; Rizzoli, R.; Reginster, J.Y.; Scientific Advisory Board of the European Society for
Clinical and Economic Aspects of Osteoporosis (ESCEO); The Committees of Scientific Advisors and National
Societies of the International Osteoporosis Foundation (IOF). European guidance for the diagnosis and
management of osteoporosis in postmenopausal women. Osteoporos. Int. 2019, 30, 3–44. [CrossRef]
[PubMed]
44. Hangartner, T.N.; Gilsanz, V. Evaluation of cortical bone by computed tomography. J. Bone Miner. Res. 1996,
11, 1518–1525. [CrossRef] [PubMed]
© 2019 by the authors. Licensee MDPI, Basel, Switzerland. This article is an open access
article distributed under the terms and conditions of the Creative Commons Attribution
(CC BY) license (http://creativecommons.org/licenses/by/4.0/).You can also read