Elevated CO2 Increases Root Mass and Leaf Nitrogen Resorption in Red Maple (Acer rubrum L.) - MDPI
←
→
Page content transcription
If your browser does not render page correctly, please read the page content below
Article
Elevated CO2 Increases Root Mass and Leaf Nitrogen
Resorption in Red Maple (Acer rubrum L.)
Li Li 1,2, *, William Manning 3 and Xiaoke Wang 2
 1    Bamboo Research Institute, Nanjing Forestry University, Nanjing 210037, China
 2    State Key Laboratory of Urban and Regional Ecology, Research Center for Eco-Environmental Sciences,
      Chinese Academy of Sciences, Beijing 100085, China; Wangxk@rcees.ac.cn
 3    Stockbridge School of Agriculture, University of Massachusetts, Amherst, MA 01003, USA;
      wmanning@umass.edu
 *    Correspondence: lili028@njfu.edu.cn

 Received: 26 March 2019; Accepted: 13 May 2019; Published: 15 May 2019

 Abstract: To understand whether the process of seasonal nitrogen resorption and biomass allocation
 are different in CO2 -enriched plants, seedlings of red maple (Acer rubrum L.) were exposed to
 three CO2 concentrations (800 µL L−1 CO2 treatments—A800, 600 µL L−1 CO2 treatments—A600,
 and 400 µL L−1 CO2 treatments—A400) in nine continuous stirred tank reactor (CSTR) chambers.
 Leaf mass per area, leaf area, chlorophyll index, carbon (C), nitrogen (N) contents, nitrogen resorption
 efficiency (NRE), and biomass allocation response were investigated. The results indicated that: (1)
 Significant leaf N decline was found in senescent leaves of two CO2 treatments, which led to an
 increase of 43.4% and 39.7% of the C/N ratio in A800 and A600, respectively. (2) Elevated CO2 induced
 higher NRE, with A800 and A600 showing significant increments of 50.3% and 46.2%, respectively.
 (3) Root biomass increased 33.1% in A800 and thus the ratio of root to shoot ratio was increased by
 25.8%. In conclusion, these results showed that to support greater nutrient and water uptake and the
 continued response of biomass under elevated CO2 , Acer rubrum partitioned more biomass to root
 and increased leaf N resorption efficiency.

 Keywords: elevated CO2; Acer rubrum; senescent leaf N; nitrogen resorption efficiency; biomass response

1. Introduction
      The initial effect of elevated CO2 increases net primary production (NPP) by enhancing leaf
photosynthesis in most plant communities. To sustain the high rates of forest NPP observed
under elevated CO2 , the requirement for nitrogen would also increase the close relationship of
photosynthesis [1] and the synthesis of proteins required for the construction and maintenance of
living tissue. However, studies confirm that growth at elevated CO2 results in significant reductions in
N content in leaves (mass basis) and a relatively higher C/N [2] ratio. Elevated CO2 which may cause
nitrogen (N) concentrations to decline in green leaves has been well investigated [3]. The possible
reasons for N decline in leaf include dilution effects [4], increase of less N demand (increased use
of photosynthetic nitrogen efficiency and downregulation of photosynthetic enzymes) [5–7], less
N available (carbon enrichment of the rhizosphere leads to progressively greater limitations of the
nitrogen available to plants) [7–9], and CO2 inhibition of nitrate assimilation [10]. Apart from this direct
effect on photosynthesis, sugar sensing and signaling pathways are reported as important pathways to
indirectly regulate the photosynthesis process [11].
      It is well known that elevated CO2 increases plant growth and leads to greater biomass production.
However, which plant organ is allocated the greater production of carbohydrates varies within and
between species. There is a wide range of root responses from large increases [12], to no response [13,14],

Forests 2019, 10, 420; doi:10.3390/f10050420                                     www.mdpi.com/journal/forests
Forests 2019, 10, 420 2 of 11
and decreased responses [15]. The functional balance of shoot root biomass partitioning models predict
that as plant tissue C/N ratios rise, root biomass allocation will increase to ensure greater uptake of N
to balance the extra C input due to elevated CO2 [16]. It is also reported that greater root growth is
related to the sugar signaling pathway which acts on regulating nutrient uptake and transport [11].
In addition, there has been considerable debate concerning whether elevated CO2 results in shifts
in the root to shoot ratio (R/S). Thus, identifying the ecological attributes that predict root responses
remains challenging.
Nutrient resorption is defined as the process by which nutrients are mobilized from senescent
leaves and transported to other plant parts [17]. The differences between nitrogen (N) in green
leaves and N of abscised leaves are dependent on the process of N resorption [18,19]. Nitrogen
resorption efficiency is calculated as N resorption divided by the initial N content (N in green leaves).
However, the reports of the effects of elevated CO2 on litter N are less than on green leaves [3,20].
Litter N inherently is more difficult to detect because factors that affect senescence and resorption are
increasingly variable. Although significant declines in green leaf N content in elevated CO2 have been
reported [18], few significant effects have been reported on N resorption independently of warming,
lacking light, soil nitrogen, and water conditions. Nitrogen resorption may become an increasingly
important source of N as a higher net primary production induced by elevated CO2 . Biomass allocation
will be a critical feature to address the environmental challenges, and its relationship to foliar N
resorption is poorly understood.
Red maple (Acer rubrum L.) was selected for this experiment because it is one of the most common
and widespread deciduous trees of eastern and central North America, growing on a wide range of
soil types in both moist and dry biomass. The main objective of the experiment is to study the leaf N
content, N resorption efficiency, and biomass allocation responses to elevated CO2 , independently of
warming, lacking light, soil nitrogen, and water conditions. We want to know whether the process of
seasonal leaf N resorption and biomass allocation are different in CO2 -enriched plants. The hypothesis
tested is that elevated CO2 would increase biomass allocation to the roots and increase leaf N resorption
for more N demand in a condition of adequate nutrients and water.
2. Materials and Methods
2.1. Experimental System and Design
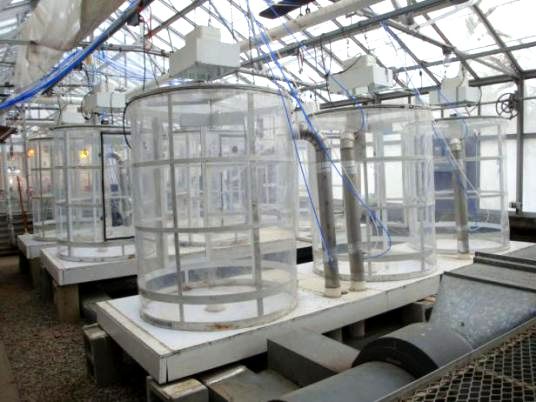
The experiment was investigated in nine continuously stirred tank reactor (CSTR) chambers
(Figure 1), which were located inside a glass greenhouse at the University of Massachusetts, Amherst.
More details of the operation of our CSTR chambers and CO2 control system have been described
previously [21–23] and the CO2 concentration fluctuation range was ±10 µL L−1 around the target
CO2 concentrations. The time course of irradiance inside the greenhouse was adjusted the day before
depending on the weather forecast, so that the irradiance inside the greenhouse was similar to the
natural environment. The photoperiod varied with the season outside the greenhouse, mostly from
6 a.m. to 7:30 p.m. All seedlings were exposed to natural light since the chambers were located
in a separate single glass greenhouse, but a supplementary irradiance was also supplied with nine
400 W metal Halide lights (Metal Arc, Sylvania, Worcester, MA, USA) in order to better simulate
outdoors irradiance.
The irradiance inside was 75%–85% of that outside. The maximum radio flux was 630 lx.
The temperature inside the greenhouse (only analyzed the day we collected data) varied from 18.16 ◦ C
to 35.8 ◦ C and the average value was 35.8 ◦ C. The relative humidity varied from 33.99% to 81.96%,
and the average value was 58%. The temperature and relative humidity were on average 4.8 ◦ C
higher and 15% lower than outside, respectively. The average temperature and relative humidity in
the 800 and 600 µL L−1 chambers were 0.34 ◦ C higher and 2% lower, respectively, than in the control
chamber [24]. CO2 concentration enrichment was started from June 26, 2014 to November 28, 2014 (156
days) with pure CO2 supplied continuously for 24 hours. One LI–7000 CO2 /H2 O analyzer monitorForests 2019, 10, 420 3 of 11
Forests 2019, 10, x FOR PEER REVIEW 3 of 11
was used to measure and record the CO2 concentration (Li–Cor Inc., Lincoln, NE, USA). The CO2
95 CO 2 concentration
concentration insideinside
everyevery chamber
chamber was checked
was checked and adjusted
and adjusted every every twoto
two days days
maketo sure
makethesure the
target
96 target CO 2 concentration settings could be reached. Three CO 2 concentration treatments
CO2 concentration settings could be reached. Three CO2 concentration treatments (800 µL L —A800, −1(800 µL
97 L −1—A800,−1 600 µL L −1—A600, and −1 400 µL L −1—A400) were set up randomly among nine chambers
600 µL L —A600, and 400 µL L —A400) were set up randomly among nine chambers with three
98 with three replications
replications each. Twenty-seven
each. Twenty-seven seedlings, seedlings,
uniform inuniform in basal diameter
basal diameter andwere
and height, height, were
carefully
99 picked up and divided into nine groups, so there were three seedlings grown inside each chamber.each
carefully picked up and divided into nine groups, so there were three seedlings grown inside All
100 chamber.
seedlings All seedlingswere
in chambers in chambers were watered
watered every other dayevery
with other day volume
the same with theofsame
watervolume of water
as needed.
101 as needed.
102
103 Figure 1.
Figure The nine
1. The nine continuously
continuously stirred
stirred tank
tank reactor
reactor (CSTR)
(CSTR) chambers
chambers in
in the
the experiment.
experiment.
2.2. Plant Material and Management
104 2.2. Plant Material and Management
Two-year-old nursery-grown red maple (Acer rubrum L.) seedlings grew from seeds (natural
105 Two-year-old nursery-grown red maple (Acer rubrum L.) seedlings grew from seeds (natural
settings) were obtained from the Forrest Keeling nursery (fknursery.com) in Elsberry. Red maple,
106 settings) were obtained from the Forrest Keeling nursery (fknursery.com) in Elsberry. Red maple,
one of the most common and widespread deciduous trees of eastern and central North America,
107 one of the most common and widespread deciduous trees of eastern and central North America, is
is adaptable to a very wide range of site conditions. All seedlings were transplanted immediately
108 adaptable to a very wide range of site conditions. All seedlings were transplanted immediately in
in 1-gallon pots to the greenhouse on June 3. The growing medium used in pots was an inorganic
109 1-gallon pots to the greenhouse on June 3. The growing medium used in pots was an inorganic
potting mixture (MM 300 growing medium) (SunGro, Washington, WA, USA). All seedlings were
110 potting mixture (MM 300 growing medium) (SunGro, Washington, WA, USA). All seedlings were
acclimated to the greenhouse environment from June 3 to June 25 (23 days) until all seedlings grew
111 acclimated to the greenhouse environment from June 3 to June 25 (23 days) until all seedlings grew
well, then all seedlings with pots were moved into the CSTR chambers on June 26. All seedlings were
112 well, then all seedlings with pots were moved into the CSTR chambers on June 26. All seedlings
well-watered every other day. All seedlings were fertilized with a soluble fertilizer (16–17–18; Peters
113 were well-watered every other day. All−1seedlings were fertilized with a soluble fertilizer (16–17–18;
Professional; Scotts, OH, USA) (3.9 g L ) every week and a micronutrient soluble trace element mix
114 Peters Professional;
−1 Scotts, OH, USA) (3.9 g L−1) every week and a micronutrient soluble trace
(36.9 mg L ) [22] was applied once on August 8.
115 element mix (36.9 mg L−1) [22] was applied once on August 8.
2.3. Leaf Chlorophyll Index
116 2.3. Leaf Chlorophyll Index
The chlorophyll index was measured weekly on the same marked leaves used for leaf area,
117 The
measuring chlorophyll
N content index
weeklywas frommeasured weekly
September oncomplete
5 until the samesenescence
marked leavesusingused for leaf area,
a nondestructive
118 measuring N content weekly from September 5 until complete senescence
SPAD-502 chlorophyll meter (Konica Minolta, Tokyo, Japan). SPAD, a surrogate expressed for using a nondestructive
119 SPAD-502
chlorophyllchlorophyll meterthe
index, estimated (Konica
amount Minolta, Tokyo, Japan).
of chlorophyll present SPAD, a surrogate
by measuring expressed
the amount for
of light
120 chlorophyll index, estimated the amount of chlorophyll present by measuring
transmitting through a leaf. The Minolta SPAD has two LEDs that emit red (650 nm, chlorophyll the amount of light
121 transmitting
absorbs light through a leaf. The
and is unaffected by Minolta
carotene)SPAD has two(940
and infrared LEDs
nm,that emit red (650
no absorption nm,wavelengths
occurs) chlorophyll
122 absorbs
through an light andleaf
intact is sample.
unaffected by carotene)
Minolta SPAD dataand wasinfrared
found to(940 nm, well
be quite no correlated
absorptionwithoccurs)
leaf
123 wavelengths through an intact leaf sample. Minolta SPAD data was found to be quite well
N [25] and leaf chlorophyll contents [26], and therefore it has been used to estimate the leaf chlorophyllcorrelated
124 with
indexleaf N [25] and leaf in
nondestructively chlorophyll contents [26],
other atmospheric CO2 and thereforestudies
enrichment it has been
[27]. used to estimate
The SPAD valuethe leaf
in this
125 chlorophyll
paper index nondestructively
was represented as the averageinvalue
otherofatmospheric CO2 and
the first, second, enrichment studies leaves.
third bud-break [27]. The SPAD
126 value in this paper was represented as the average value of the first, second, and third bud-break
127 leaves.Forests 2019, 10, 420 4 of 11
2.4. Elemental Carbon (C), Nitrogen (N) Contents of Senescent Leaves and Nitrogen Resorption
Efficiency (NRE)
In the plants, natural leaf abscission was preceded by the autumnal leaf senescence, a process
involving changes in the color of the leaves and a decline in their photosynthetic capacity [28]. In our
experiment, the onset of senescence was established on October 7. Senescent leaves were easily
identified in the red maple by displaying yellow colors and by becoming detached from the plants with
very gentle shaking. The greenhouse did not have wind or extremely low temperatures. Some leaves
remained attached to the stem without photosynthetic activity, these were tested by very gentle shaking
to determine whether they could be considered to be falling leaves. The senescent leaves were collected,
and the elemental contents of carbon and nitrogen were measured using an NC2500 elemental analyzer
(CE Instruments, Milan, Italy). The N content (mg g−1 ) in green leaves was estimated by the regression
equation between SPAD and N in senescent leaves (YN = 0.0639XSPAD + 0.0113, R2 = 0.51, p < 0.05).
Nitrogen resorption efficiency (NRE) was calculated as the percentage reduction of nitrogen between
green and senescent leaves using the following formula [19,27]:
NRE = 100% × [(green leaf N − senescent leaf N)/green leaf N] (1)
2.5. Leaf Mass per Area (LMA) and Whole Leaf Area
Leaf mass per area determinations (LMA, g m−2 ) were collected on September 15t. LMA was
calculated by weighting the dry mass of leaf disks of a known area. The leaf area of red maple was
calculated using the formula [29]:
Leaf area = 3.676 + 0.49 × L × W (2)
where L and W are the longest length and the width of red maple leaves, respectively. Whole plant
leaf area was calculated by the sum of the products of leaf number and leaf area in upper, middle,
and latter leaves, respectively.
2.6. Biomass Measurements
Root, stem, and leaves were separated and collected at the end of the experiment. The dry mass
was determined after drying at 85 ◦ C for 48 hours to constant mass.
2.7. Data Analysis
There are three chambers at each CO2 concentration and three CO2 levels.
The effects of elevated CO2 on all parameters except SPAD and whole leaf area were analyzed by
one-way ANOVA with CO2 concentration treatments as the treatment factor. For SPAD and whole leaf
area, split-plot RM-ANOVA was applied as CO2 levels, time and the interaction of CO2 and time as
the treatment factor. When the CO2 effect was significant, post-hoc comparisons were taken using
the LSD test. Normality (Kolmogorov–Smirnov test) and homogeneity of variance (Levene’s test) of
the data were checked prior to analysis. Results were considered significant when p < 0.05. All the
analyses were performed by the SPSS statistics software (Version 18.0, SPSS Inc., Chicago, IL, USA).
3. Results
3.1. Leaf Mass per Area (LMA), Leaf SPAD, and Whole Plant Area
The LMA showed no responses to elevated CO2 (Figure 2). For SPAD measurements, a decreasing
trend was observed during the experiment in all treatments (Figure 3). SPAD values in A800 and
A600 were 22.3% and 17.3% lower, respectively, on August 20, when the largest difference between
treatments was observed (Figure 3). The whole plant leaf area was not significantly different among
treatments (Figure 3).Forests 2019, 10, x FOR PEER REVIEW 5 of 11
Forests 2019, 10, x FOR PEER REVIEW 5 of 11
Forests 2019, 10, 420 5 of 11
250
250
200
.m )
-2
200
LMA(g.m )
150
LMA(g-2 150
100
100
50
50
0
0 A400 A600 A800
A400 A600 A800
Treatments
169
169 Treatments
170 Figure 2. Effects of elevated CO2 (A400—400, A600—600, and A800—800 µL L−1) on leaf mass per
171 Figure
area 2. Effects
(LMA) of elevated
of red maple CO 2 (A400—400,
(Acer rubrum L.).A600—600, and
The values A800—800
shown µL L−1±) SD.
are mean on leaf masswere
There per area
no
170 Figure 2. Effects of elevated CO 2 (A400—400, A600—600, and A800—800 µL L−1) on leaf mass per
172
171
(LMA) of
significantred maple
differences (Acer
amongrubrum
(CO L.). The values shown are mean
2) treatments when p < 0.05, n = 3.
± SD. There were
area (LMA) of red maple (Acer rubrum L.). The values shown are mean ± SD. There were no
no significant
differences among (CO2 ) treatments when p < 0.05, n = 3.
172 significant differences among (CO2) treatments when p < 0.05, n = 3.
50 .4
A400
W hole leaf area (m 2 )
4050 a
A600
A400
.4
.3
W hole leaf area (m 2 )
a a A800
A600
3040 b ba a .3
SPAD
b b ab a A800
b bb b a .2
2030
SPAD
b b bb
CO2: 0.00**
b b .2 CO2: 0.08
b
1020 Time: 0.00**
CO0.96
: 0.00**
.1 Time: 0.00**
CO2: 0.08
CO2× Time: CO2× Time:1.00
2
.1
010
Time: 0.00** Time: 0.00**
CO2× Time: 0.96 0.0 CO2× Time:1.00
180
0 210 240 270 300 330 360 180 210 240 270 300 330 360
0.0
180 210Day
240of270
year300 330 360 180 210
Day240 270 300 330 360
of year
(a)of year
Day Day(b)of year
173 (a) (b)
Figure 3. Effects of elevated CO2 (A400—400, A600—600, and A800—800 µL L−1 ) on mean SPAD
174
173 Figure 3. Effects of elevated CO2 (A400—400, A600—600, and A800—800 µL L−1) on mean SPAD
value (a) and whole plant leaf area (b) of red maple (Acer rubrum L.). The values shown are mean
175
174 value
± SD.
(a) and
Figure whole of
3. Effects
Different
plant leaf area
elevated
lowercase lettersCO
(b) of red maple
2 (A400—400,
above
(Acer rubrum L.).
bars meanA600—600,
significantand
The values
A800—800
multiple µLshown onare
L−1)results
comparison
mean
mean ±
SPAD
among
176
175 SD.value
Different lowercase
(a) and
[CO2 ] treatments whole lettersleaf
when plant
above bars
p < 0.05, narea
= 3. (b)
mean
redsignificant
TheofANOVA maple multiple
(Acer
results ofrubrum
comparison results
L.). The values
(CO2 ) treatments (CO2shown
among [CO
), time,are
2]
andmean
the ±
177
176 treatments when
SD. Different
interaction p < 0.05,
(CO2lowercase n =
× time) areletters3.
shown The
above ANOVA
bars
in the mean
figure, results of (CO 2) treatments (CO2), time, and the
means p < multiple
**significant 0.01. comparison results among [CO2]
178
177 interaction
treatments(COwhen
2 × time) are shown in the figure, ** means p < 0.01.
p < 0.05, n = 3. The ANOVA results of (CO2) treatments (CO2), time, and the
3.2. Leaf Carbon (C), Nitrogen (C) Contents, and Nitrogen Resorption Efficiency (NRE)
178 interaction (CO2 × time) are shown in the figure, ** means p < 0.01.
179 3.2. Leaf Carbon (C), Nitrogen (C) Contents, and Nitrogen Resorption Efficiency (NRE)
The results indicated that N content of senescent leaves in A800 and A600 significantly decreased
179
180 by3.2. Leafand
The
28.1% Carbon
results (C),respectively
Nitrogen
indicated
27.5%, that(C)N Contents,
4). and
content
(Figure of Nitrogen
The senescentResorption
C content leaves inEfficiency
experienced A800 (NRE)
and
no responseA600 significantly
to elevated CO2
181
180 decreased
(FigureThe4). by
The 28.1%
C/N and
ratio 27.5%,
in A800 respectively
and A600 (Figure
was 43.4%4). The
and C content
39.7% higher,experienced no
respectively,
results indicated that N content of senescent leaves in A800 and A600 significantly response
than in to
A400.
182
181 elevated
The N CO 2 (Figure
resorption 4).
efficiencyThe inC/N
A800 ratio
andin A800
A600 and A600
increased was
50.3% 43.4%
and and
46.2%, 39.7% higher,
respectively
decreased by 28.1% and 27.5%, respectively (Figure 4). The C content experienced no response to respectively,
(Figure 5).
183
182 than in A400.
elevated COThe N resorption efficiency in A800 and A600 increased 50.3% and 46.2%, respectively
2 (Figure 4). The C/N ratio in A800 and A600 was 43.4% and 39.7% higher, respectively,
184
183 (Figure
than in5).A400. The N resorption efficiency in A800 and A600 increased 50.3% and 46.2%, respectively
184 (Figure 5).Forests 2019, 10, x FOR PEER REVIEW 6 of 11
Forests 2019, 10, x FOR PEER REVIEW 6 of 11
Forests 2019, 10,30
420 800 80 6 of 11
25
600 60
C (m g g -1 )
N (m g g - 1 )
3020 a 800 a a
80
2515 400
C /N
b b 40 b
600 60
2010
C (m g g -1 )
N (m g g - 1 )
a 200 a a
20
15 5 400
C /N
b b 40 b
10 0 0 0
A400 A600 A800 200 A400 A600 A800 20 A400 A600 A800
5
Treatments Treatments Treatments
0 0 0
185 (a) A800
A400 A600 A400 A600(b)A800 (c) A800
A400 A600
Treatments Treatments Treatments
186 Figure 4. Effects of elevated CO2 (A400—400, A600—600, and A800—800 µL L−1) on leaf mass-based
187
185 N contents (a) leaf (a)mass-based C contents (b) and C/N (b) ratio (c) in senescent leaves(c)of red maple (Acer
188 rubrum L.). The values shown are mean ± SD. Different lowercase letters above bars mean significant
186 Figure 4.4.Effects ofofelevated CO 2 (A400—400, A600—600, and A800—800 µLµL L−1
L−1) )on
onleaf
leafmass-based
189 Figure
multiple Effects
comparison elevated CO
results 2 (A400—400,
among A600—600,
CO2 treatments whenand
pForests 2019,
Forests 10,10,
2019, x FOR
420 PEER REVIEW 7 of 1111
7 of
120 120
Stemdrymass (g)
Root drymass (g)
100 100 (b)
80 80
60 a 60
b b
40 40 a
a a
20 20
0 0
A400 A600 A800 A400 A600 A800
(a) (b)
120 120
Leaf drymass (g)
a
Total drymass (g)
100 100
80 b b
80
60 60
40 40
20 20
0 0
A400 A600 A800 A400 A600 A800
(c) Treatments
1.6 (d)
a
1.2 b b
R/Sratio
.8
.4
0.0
A400 A600 A800
Treatments
201 (e)
202 Figure
Figure6.6.Dry
Drymass
massofof
roots (a)(a)
roots stem, (b)(b)
stem, leaves, (c)(c)
leaves, total, (d)(d)
total, mass ratio
mass of of
ratio roots toto
roots shoots (R/S
shoots ratio,
(R/S ratio,
203 and (e) of red maple (Acer rubrum L.) under three CO 2 concentration treatments (A400—400,
and (e) of red maple (Acer rubrum L.) under three CO2 concentration treatments (A400—400, A600—600,
204 A600—600,
and A800—800and A800—800
µL L−1 ). TheµL L−1). shown
values The values shown
are mean areDifferent
± SD. mean ± lowercase
SD. Different lowercase
letters letters
above bars mean
205 above bars mean significant multiple comparison results among CO 2 treatments when p < 0.05, n = 3.
significant multiple comparison results among CO treatments when p < 0.05, n = 3.
2
206 4.4.Discussion
Discussion
207 AAlong-lived
long-livedleaf leafusually
usuallyacts actsasasa astorage
storageorgan organfor for a a while,
while, especially
especiallyfor forRubisco
Rubisco
208 (Ribulose-1,5-bisphosphate)
(Ribulose-1,5-bisphosphate) enzyme
enzyme which
which maymay play
play a asignificant
significantrole roleasasananinstantaneous
instantaneousstorage storage
209 protein[30].
protein [30]. Decreased
Decreased leaf leafphotosynthesis
photosynthesisand andnitrogen
nitrogen in the
in autumn
the autumnis the first
is thestepfirst
of leaf
stepsenescence
of leaf
210 (decreased(decreased
senescence N and increased C/N ratio)
N and increased forratio)
C/N deciduous trees. In trees.
for deciduous our study,
In ourNstudy,in A800 N inand A800A600andall
211 significantly
A600 decreaseddecreased
all significantly (28.1% and(28.1% 27.5%,andrespectively, Figure 4). These
27.5%, respectively, Figureresults
4). are
Thesecomparable
results are with
212 Norby et alwith
comparable (2000)
Norby[18], et
who found [18],
al (2000) that CO
who 2 enrichment
found that reduced
CO 2 leaf
enrichment N content
reduced by 25%
leaf N in red
content maple
by
213 (Acer rubrum L.) under elevated (+300 µL L −1 ) atmospheric CO
25% in red maple (Acer rubrum L.) under elevated (+300 µL L ) 2atmospheric CO2 content. Unlike
−1 content. Unlike Curtis (1998) [2],
214 who (1998)
Curtis found [2], reduced
who foundN contentreducedonlyNwhen
content using
onlyawhen leaf mass
usingbasisa leafN, butbasis
mass not when
N, butusingnot whena leaf
215 area abasis
using leaf (due
area to increased
basis (due toleaf area and
increased leafleaf
areaweight rather
and leaf than rather
weight N reallocation), we found the
than N reallocation), weN
216 mass-based
found contents decreased
the N mass-based contentswithout
decreased changes
without in changes
the leaf massin theperleafarea
mass (LMA)
per areaand(LMA)
the leafand area
217 (Figures
the 2 and
leaf area 3). This
(Figures result
2 and 3).suggested
This result that in Acer rubrum
suggested that in the
Acersignificant
rubrum the decrease in leaf
significant N contents
decrease in
218 under CO
leaf N contents2 enrichment is not caused by changes in leaf density. Meanwhile,
under CO2 enrichment is not caused by changes in leaf density. Meanwhile, the the increased C/N ratio
219 of senescent
increased C/N leafratiolitter is a determinant
of senescent leaf litterof is
long-term
a determinantallocational carbon and
of long-term nitrogencarbon
allocational and growthand
220 responses
nitrogen and to growth
CO2 enrichment.
responsesIttowas COreported
2 enrichment.that although less nitrogen
It was reported is investedless
that although in Rubisco
nitrogentotal is
221 nitrogen demand of green tissues would reduce, which comprised
invested in Rubisco total nitrogen demand of green tissues would reduce, which comprised up to up to 60% of soluble leaf protein
222 with
60% ofnitrogen
soluble leaf[31,32].
proteinHowever, although
with nitrogen the Rubisco
[31,32]. However, content decreased
although becausecontent
the Rubisco more nitrogen
decreased was
223 allocated
because to RuBP
more (Ribulose-1,5-bisphosphate)
nitrogen was allocated to RuBPregeneration and to Pi (phosphate)
(Ribulose-1,5-bisphosphate) regeneration
regeneration and [11,33],
to Pi
224 the specific activity
(phosphate) regenerationof plants increased
[11,33], and thusactivity
the specific maintained sufficient
of plants photosynthetic
increased and thus capacity
maintainedduring
225 the growing
sufficient season [31].capacity during the growing season [31].
photosynthetic
226 Nitrogen(N)
Nitrogen (N)resorption
resorptionisisdefineddefinedasasthe theprocess
processwherewherenitrogen
nitrogenand andotherothernutrients
nutrientsare are
227 mobilizedfrom
mobilized fromsenescent
senescentleaves leavesandandthen
thentransported
transportedtotoother otherplantplantorgans
organs[17].[17].TheTheNNresorption
resorption
228 efficiency(mass-based)
efficiency (mass-based)was was50.8%50.8%atatA800
A800and and49.4%
49.4%atatA600A600ininleavesleavesofofred redmaple
maple(Figure
(Figure5),5),
229 which are comparable to a mean resorption efficiency of 49%–59% of some plants obtained by otherby
which are comparable to a mean resorption efficiency of 49%–59% of some plants obtained
230 other researchers
researchers [34–36][34–36]
but lowerbut lower
than than previous
previous measurements
measurements of resorption
of resorption (around
(around 70%)70%) Acer
in inAcer
231 rubrum [37]. The N resorption efficiency in our experiment should be underestimated because NForests 2019, 10, 420 8 of 11
rubrum [37]. The N resorption efficiency in our experiment should be underestimated because N
reduction in green leaves was more pronounced than senescent leaves [33] while we estimated N in
green leaves through the relationship between SPAD and N in senescent leaves.
More N resorbed and stored in permanent tissues or organs, more nitrogen can be used for early
growth in the next year, especially in the case when N availability is insufficient to meet the demands
of developing foliage [38]. However, senescence is an aging process of losing functions and structures,
whose ultimate goal is to remove nutrients from senescent leaves and transport them to other plant
organs [17,39].
Elevated CO2 increases carbohydrate production by stimulating photosynthesis. The proportion
(amounts) of the extra carbohydrates accumulated under elevated CO2 in leaves partitioning among
plant organs is not well known. It is also affected by species, plant growth method [40], availability of
carbon sinks [41], duration of the experiment [42], or nonstructural carbohydrate accumulation by its
role as a signaling molecule (sugar sensing and signaling pathways) [11], etc. Our results indicated
that the root to shoot ratio increased and more biomass was allocated to root than to shoot and leaf
(Figure 6). There are many similar research results on a general increase in root biomass and root to
shoot ratio [43]. Growth in roots would be stimulated when carbohydrates are transported more to
roots, and therefore the balance of nutrient/water uptake and transport would also be improved [11].
Root biomass in A800 treatments increased 33.1%, which is comparable with a meta-analysis by
Nie et al. (2013), who found the biomass of total root was increased by 28.8% [43]. Under elevated
CO2, biomass, distribution among root, stems, and foliage should be due to the proportion of new C
allocation to different tissue types, different turnover rates of the tissue types, or by the two processes
in combination [20]. Therefore, increased root biomass is the more typical mechanism supporting
greater N uptake and the continued response of NPP under elevated CO2 [44].
It is noted that the impact of our results also has limitations. First, seedlings and saplings in a
natural environment must deal with the far greater seasonal amplitude of environmental variability than
adult trees. Two-year seedlings grown from seeds in ambient air are possibly more characteristic [45,46]
to elevated CO2 than mature, well-established trees for accelerating growth instead of acclimation.
Second, the seedlings may experience a sort of priming effect and not suffer from acclimation of
photosynthesis in a relatively short CO2 fumigation period. Thus, our results only occurred when
soil nutrition and soil water were not limited, and complementary long-term experiments would
be needed.
5. Conclusions
In summary, we found that red maple (Acer rubrum L.) allocated more biomass to roots, leaf C/N
ratio decreased, and N resorption from senescent leaves increased under 800 µL L−1 CO2 concentration
treatment after one growing season. More growth in root may be helpful to improving nutrient and
water uptake, and therefore would help to maintain the balance of nutrients within the plant as a
sink. The nitrogen resorption is an increasingly important N source especially when facing high CO2
concentration future. Higher N resorption efficiency of senescent leaves makes possible more nitrogen
transfer to other plant organs for early growth next year. Biomass allocation and proportion will
be a critical feature to address the environmental challenges. Nitrogen partitioning in plants and
leaf senescence dynamics in forests grown under elevated CO2 is paramount and complementary
long-term experiments will also be needed.
Author Contributions: Conceptualization, W.M.; methodology, W.M. and L.L.; Formal Analysis, L.L.; investigation,
L.L.; data curation, L.L.; writing—original draft preparation, L.L.; writing—Review and editing, X.W.; supervision,
W.M. and X.W.; project administration, W.M.; funding acquisition, W.M. and L.L.
Funding: This work was funded by the China Scholarship Council (CSC), the National Natural Science for Youth
Foundation of China (31700439), and China Postdoctoral Foundation (2018M631595).Forests 2019, 10, 420 9 of 11
Acknowledgments: I appreciate David Ratkowsky at the Tasmanian Institute of Agriculture and Vicent Calatayud
at the CEAM Foundation for their great help in English polishing and revising suggestions. We thank anonymous
reviewers for their time and efforts in improving this paper. I also thank Mary Gibler from the Forrest Keeling
nursery (fknursery.com) for her kind help with the uniform tree seedlings.
Conflicts of Interest: The authors declare no conflict of interest.
References
1. Reich, P.B.; Walters, M.B.; Kloeppel, B.D.; Ellsworth, D.S. Different photosynthesis-nitrogen relations in
deciduous hardwood and evergreen coniferous tree species. Oecologia 1995, 104, 24–30. [CrossRef] [PubMed]
2. Curtis, P.S.; Wang, X. A meta-analysis of elevated CO2 effects on woody plant mass, form, and physiology.
Oecologia 1998, 113, 299–313. [CrossRef]
3. Cotrufo, M.F.; Ineson, P.; Scott, A. Elevated CO2 reduces the nitrogen concentration of plant tissues. Glob.
Chang. Biol. 2010, 4, 43–54. [CrossRef]
4. Curtis, P.S. A meta-analysis of leaf gas exchange and nitrogen in trees grown under elevated carbon dioxide.
Plant Cell Environ. 1996, 19, 127–137. [CrossRef]
5. Long, S.P.; Ainsworth, E.A.; Rogers, A.; Ort, D.R. Rising atmospheric carbon dioxide: Plants face the future.
Annu. Rev. Plant Biol. 2004, 55, 591–628. [CrossRef]
6. Fangmeier, A.; Chrost, B.H.; Gy, P.; Krupinska, K. CO2 enrichment enhances flag leaf senescence in barley
due to greater grain nitrogen sink capacity. Environ. Exp. Bot. 2000, 44, 151–164. [CrossRef]
7. Taub, D.R.; Wang, X. Why are nitrogen concentrations in plant tissues lower under elevated CO2? A critical
examination of the hypotheses. J. Integr. Plant Biol. 2008, 50, 1365–1374. [CrossRef] [PubMed]
8. Pritchard, S.G.; Rogers, H.H. Spatial and temporal deployment of crop roots in CO2 -enriched environments.
New Phytol. 2000, 147, 55–71. [CrossRef]
9. Bassirirad, H.; Gutschick, V.P.; Lussenhop, J. Root system adjustments: regulation of plant nutrient uptake
and growth responses to elevated CO2 . Oecologia 2001, 126, 305–320. [CrossRef] [PubMed]
10. Bloom, A.J.; Burger, M.; Kimball, B.A.; Pinter, J.P., Jr. Nitrate assimilation is inhibited by elevated CO2 in
field-grown wheat. Nat. Clim. Chang. 2014, 4, 477–480. [CrossRef]
11. Thompson, M.; Gamage, D.; Hirotsu, N.; Martin, A.; Seneweera, S. Effects of elevated carbon dioxide on
photosynthesis and carbon partitioning: A perspective on root sugar sensing and hormonal crosstalk. Front
Physiol. 2017, 8, 578. [CrossRef] [PubMed]
12. Iversen, C.M.; Joanne, L.; Norby, R.J. CO2 enrichment increases carbon and nitrogen input from fine roots in
a deciduous forest. New Phytol. 2010, 179, 837–847. [CrossRef] [PubMed]
13. Brown, A.L.P.; Day, F.P.; Hungate, B.A.; Drake, B.G.; Hinkle, C.R. Root biomass and nutrient dynamics
in a scrub-oak ecosystem under the influence of elevated atmospheric CO2 . Plant Soil 2007, 292, 219–232.
[CrossRef]
14. Handa, I.T.; Hagedorn, F.; Hättenschwiler, S. No stimulation in root production in response to 4 years of in
situ CO2 enrichment at the Swiss treeline. Funct. Ecol. 2008, 22, 348–358. [CrossRef]
15. Aguirrezabal, L.A.N.; Pellerin, S.; Tardieu, F. Carbon nutrition, root branching and elongation: Can the
present state of knowledge allow a predictive approach at a whole-plant level? Environ. Exp. Bot. 1993, 33,
121–130. [CrossRef]
16. Reynolds, J.F.; Thornley, J.H.M. A shoot: Root partitioning model. Ann. Bot. 1982, 49, 585–597. [CrossRef]
17. Killingbeck, K.T. Litterfall dynamics and element use efficiency in a Kansas gallery forest. Am. Midl. Nat.
1986, 116, 180–189. [CrossRef]
18. Norby, R.J.; Long, T.M.; Hartzrubin, J.S.; O’Neill, E.G. Nitrogen resorption in senescing tree leaves in a
warmer, CO2-enriched atmosephere. Plant Soil. 2000, 224, 15–29. [CrossRef]
19. Killingbeck, K.T. Nutrients in senesced leaves: keys to the search for potential resorption and resorption
proficiency. Ecology 1996, 77, 1716–1727. [CrossRef]
20. Reich, P.B.; Yunjian, L.; Bradford, J.B.; Hendrik, P.; Perry, C.H.; Jacek, O. Temperature drives global patterns
in forest biomass distribution in leaves, stems, and roots. PNAS 2014, 111, 13721–13726. [CrossRef]
21. Heck, W.W.; Philbeck, R.B.; Dunning, F.A. A Continuous Stirred Tank Reactor (CSTR) System for Exposing Plants
to Gaseous or Vapor Contaminants: Theory, Specifications, Construction, and Operation; U.S. Dept. of Agriculture,
Agricultural Research Service, Southern Region: New Orleans, LA, USA, 1978; pp. 1–32.Forests 2019, 10, 420 10 of 11
22. Elagöz, V.; Han, S.S.; Manning, W.J. Acquired changes in stomatal characteristics in response to ozone
during plant growth and leaf development of bush beans (Phaseolus vulgaris L.) indicate phenotypic plasticity.
Environ. Pollut. 2006, 140, 395–405.
23. Manning, W.J.; Krupa, S.V. Experimental methodology for studying the effects of ozone on crops and trees.
In Surface Level Ozone Exposures and Their Effects on Vegetation; Lefohn, A.S., Ed.; Lewis Publishers: Boca
Raton, FL, USA, 1992; pp. 93–156.
24. Li, L.; Manning, W.J.; Wang, X.K. Autumnal leaf abscission of sugar maple is not delayed by atmospheric
CO2 enrichment. Photosynthetica 2018, 56, 1134–1139. [CrossRef]
25. Lopez-Bellido, R.J.; Shepherd, C.E.; Barraclough, P.B. Predicting post-anthesis N requirements of bread wheat
with a Minolta SPAD meter. Eur. J. Agron. 2004, 20, 313–320. [CrossRef]
26. Hoel, B.O.; Solhaug, K.A. Effect of irradiance on chlorophyll estimation with the minolta SPAD-502 leaf
chlorophyll meter. Ann. Bot-London. 1998, 82, 389–392. [CrossRef]
27. Herrick, J.D.; Thomas, R.B. Leaf senescence and late-season net photosynthesis of sun and shade leaves of
overstory sweetgum (Liquidambar styraciflua) grown in elevated and ambient carbon dioxide concentrations.
Tree Physiol. 2003, 23, 109–118. [CrossRef] [PubMed]
28. Kikuzawa, K.; Lechowicz, M.J. Ecology of Leaf Longevity; Springer: Berlin/Heidelberg, Germany, 2011;
pp. 23–39.
29. Wargo, P.M. Correlations of Leaf Area with Length and Width Measurements of Leaves of Black Oak, White Oak,
and Sugar Maple; U.S. Department of Agriculture, Forest Service, Northeastern Forest Experiment Station:
Broomall, PA, USA, 1978.
30. Warren, C.R.; Adams, M.A. What determines rates of photosynthesis per unit nitrogen in Eucalyptus seedlings?
Funct. Plant Biol. 2004, 31, 10350–10354. [CrossRef]
31. Urban, O.; Hrstka, M.; Zitová, M.; Holisová, P.; Sprtová, M.; Klem, K.; Calfapietra, C.; Angelis, P.D.;
Marek, M.V. Effect of season, needle age and elevated CO2 concentration on photosynthesis and Rubisco
acclimation in Picea abies. Plant Physiol. Biochem. 2012, 58, 135–141. [CrossRef] [PubMed]
32. Jacob, J.; Greitner, C.; Drake, B.G. Acclimation of photosynthesis in relation to Rubisco and nonstructural
carbohydrate contents and in situ carboxylase activity in Scirpus olneyi grown at elevated CO2 in the field.
Plant Cell Environ. 1995, 18, 875–884. [CrossRef]
33. Ainsworth, E.A.; Long, S.P. What have we learned from 15 years of free-air CO2 enrichment (FACE)? A
meta-analytic review of the responses of photosynthesis, canopy properties and plant production to rising
CO2. New Phytol. 2005, 165, 351–372. [CrossRef]
34. Chapin, F.S.; Kedrowski, R.A. Seasonal changes in nitrogen and phosphorus fractions and autumn
retranslocation in evergreen and deciduous taiga trees. Ecology 1983, 64, 376–391. [CrossRef]
35. Aerts, R. Nutrient resorption from senescing leaves of perennials: are there general patterns? J. Ecol. 1996,
84, 597–608. [CrossRef]
36. Jiang, D.; Li, Q.; Luo, Y.; Vogel, J.; Shi, Z.; Ruan, H.; Xu, X. Nitrogen and phosphorus resorption in planted
forests worldwide. Forests 2019, 10, 201. [CrossRef]
37. Cotrufo, M.F.; Briones, M.A.J.I.; Ineson, P. Elevated CO2 affects field decomposition rate and palatability of
tree leaf litter: Importance of changes in substrate quality. Soil Biol. Biochem. 1998, 30, 1565–1571. [CrossRef]
38. Kang, S.M.; Ko, K.C.; Titus, J.S. Mobilization and metabolism of protein and soluble nitrogen during spring
growth of apple trees. J. Am. Soc. Hortic. Sci. 1982, 107, 209–213.
39. Lim, P.O.; Kim, H.J.; Nam, H.G. Leaf senescence. Annu. Rev. Plant Biol. 2007, 58, 115–136. [CrossRef]
40. Suter, D.; Frehner, M.; Fischer, B.U.; Nösberger, J.; Lüsche, A. Elevated CO2 increases carbon to the roots of
Lolium perenne under free-air CO2 enrichment but not in a controlled environment. New Phytol. 2002, 154,
65–75. [CrossRef]
41. Aranjuelo, I.; Cabrerizo, P.M.; Arrese-Igor, C.; Aparicio-Tejo, P.M. Pea plant responsiveness under elevated
[CO2 ] is conditioned by the N source (N2 fixation versus NO3 −fertilization). Environ. Exp. Bot. 2013, 95,
34–40. [CrossRef]
42. De Graaff, M.; van Groenigen, K.; Six, J.; van Kessel, C. Interactions between plant growth and soil nutrient
cycling under elevated CO2 : A meta-analysis. Glob. Chang. Biol. 2006, 12, 2077–2091. [CrossRef]
43. Nie, M.; Lu, M.; Bell, J.; Raut, S.; Pendall, E. Altered root traits due to elevated CO2 : A meta-analysis.
Glob. Ecol. Biogeogr. 2013, 22, 1095–1105. [CrossRef]Forests 2019, 10, 420 11 of 11
44. Finzi, A.C.; Norby, R.J.; Carlo, C.; Anne, G.B.; Birgit, G.; Holmes, W.E.; Hoosbeek, M.R.; Iversen, C.M.;
Jackson, R.B.; Kubiske, M.E. Increases in nitrogen uptake rather than nitrogen-use efficiency support higher
rates of temperate forest productivity under elevated CO2 . PNAS 2007, 104, 14014–14019. [CrossRef]
45. Reich, P.B.; Hobbie, S.E.; Lee, T.; Ellsworth, D.S.; West, J.B.; Tilman, D.; Knops, J.M.H.; Naeem, S.; Trost, J.
Nitrogen limitation constrains sustainability of ecosystem response to CO2 . Nature 2006, 440, 922–925.
[CrossRef] [PubMed]
46. Huxman, T.E.; Hamerlynck, E.P.; Jordan, D.N.; Salsman, K.J.; Smith, S.D. The effects of parental CO2
environment on seed quality and subsequent seedling performance in Bromusrubens. Oecologia 1998, 114,
202–208. [CrossRef] [PubMed]
© 2019 by the authors. Licensee MDPI, Basel, Switzerland. This article is an open access
article distributed under the terms and conditions of the Creative Commons Attribution
(CC BY) license (http://creativecommons.org/licenses/by/4.0/).You can also read