Enzymatic Low Volume Passive Sweat Based Assays for Multi-Biomarker Detection - MDPI
←
→
Page content transcription
If your browser does not render page correctly, please read the page content below
biosensors
Article
Enzymatic Low Volume Passive Sweat Based Assays
for Multi-Biomarker Detection
Ashlesha Bhide 1 , Sarah Cheeran 1 , Sriram Muthukumar 2 and Shalini Prasad 1, *
 1    Department of Bioengineering, University of Texas at Dallas, 800 West Campbell Road, Richardson,
      TX 75080, USA; Ashlesha.Bhide@utdallas.edu (A.B.); Sarah.Cheeran@utdallas.edu (S.C.)
 2    Enlisense LLC, 1813 Audubon Pond way, Allen, TX 75013, USA; Sriram.Muthukumar@utdallas.edu
 *    Correspondence: Shalini.Prasad@utdallas.edu; Tel.: +1-972-883-4247

 Received: 1 December 2018; Accepted: 14 January 2019; Published: 16 January 2019

 Abstract: Simultaneous detection of correlated multi-biomarkers on a single low-cost platform in
 ultra-low fluid volumes with robustness is in growing demand for the development of wearable
 diagnostics. A non-faradaic biosensor for the simultaneous detection of alcohol, glucose, and
 lactate utilizing low volumes (1–5 µL) of sweat is demonstrated. Biosensing is implemented using
 nanotextured ZnO films integrated on a flexible porous membrane to achieve enhanced sensor
 performance. The ZnO sensing region is functionalized with enzymes specific for the detection
 of alcohol, glucose, and lactate in the ranges encompassing their physiologically relevant levels.
 A non-faradaic chronoamperometry technique is used to measure the current changes associated
 with interactions of the target biomarkers with their specific enzyme. The specificity performance
 of the biosensing platform was established in the presence of cortisol as the non-specific molecule.
 Biosensing performance of the platform in a continuous mode performed over a 1.5-h duration
 showed a stable current response to cumulative lifestyle biomarker concentrations with capability to
 distinguish reliably between low, mid, and high concentration ranges of alcohol (0.1, 25, 100 mg/dL),
 glucose (0.1, 10, 50 mg/dL), and lactate (1, 50, 100 mM). The low detection limits and a broader
 dynamic range for the lifestyle biomarker detection are quantified in this research demonstrating its
 suitability for translation into a wearable device.

 Keywords: wearable biosensing; enzyme-based assay; alcohol detection; glucose detection;
 lactate detection; chronoamperometry; sweat sensing; continuous monitoring

1. Introduction
      The market for wearable diagnostic devices is projected to rapidly ascend by 23 percent yearly
to over $100 billion by 2023 and exceed $150 billion by 2026 [1]. Wearables enable users to receive
personalized health data on a range of medical parameters utilizing an approach that non-invasively and
seamlessly acquires data on specific digital biomarkers to monitor parameters such as physical activity
and heart rate [2]. This wearable technology allows for users to directly obtain information regarding
their own bodies and, subsequently, be able to act accordingly, thus permitting for self-diagnosis,
predictive preventive care, and management of health conditions [3]. While there exist numerous
wearable devices that track digital biomarkers, wearable diagnostics that analyze and monitor
biochemical markers are not as available [4]. For instance, to really delve into the status of human
health it is necessary to scrutinize human biofluids that can delineate the body’s physiological state.
Human sweat is one such biological fluid that contains valuable medical information pertaining to
the human health status [5]. Moreover, it is a preferred candidate over other biological fluids due
to its ease of access and allows for non-invasive analysis of samples. Correlation between blood
lifestyle biomarkers and sweat biomarkers have been established in the research space [6–8]. For this

Biosensors 2019, 9, 13; doi:10.3390/bios9010013                               www.mdpi.com/journal/biosensors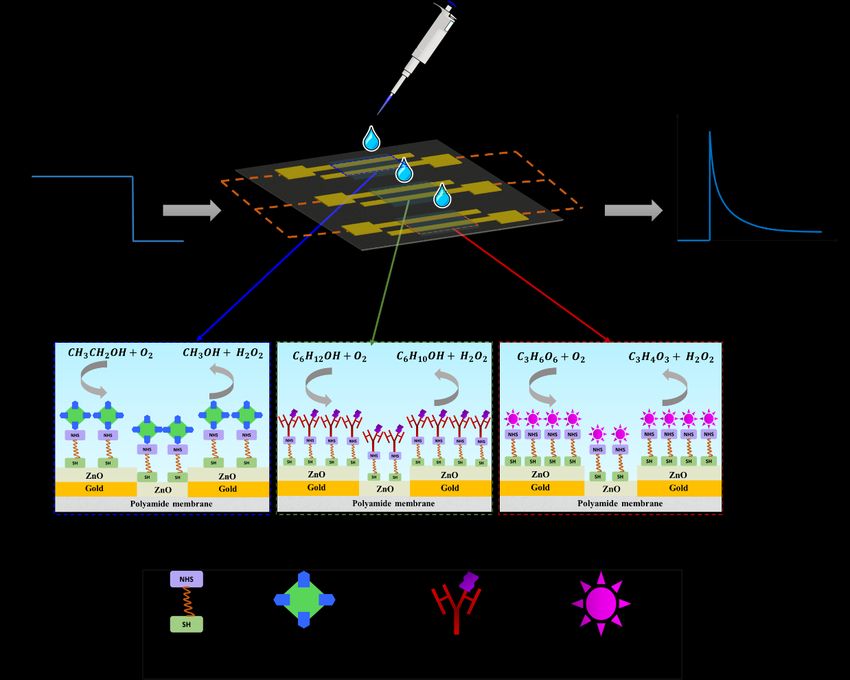
Biosensors 2019, 9, 13                                                                              2 of 14

reason, sweat based biosensing is vital in detecting specific biological factors that will provide more
of an in-depth analysis on the health status of the body. Multiplexed enzyme based-detection of
analytes on a single platform remains a daunting challenge in sweat-based detection. However, several
researchers have developed enzyme based-biosensing platforms that can quantify and report alcohol,
glucose, and lactate levels in biofluids [9–15]. This paper will focus on demonstrating an enzyme-based
biosensing platform for multiplexed detection of alcohol, glucose, and lactate (lifestyle biomarker triad)
in human sweat.
     Continuous, real-time monitoring of the lifestyle biomarkers triad is imperative as the
dysregulation of one of the biomarkers could potentially affect the functioning of the other biomarkers.
Diabetes is associated with the inability of the body to produce insulin resulting in abnormal glucose
levels in the body. Management of diabetes requires individuals to tightly monitor their blood glucose
levels in a continuous manner to minimize health risks. Self-monitoring of diabetes allows individuals
to keep track of their lifestyle and take appropriate measures to keep a control on their glucose levels.
Literature studies have revealed a U-shaped physiological connection between alcohol consumption
and diabetes [16]. Moderate alcohol consumption by diabetic and pre-diabetic populations affects the
glycemic index of the individual depending on their nutrition states causing acute hypoglycemia in
fed states and hyperglycemia in unfed states [17]. Excess consumption of alcohol also leads to alcohol
ketoacidosis which is potentially fatal in starved conditions. Studies also reveal a relation between
blood glucose and blood lactate levels wherein incidence of type 2 diabetes is associated with high
plasma lactate levels [18]. This condition is known as lactate acidosis which is related to increased
lactate production in diabetic individuals causing a pH imbalance in the body [19]. The correlation
between the biomarkers justifies the need to develop a non-invasive multi-biomarker platform that
would allow diabetic and pre-diabetic cohorts to self-monitor physiological parameters for diabetes
and lifestyle management. This work is a novel demonstration of a sweat-based multi-biomarker
detection platform developed on a flexible substrate for non-invasive analysis of lifestyle biomarkers
in low volumes of sweat. The nanoporosity of the polyamide substrate aids in uniform fluid transport
and enhances the charge storage capacity which is leveraged in this research for enhanced sensitivity
and wider dynamic range of biomarker detection. Biosensing is achieved by a novel electrode stack
which employs nanotextured zinc oxide thin films as the active biosensing region which allows for
increased binding of proteins to the surface for enhanced sensitivity and provides biocompatibility
for wearable applications. The biomolecular events occurring at the electrode–sweat interface are
captured as capacitive current changes through non-faradaic chronoamperometry (CA). The sensor
performance metrics—limit of detection, dynamic range, signal-noise threshold, and specificity of
biomarker detection are reported. The stable operation of the biosensing platform over a 1.5-h duration
across the established dynamic range on continuous exposure to sweat biomarkers is demonstrated.

2. Materials and Methods

2.1. Materials and Reagents
     Polyamide substrates with a pore size of 200 nm and a thickness of 60 µm were obtained
from GE Healthcare Life Sciences (Piscataway, NJ, USA). The linker molecule dithiobis succinimidyl
propionate (DSP), dimethyl sulfoxide (DMSO), and 1X phosphate buffered saline (PBS) were procured
from Thermo Fisher Scientific Inc. (Waltham, MA, USA). Salt-free streptavidin from Streptomyces
avidiini (≥13 units/mg protein), alcohol oxidase enzyme from Pichia pastoris (10–40 units/mg protein),
glucose oxidase from Asperigillus niger (100,000–250,000 units/g), D-(+)-glucose, sodium L-lactate
(~98% purity), absolute ethyl alcohol (≥99.5%), and sodium bicarbonate (≥99.7%) were procured
from Sigma-Aldrich (St. Louis, MO, USA). NHS-biotin was purchased from Vector laboratories
(Burlingame, CA, USA). Glucose oxidase antibody was purchased from Abcam (Cambridge, MA,
USA). Lactate oxidase (80 U/mg) was purchased from Toyobo USA. Synthetic sweat was prepared from
the recipe described in M.T. Mathew et al. [20]. The pH range was varied by varying the concentrations
Biosensors 2019, 9, 13 3 of 14
of the constituents. Single donor human sweat of pH~6 was purchased from Lee Biosolutions Inc.
(Maryland Heights, MO, USA). No preservatives were added to this product and it was stored at
−20 ◦ C. All alcohol, glucose, and lactate dilutions were made in synthetic sweat pH 6, 8, and in human
sweat buffers.
2.2. Sensor Fabrication
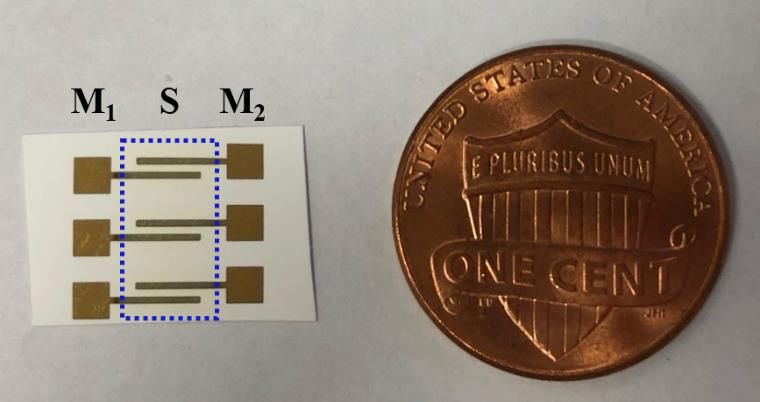
The biosensing platform was deposited on a flexible nanoporous polyamide membrane as shown
in Figure 1A. The biosensor comprises of gold measurements (M1 and M2 ) electrodes and a ZnO active
biosensing region (S). Fabrication of the biosensing platform is a two-step process. Firstly, it involves
the deposition of ~150 nm gold electrodes on the substrate using a Temescal e-beam evaporator tool
(Ferro Tec, Livermore, CA, USA) and secondly, it involves the sputtering of ZnO thin films in the
overlap region between the two gold electrodes using AJA Orion RF magnetron with a 99.999% ZnO
target (Kurt J. Lesker) at room temperature. The film thickness is measured using a Veeco Dektak 8
profilometer and is found to be~100–120 nm.
2.3. Alcohol Biosensor Calibration in Synthetic Sweat pH 6 and Human Sweat
The enzyme complex immobilized on the alcohol biosensor for the detection of alcohol in synthetic
sweat and human sweat is depicted in Figure 1B. The biosensing surface was functionalized with
10 mM DSP thiol-cross linker diluted in dimethylsulfoxide (DMSO) and was dispensed on the ZnO
sensing region for 3 h in darkness. Sample volumes were maintained at 3 µL and dispensed on the
backside of the active sensing ZnO region all throughout this research. 1 mg/mL of streptavidin in 1X
PBS was incubated on the sensing region for 60 min. After immobilizing streptavidin, biotinylated
alcohol oxidase enzyme was incubated on the sensing region for 15 min. The enzyme biotinylation
process was performed as per the method outlined in Du et al. [21]. Synthetic and human sweat buffers
were dispensed on the sensing region depending on the detection buffer. This step was considered
as the baseline step. Ethanol was diluted in synthetic sweat buffers in a logarithmically increasing
concentration range between 0.01–100 mg/dL. Ethanol dilutions in sweat were dispensed on the sensor
in increasing dose concentrations and incubated for 10 min each. CA measurements were performed
after every immobilization step. CA measurements were recorded as current measurements using
a potentiostat (Gamry Instruments, Warminster, PA, USA) after applying an DC excitation signal of
600 mV for 1-min duration. All data is represented as mean ± relative standard deviation (RSD).
A sample set of n = 3 was used throughout this research for building CDRs in synthetic and human
sweat buffers.
2.4. Glucose Biosensor Calibration in Synthetic Sweat pH 6 and Human Sweat
The enzyme complex immobilized on the ZnO surface for detection of glucose in synthetic and
human sweat buffers is shown in Figure 1B. The protocol was adapted and modified based on the
protocol published by the group previously [22]. Initially, the biosensing surface is immobilized with
10 mM DSP cross-linker after a 3 h incubation period. The surface is then incubated with 100 µg/mL
glucose oxidase antibody for 15 min followed by immobilization of 100 µg/mL glucose oxidase enzyme.
Synthetic sweat of pH 6 is dispensed on the sensing region and is considered as the baseline with respect
to which all current changes are computed. Glucose dilutions of concentrations from 0.01–50 mg/dL
were made in synthetic sweat and human sweat buffer solutions and were applied to the biosensing
surface in increasing concentrations to obtain a CDR. A DC bias of 700 mV was applied for 1 min to
obtain the current responses.
2.5. Lactate Biosensor Calibration in Synthetic Sweat pH 6 and Human Sweat
The lactate detection enzyme complex functionalized on the ZnO surface for lactate detection in
synthetic and human sweat buffers is shown in Figure 1B. The DSP functionalized surface is treated
with 4 mg/mL of lactate oxidase and incubated for 1.5 h. Lactate-free synthetic sweat was applied toBiosensors 2019, 9, 13 4 of 14
Biosensors 2018, 8, x FOR PEER REVIEW 4 of 14
the sensing region to obtain baseline current measurement. Lactate dilutions of concentrations—0.1, 1,
10,
was50, 100 mM—were
maintained made
at 5 min. in synthetic and
Dose–response human
curves sweat
were buffers.
obtained Lactate dose
by applying a DCincubation time
bias of 650 mVwas
for
maintained
1 min. at 5 min. Dose–response curves were obtained by applying a DC bias of 650 mV for 1 min.
(A)
(B)
Figure 1. (A) Schematic of the enzyme based-
based- biosensing
biosensing platform
platform (M
(M11, M22 are the gold measurement
electrodes; S is the ZnO active biosensing region); (B) Schematic of enzyme complexes functionalized
for alcohol, glucose, and lactate
lactate detection.
detection.Biosensors 2019, 9, 13 5 of 14
2.6. Specificity Study in Synthetic Sweat pH 6
The specificity study on the biosensing platform was carried out by dispensing 3 µL of cortisol
dose concentrations spiked in synthetic sweat pH 6 in increasing dose concentrations. Cortisol dose
concentrations in the ranges 0.01–100 mg/dL, 0.01–50 mg/dL, and 0.1–100 mM spiked in synthetic
sweat pH 6 were dispensed serially on the alcohol, glucose, and lactate biosensing regions respectively
and their current responses were recorded. The incubation times and DC biases were maintained to
be the same as required for target biomarker–enzyme interaction as described in the above section.
Cortisol free-synthetic sweat pH 6 is considered to be the baseline for all experiments with respect to
which all current changes were computed.
2.7. Continuous Monitoring in Synthetic Sweat pH 6
Continuous monitoring of alcohol, glucose, and lactate in synthetic sweat pH 6 was performed by
dispensing 3 µL of biomarker dose concentrations every 7 min on the ZnO sensing region in succession
over a 1.5 h duration. Alcohol concentrations of 0.1, 25, and 100 mg/dL were prepared by spiking
alcohol in synthetic sweat pH 6. Each dose concentration was applied to the sensing region five times in
progression to obtain the current response for cumulative dosing. The dynamic current response of the
biosensing system for continuous alcohol monitoring was measured using the conditions mentioned in
the previous section. For continuous glucose and lactate biosensing, glucose, and lactate concentrations
of 0.1, 10, 50 mg/dL, and 1, 50, 100 mM respectively were made in synthetic sweat pH 6 and dosed
similarly as done for continuous alcohol biosensing. The current responses were plotted against
cumulative dose concentrations and the slope changes within each dose regime were computed with
respect to time.
3. Results and Discussion
3.1. Non-Faradaic Chronoamperometry as a Technique for Evaluating the Biosensing Performance
The electrochemical binding events occurring at the ZnO active biosensing region and sweat
interface is captured by non-faradaic chronoamperometry. A charged electrode in contact with an
electrolyte results in the formation of electrical double layer (EDL) that is equivalent to a capacitance
system. EDL is compact region consisting of co-ions (electrode) and counter ions (electrolyte) held
together by electrostatic forces of attraction and a diffuse layer. Non-faradaic chronoamperometry
is a technique that involves perturbation of the EDL by a step-DC bias which captures the current
charge–discharge dynamics of the binding events occurring at the interface. The DC bias input is
related to the electroactivity of the biomarker of choice. The output chronoamperometric responses
are recorded as time-based current changes. The current response, as shown in Figure 1B, consists of
two regions: (1) a current spike arising from the EDL charging, (2) a current decay caused by the EDL
relaxation (Icap α e−t/R*C ) reaching a steady state [23]. The catalytic oxidation of the sweat based-lifestyle
biomarker concentrations by the enzyme system produces H2 O2 and other products causing a charge
redistribution in the existing EDL. The current produced by this charge modulation is captured as the
biosensing response of the developed platform.
3.2. Fluid Wicking Study and Electrical Characterization of the Surface Functionalized Biosensor
In this work, we have utilized a flexible, nanoporous polyamide membrane suitable for wearable
applications with a capability of wicking sweat. The porous and the fibrous network of the polymer that
mimics a fabric allows for the easy transport of sweat from the skin to the active biosensing ZnO region
of the sensor platform. The group has previously characterized the structural and functional utility
of the substrate and the ZnO active biosensing region for wearable biosensing applications [9,22,24].
The hydrophilic nature of polyamide allows uniform diffusion of sweat throughout the entire sensing
region and requires less incubation time. The wicking profiles of 0.1–10 µL volumes of liquid on
the polyamide membrane are shown in Figure 2A. It is evident that the fluid spreads uniformly inBiosensors 2019, 9, 13 6 of 14
all directions
Biosensors 2018, 8,and
x FORthat
PEERlow-volumes
REVIEW of 1–5 µL are adequate for the robust biosensing of the 7sweat
of 14
biomarkers of choice.
A) B)
C) D)
)
Figure
Figure 2.2.(A) Fluid
(A) wicking
Fluid capability
wicking of the
capability ofpolyamide substrate
the polyamide for different
substrate sweat volumes
for different (0.5–10
sweat volumes
μL). Electrical characterization of enzyme complex functionalized on the ZnO surface
(0.5–10 µL). Electrical characterization of enzyme complex functionalized on the ZnO surface forfor (B) Alcohol
biosensor
(B) Alcohol (C) Glucose (C)
biosensor biosensor
Glucose(D) Lactate biosensor.
biosensor (D) LactateStatistical
biosensor.significance between each
Statistical significance assay each
between step
is set at threshold of 0.05 (p < 0.05)
assay step is set at threshold of 0.05 (p < 0.05).
3.3. Biosensor Calibrationrequires
Robust biosensing in pH Variant Synthetic
the enzyme Sweat to be successfully functionalized and confined
complexes
withinUnder normal homeostasis, the pH of human sweatisvaries
the nanopores of the membrane. Current response used to characterize
between 4.5–7.0 the chemical
[25]. interaction
A dysregulation
occurring
in between the
the homeostatic ZnO biosensing
conditions surfacebody
of the human and various
leads toenzyme complex
an acid/base steps as described
imbalance causing pH in
Section 3.1. The first step for immobilizing an enzyme complex on the sensing
variations in sweat. Robust biosensing requires stable operation of the biosensor in varying sweat pH platform involves
incubation of a cross-linker
microenvironments DSP on an
and to produce theoutput
biosensing
that issurface for 3toh.fluctuating
invariant The thiol group
sweat pH of the DSP binds
values. From
to the
the ZnO surface
perspective through Zn-S
of translation bonds
of the producing
developed a veryinto
platform lowacurrent
wearable response as DSP
diagnostic, it is(dissolved in
essential to
DMSO) is resistive in nature. Subsequently, two PBS washes are performed to
conserve the biosensing performance metrics across all pH conditions. Investigations of the activeremove any unbound
DSP and toelement
biosensing allow further immobilization
Zinc oxide (ZnO) in indicated
acidic and bybasic
a notable change inhave
pH solutions current. For the
revealed alcohol
chemical
biosensor, streptavidin is incubated for one hour on the DSP functionalized surface.
stability and film durability over prolonged periods of time [26–27]. Hence, it is important to The NHS group of
the DSP binds to the amine group of the streptavidin producing a 6 µA increased
characterize the effect of pH variation on the biosensing response on interaction with synthetic sweat change in current
from
of pHthe DSPofstep
values as shown
6 and 8. in Figure 2B. This increased current can be attributed to the presence of
charged molecules on the surface making it moreusing
Enzyme based biosensing is demonstrated conductive. Further,
non-faradaic two PBS washes are
chronoamperometry toperformed
detect the
to remove any unbound streptavidin and current responses are recorded
biomarkers of choice in sweat. The electrochemical response of the lifestyle biomarker triad to ensure stable binding.
to
increasing dose concentration varying pH sweat solutions is represented as calibration dose response
(CDR). The CDR curves are plotted as a function change in steady-state current obtained from a dose
concentration with respect to the steady-state current obtained from a zero-dose concentration thatBiosensors 2019, 9, 13 7 of 14
The next step involves the incubation of biotinylated alcohol oxidase enzyme on the streptavidin
functionalized surface for 15 min. A current change from 15 µA to 18.5 µA is observed ensuring the
successful binding of the enzyme to streptavidin. Furthermore, two PBS washes are performed to
remove any unbound enzyme. A minor change in current of 0.8 µA between the PBS wash step and
the enzyme step is observed validating the binding of the enzyme to the surface. The current response
produced by the control experiment performed to ensure the fidelity of glucose oxidase enzyme
binding to the sensor surface is shown in Figure 2C. Post DSP functionalization and PBS washes,
glucose oxidase antibody is incubated on the surface for 15 min. A current change of 7 µA is observed
from the PBS step to the antibody incubation step confirming the binding of the antibody to NHS ester
of the DSP. Thereafter, two PBS washes are performed to wash any unbound antibody. The glucose
oxidase enzyme is incubated on the antibody immobilized surface for 15 min which produces a current
change of 5 µA from the previous PBS wash step. Two PBS washes are performed after the enzyme
step producing a minor change in current of 1 µA from the enzyme immobilization step validating
the successful binding of the enzyme complex components to the ZnO surface. The validation of the
enzyme complex immobilization for lactate detection is shown in Figure 2D. Lactate oxidase enzyme is
incubated on the DSP functionalized surface for 1.5 h. Post DSP-binding, a change in current from
0.2–2 µA is observed from the previous PBS wash step confirming that lactate oxidase is bound to DSP.
Two PBS washes are performed afterwards to remove any unbound molecules and to activate the
surface which can be explained a minor change in current of 0.7 µA. Statistically significant changes in
current were observed for each assay step with a p-value < 0.05.
3.3. Biosensor Calibration in pH Variant Synthetic Sweat
Under normal homeostasis, the pH of human sweat varies between 4.5–7.0 [25]. A dysregulation
in the homeostatic conditions of the human body leads to an acid/base imbalance causing pH
variations in sweat. Robust biosensing requires stable operation of the biosensor in varying sweat
pH microenvironments and to produce an output that is invariant to fluctuating sweat pH values.
From the perspective of translation of the developed platform into a wearable diagnostic, it is essential
to conserve the biosensing performance metrics across all pH conditions. Investigations of the active
biosensing element Zinc oxide (ZnO) in acidic and basic pH solutions have revealed chemical stability
and film durability over prolonged periods of time [26,27]. Hence, it is important to characterize the
effect of pH variation on the biosensing response on interaction with synthetic sweat of pH values of 6
and 8.
Enzyme based biosensing is demonstrated using non-faradaic chronoamperometry to detect
the biomarkers of choice in sweat. The electrochemical response of the lifestyle biomarker triad to
increasing dose concentration varying pH sweat solutions is represented as calibration dose response
(CDR). The CDR curves are plotted as a function change in steady-state current obtained from a dose
concentration with respect to the steady-state current obtained from a zero-dose concentration that
does not consist of any molecules of the biomarkers of choice and is termed as the baseline. The dose
response of alcohol biosensor to an alcohol concentration range of 0.01–100 mg/dL in sweat pH values
of 6 and 8 are shown in Figure 3A. The change in current from low to high alcohol dose in sweat
pH 6 is 1.2 (±0.006)–5.2 (±0.036) µA. The current change from low dose to high dose for sweat pH 8
is 1.4 (±0.001)–6.2 (±0.032) µA implying an increasing current being generated with increasing dose
concentrations because of the catalytic oxidation reaction occurring between the enzymatic system and
the biomarkers of choice. Considering a signal to noise ratio (SNR) of 3, the calculated noise thresholds
for sweat pH values of 6 and 8 lie below the current response obtained from the lowest detectable dose
concentration of 0.1 mg/dL which is termed as the limit of detection (LOD) [28]. The dynamic range for
reliable alcohol detection is 0.1–100 mg/dL. Figure 3B represents the dose responses of varying glucose
concentrations 0.01–50 mg/dL spiked in sweat pH’s 6 and 8 on interaction with the glucose biosensor.
In sweat pH 6, the change in current from low glucose concentration to high glucose concentration is
3.5 (±0.18)–8.1 (±0.1) µA. The current change observed from low to high glucose dose concentrationthresholds for sweat pH values of 6 and 8 lie below the current response obtained from the lowest
detectable dose concentration of 0.1 mg/dl which is termed as the limit of detection (LOD) [28]. The
dynamic range for reliable alcohol detection is 0.1–100 mg/dl. Figure 3B represents the dose responses
of varying glucose concentrations 0.01–50 mg/dl spiked in sweat pH’s 6 and 8 on interaction with the
Biosensors
glucose 2019, 9, 13
biosensor. In sweat pH 6, the change in current from low glucose concentration to 8high of 14
glucose concentration is 3.5 (± 0.18)–8.1 (± 0.1) μA. The current change observed from low to high
glucose
in sweatdose
pH 8concentration in sweat
is 1.5 (±0.24)–6.6 pHµA.
(±0.26) 8 is The
1.5 (± 0.24)–6.6
glucose (± 0.26)limit
detection μA. The glucose
is found to bedetection
0.1 mg/dL limit
andis
found to be 0.1 mg/dl and the dynamic range is 0.1–50 mg/dl. The dose response
the dynamic range is 0.1–50 mg/dL. The dose response for lactate biosensing over a concentration for lactate biosensing
over a of
range concentration
0.1–100 mMrange of 0.1–100mM
in sweat pH values of in 6sweat
and 8pH arevalues
shownofin6Figure
and 8 are3C.shown in Figure
The current 3C. The
changes for
current changes for 0.1 mM in sweat pH values of 6 and 8 are 2.5 (±0.003)
0.1 mM in sweat pH values of 6 and 8 are 2.5 (±0.003) µA and 2.2 (±0.008) µA. For 100 mM lactate μA and 2.2 (± 0.008) μA.
For 100 mM lactate
concentration, concentration,
the change in current the
inchange
sweat pH in current
values ofin 6sweat
and 8pH arevalues
observedof 6toand
be 810are observed
(±0.007) µA
to be 10 (± 0.007) μA and 2.2 (± 0.003) μA. The lowest detection lactate concentration
and 2.2 (±0.003) µA. The lowest detection lactate concentration is 0.1mM and the dynamic range of is 0.1mM and
the dynamic
detection range to
is found ofbedetection
1–100 mM. is found to be 1–100
Differences mM.inDifferences
of 2–5% the magnitudesof 2–5% in the
of the magnitudes
current responses of
the current responses between sweat pH 6 and 8 could be due to the excess
between sweat pH 6 and 8 could be due to the excess H+ ions participating in the charge transfer H + ions participating in
the charge
reaction transferbetween
occurring reactiontheoccurring
enzymatic between
systemthe andenzymatic
the activesystem andZnO
biosensing the active
regionbiosensing ZnO
of the electrode.
region of the electrode. Similar trends in dose–response curves are produced
Similar trends in dose–response curves are produced by the lifestyle biomarkers in sweat pH values of by the lifestyle
6biomarkers in sweat
and 8 indicating thatpHpHvalues of 6has
variation and 8 indicating
minimal thatthe
effect on pH variation
output has minimal
response and doeseffect on the
not degrade
output response and
the biosensing performance. does not degrade the biosensing performance.
A) B)
Biosensors 2018, 8, x FOR PEER REVIEW 9 of 14
C)
Figure
Figure 3. Calibration
3. Calibration dose
dose response
response curves
curves in synthetic
in synthetic sweat
sweat pHpH 6 and
6 and 8 for
8 for detection
detection of (A)
of (A) Alcohol
Alcohol
(B) (B) Glucose
Glucose (C) (C) Lactate.
Lactate.
3.4.3.4.
Biosensor Calibration
Biosensor in Human
Calibration Eccrine
in Human Sweat
Eccrine Sweat
Human
Human sweat
sweatis ais complex
a complexbiomatrix
biomatrixconsisting
consistingofofelectrolytes
electrolytesand
andmetabolites
metabolites which
which serve
serve as
as biomarkers
biomarkers for
for non-invasive
non-invasive dynamic
dynamicmonitoring
monitoringofofphysiological
physiologicalconditions
conditionsinin human
human body. body.
The
Thecurrent
currentobtained
obtainedfromfromthethebiosensing
biosensingplatform
platforminin response
response to
to the
the lifestyle
lifestyle biomarkers
biomarkers spiked
spiked in
in human
human sweat
sweatisisrepresented
represented as as calibration
calibration dosedose response
response curves
curves as shown
as shown in Figure
in Figures 4A, 4B,4A–C.
and 4C.
TheThe
pre-existing concentrations of the lifestyle biomarkers present in the
pre-existing concentrations of the lifestyle biomarkers present in the human sweat human sweat sample
sample
procured under
procured undernormal
normal conditions
conditionsis considered
is consideredas the baseline
as the with
baseline respect
with to which
respect thethe
to which current
current
changes obtained
changes from
obtained fromthethe
dose concentrations
dose concentrations areare
computed.
computed.As As
a consequence
a consequence of catalytic oxidation
of catalytic oxidation
reactions occurring at the biosensing interface, increasing concentrations of the lifestyle biomarkers
leads to an increased production of H2O2 and by-products which in turn generate an increasing
capacitive current at the interface (see Figure 4 insets). The dose response of the alcohol biosensor to
0.01, 0.1, 1, 10, 100 mg/dl spiked in human sweat is shown in Figure 4A. The current change from the
baseline for the alcohol dose concentrations is observed to be 0.5 ± 0.03 μA–2.2 ± 0.007 μA for theBiosensors 2019, 9, 13 9 of 14
reactions occurring at the biosensing interface, increasing concentrations of the lifestyle biomarkers
leads to an increased production of H2 O2 and by-products which in turn generate an increasing
capacitive current at the interface (see Figure 4 insets). The dose response of the alcohol biosensor to
0.01, 0.1, 1, 10, 100 mg/dL spiked in human sweat is shown in Figure 4A. The current change from
the baseline for the alcohol dose concentrations is observed to be 0.5 ± 0.03 µA–2.2 ± 0.007 µA for the
lowest and the highest alcohol dose concentrations respectively. The limit of alcohol detection is found
to be 0.1 mg/dL and the dynamic range is 0.1–100 mg/dL. Figure 4B represents the calibration curve
for glucose concentrations 0.01, 0.1, 1, 10, 50 mg/dL in human sweat. The current changes from the
baseline for 0.01 mg/dL and 50 mg/dL are 0.7 ± 0.2 µA and 1.55 ± 0.5 µA. The lowest detectable glucose
concentration is 0.1mg/dL and the dynamic range of glucose detection in human sweat is 0.1–50 mg/dL.
The dose response for lactate biosensing in human sweat for concentrations 0.1, 1, 10, 50, 100 mM is
shown in Figure 4C. The range of current changes obtained for a low dose of 0.1 mM to a high lactate
dose concentration of 100 mM is observed to be 1.2 ± 0.002 µA to 6.3 ± 0.04 µA. For an SNR of 3, the
LOD and the dynamic range of lactate detection are found to be 1 mM and 1–100 mM respectively.
Lower magnitudes of current changes are observed in human sweat in comparison to synthetic sweat
buffers owing to the contributions of the interferents present in human sweat to noise threshold of the
biosensing
Biosensorssystem.
2018, 8, x FOR PEER REVIEW 10 of 14
A) B)
C)
Figure 4. Calibration
Figure 4. Calibrationdose
doseresponse curvesininhuman
response curves human eccrine
eccrine sweatsweat for detection
for detection of (A) Alcohol
of (A) Alcohol (B)
(B) Glucose (C) Lactate. Chronoamperograms obtained from the biosensing regions shown
Glucose (C) Lactate. Chronoamperograms obtained from the biosensing regions are are shown
as as
figure insets.
figure insets.
3.5. Evaluation of Sensor
3.5. Evaluation Specificity
of Sensor ininSynthetic
Specificity SyntheticSweat pH 66
Sweat pH
As discussed
As discussedpreviously, human
previously, humansweat
sweat consists of other
consists of othercomponents
components thatthat interfere
interfere withwith
the the
detection of the lifestyle biomarker specific to its enzyme thus contributing to the electronic
detection of the lifestyle biomarker specific to its enzyme thus contributing to the electronic noise noise of of
the system from the undesired interactions. For the development of robust multi-biomarker detection
platforms, it is essential to characterize the cross responses obtained from the interactions occurring
between the specific functionalized assay and the non-specific biomarkers. The specificity of the
platform is assessed by allowing the individual biosensor to interact with a non-specific sweat-based
biomarker. We have evaluated the non-specific responses of the biosensing platform in the presence
of cortisol to assess the robustness of the platform in detecting the target biomarkers. The specificityBiosensors 2019, 9, 13 10 of 14
the system from the undesired interactions. For the development of robust multi-biomarker detection
platforms, it is essential to characterize the cross responses obtained from the interactions occurring
between the specific functionalized assay and the non-specific biomarkers. The specificity of the
platform is assessed by allowing the individual biosensor to interact with a non-specific sweat-based
biomarker. We have evaluated the non-specific responses of the biosensing platform in the presence of
cortisol to assess the robustness of the platform in detecting the target biomarkers. The specificity of the
biosensing platform in the presence of various cortisol concentrations spiked in synthetic sweat pH 6 is
carried as outlined in Section 2.6. The average current change obtained from cortisol on interaction with
alcohol oxidase enzyme for the concentration range 0.01–100 mg/dL is 0.3 ± 0.16 µA–2 ± 0.03 µA as
shown in Figure 5A. The cross-reactive response obtained from cortisol interacting with glucose oxidase
enzyme within the range 0.01–50 mg/dL is 2.6 ± 0.14 µA–0.4 ± 0.08 µA as shown in Figure 5B. Similarly,
the current change obtained from the cross-reactive interaction of cortisol with lactate oxidase enzyme
in the range 0.1–10mM is 0.4 ± 0.14 µA–2.4 ± 0.33 µA as shown in Figure 5C. The electrochemical
current
Biosensorsresponses obtained
2018, 8, x FOR from the specific target biomarker–enzyme interactions are ~30% greater
PEER REVIEW 11 of 14
than the cross-reactive current reponses obtained from cortisol interaction with the biosensing platform.
interaction
The withsignal
non-specific the biosensing platform.
obtained from cortisolThe
lies non-specific signal
well within the obtained
established from cortisol
signal–noise lies well
threshold of
within
the system.the established signal–noise threshold of the system.
A) B)
C)
Figure5.5. Specificity
Figure Specificitystudy
study with
with cortisol as
as the
thenon-specific
non-specificmolecule
moleculeininsynthetic
synthetic sweat
sweat pHpH 6 for
6 for (A)
(A) Alcohol
Alcohol biosensor (B)
biosensor(B) Glucose
Glucose biosensor Lactate
biosensor(C) (C) Lactate biosensor.
biosensor
3.6. Continuous Monitoring of Lifestyle Biomarkers in Synthetic Sweat pH 6
Biosensors can be integrated into a wearable platform by enclosing miniaturized sensors into
portable formats with a capability to store data obtained in continuous manner with the intent to
periodically provide a feedback to the user for monitoring physiological conditions. The biosensingBiosensors 2019, 9, 13 11 of 14
3.6. Continuous Monitoring of Lifestyle Biomarkers in Synthetic Sweat pH 6
Biosensors can be integrated into a wearable platform by enclosing miniaturized sensors into
portable formats with a capability to store data obtained in continuous manner with the intent to
periodically provide a feedback to the user for monitoring physiological conditions. The biosensing
platform is subjected to continuous dosing of lifestyle biomarkers spiked in synthetic sweat pH 6 over a
1.5-h window as a proof-feasibility for translation into real-time applications. The continuous biosensing
profiles captured for alcohol, glucose, and lactate on interaction with the enzyme complexes specific to
their detection is shown in Figure 6A–C respectively. With increasing cumulative dose concentrations,
the change in the current response from the baseline is found to be incremental. The incremental current
changes indicate the responsiveness of the immobilized enzyme complex to incremental biomarker
dose concentrations. Slope changes are computed to understand the (1) capability of the biosensing
platform in distinguishing between different dose regimes and (2) dynamic interaction of the target
biomarker–enzyme complex in real-time. The continuous dose response of cumulative alcohol dose
concentrations when dosed continuously in three concentration regimes—0.1, 25, 100 mg/dL—is
depicted in Figure 6A. In reach regime, the doses are applied in succession every 7 min. The slope in
each regime shows an incremental response with a low current slope of 7 nA/min in the 0.1–0.5 mg/dL
regime and a steeper current slope of 200 nA/min in the 225.5–525.5 mg/dL regime. The alcohol
biosensor is less sensitive in the lower concentration regime but begins to show a greater current
response in the higher concentration regime with minimum signs of saturation. In an analogous manner,
the current response of the glucose biosensor when subjected to cumulative dose concentrations in the
regimes—0.1, 10, 50 mg/dL—is depicted in Figure 6B. Incremental glucose concentrations produce an
incremental current change and thus, an incremental slope change in every regime. The slope of the
current change curve from the low to the high regime is 100–300 nA/min. The glucose biosensor is
found to be sensitive to consecutive dose concentrations in each regime with an average change in
current dose of 4 µA from the low dose to the high dose in the low and mid concentration regime, and
6 µA in the highest concentration regime. The continuous biosensing profile of lactate biosensor to
cumulative lactate concentrations in the low, mid, high regimes—1, 50, 100 mM—is represented in
Figure 6C. Similar slope changes of 200 nA/min are observed in the low and the mid regimes which is
indicative of the lactate biosensor being sensitive in the low and mid concentration regime. However,
a low current change slope of 50 nA/min is observed in the higher concentration regime and the slope
tapers off which indicates signal saturation. The continuous lifestyle biomarker monitoring study
reveals the functionality of the biosensor in all concentrations regimes and can be used for detection of
the lifestyle biomarker triad in low volumes of eccrine human sweat.are observed in the low and the mid regimes which is indicative of the lactate biosensor being
sensitive in the low and mid concentration regime. However, a low current change slope of 50 nA/min
is observed in the higher concentration regime and the slope tapers off which indicates signal
saturation. The continuous lifestyle biomarker monitoring study reveals the functionality of the
biosensor in all concentrations regimes and can be used for detection of the lifestyle biomarker triad
Biosensors 2019, 9, 13 12 of 14
in low volumes of eccrine human sweat.
A) B)
C)
Continuousmonitoring
Figure6.6.Continuous
Figure monitoringofof(A)
(A)Alcohol
Alcohol(B)
(B)Glucose
Glucose(C)
(C)Lactate
Lactateininsynthetic
syntheticsweat
sweatpH
pH6.6.
4. Conclusions
In summary, we have demonstrated the development and functionality of a novel, flexible,
non-invasive multi-biomarker detection platform suitable for wearable applications. This work
outlines the biosensing capabilities of the biomarker detection platform in steady state as well as in
a continuous format for up to 1.5 h with minimal signs of signal saturation. We have demonstrated
robust detection of alcohol, glucose, and lactate in their physiologically relevant ranges in 1–5 µL sweat
volumes on a hybrid metal–metal oxide biosensing platform. Biosensing is achieved by capturing
the charge–discharge current responses occurring at the electrode–sweat interface. The fidelity
of the enzyme complex binding to the active biosensing region is confirmed by electrochemically
characterizing the current responses obtained from the binding of each enzyme complex component.
pH studies revealed stable biosensing and the response of the system is preserved in pH variant sweat
conditions. The limit of detection for biomarker detection in human sweat was established to be
one logarithmic concentration lower and the dynamic range was established to be one logarithmic
concentration higher than the physiological relevant range of the biomarkers. The immobilized
enzymatic assays specific to each biomarker in the presence of cortisol as the non-specific molecule
produced a specific response with minimal cross-talk from the interferents. The developed biosensing
platform on integration with portable electronics has the potential to be a self-monitoring wearable
device for real-time tracking of human lifestyle.Biosensors 2019, 9, 13 13 of 14
Author Contributions: S.M. and S.P. conceived the theoretical framework of biosensing for this work. S.P. and
A.B. designed the experiments; A.B. performed the sensor fabrication used in the experiments. A.B. and S.C.
performed the experiments. A.B. and S.C. analyzed the experimental data and wrote the paper. S.M. and S.P.
reviewed the manuscript.
Funding: Funding for this research was supported by the National Institute on Alcohol Abuse and Alcoholism of
the National Institutes of Health (R43AA026114).
Acknowledgments: The authors would like to acknowledge the contributions of Saigautam Sirivella for assistance
in performing experiments.
Conflicts of Interest: Shalini Prasad and Sriram Muthukumar have a significant interest in Enlisense LLC,
a company that may have a commercial interest in the results of this research and technology. The potential
individual conflict of interest has been reviewed and managed by The University of Texas at Dallas, and played
no role in the study design; in the collection, analysis, and interpretation of data; in the writing of the report, or in
the decision to submit the report for publication.
References
1. Wade, J. Wearable Technology Statistics and Trends 2018. Smart Insights. Available online: https://www.
smartinsights.com/digital-marketing-strategy/wearables-statistics-2017/ (accessed on 15 November 2017).
2. Piwek, L.; Ellis, D.A.; Andrews, S.; Joinson, A. The Rise of Consumer Health Wearables: Promises and
Barriers. PLoS Med. 2016, 13, e1001953. [CrossRef] [PubMed]
3. Swan, M. Sensor Mania! The Internet of Things, Wearable Computing, Objective Metrics, and the Quantified
Self 2.0. J. Sens. Actuator Netw. 2012, 1, 217–253. [CrossRef]
4. Kovalchick, C.; Sirkar, R.; Regele, O.B.; Kourtis, L.C.; Schiller, M.; Wolpert, H.; Alden, R.G.; Jones, G.B.;
Wright, J.M. Can composite digital monitoring biomarkers come of age? A framework for utilization. J. Clin.
Transl. Sci. 2017, 1, 373–380. [CrossRef] [PubMed]
5. Robinson, S.; Robinson, A.H. Chemical Composition of Sweat. Physiol. Rev. 1954, 34, 202–220. [CrossRef]
[PubMed]
6. Moyer, J.; Wilson, D.; Finkelshtein, I.; Wong, B.; Potts, R. Correlation between sweat glucose and blood
glucose in subjects with diabetes. Diabetes Technol. Ther. 2012, 14, 398–402. [CrossRef] [PubMed]
7. Gamella, M.; Campuzano, S.; Manso, J.; Rivera, G.G.; Lopez-Colino, F.; Reviejo, A.J.; Pingarron, J.M. A novel
non-invasive electrochemical biosensing device for in situ determination of the alcohol content in blood by
monitoring ethanol in sweat. Anal. Chim. Acta 2014, 806, 1–7. [CrossRef] [PubMed]
8. Sakharov, D.A.; Shkurnikov, M.U.; Vagin, M.Y.; Yashina, E.I.; Karyakin, A.A.; Tonevitsky, A.G. Relationship
between Lactate Concentrations in Active Muscle Sweat and Whole Blood. Bull. Exp. Biol. Med. 2010, 150,
83–85. [CrossRef]
9. Bhide, A.; Muthukumar, S.; Saini, A.; Prasad, S. Simultaneous lancet-free monitoring of alcohol and glucose
from low-volumes of perspired human sweat. Sci. Rep. 2018, 8, 6507. [CrossRef]
10. Jia, W.; Bandodkar, A.J.; Valdés-Ramírez, G.; Windmiller, J.R.; Yang, Z.; Ramírez, J.; Chan, G.; Wang, J.
Electrochemical Tattoo Biosensors for Real-Time Noninvasive Lactate Monitoring in Human Perspiration.
Anal. Chem. 2013, 85, 6553–6560. [CrossRef]
11. Lee, H.; Choi, T.K.; Lee, Y.B.; Cho, H.R.; Ghaffari, R.; Wang, L.; Choi, H.J.; Chung, T.D.; Lu, N.; Hyeon, T.; et al.
A graphene-based electrochemical device with thermoresponsive microneedles for diabetes monitoring and
therapy. Nat. Nanotechnol. 2016, 11, 566. [CrossRef]
12. Gao, W.; Emaminejad, S.; Nyein, H.Y.Y.; Challa, S.; Chen, K.; Peck, A.; Fahad, H.M.; Ota, H.; Shiraki, H.;
Kiriya, D.; et al. Fully integrated wearable sensor arrays for multiplexed in situ perspiration analysis. Nature
2016, 529, 509–514. [CrossRef] [PubMed]
13. Anastasova, S.; Crewther, B.; Bembnowicz, P.; Curto, V.; Ip, H.M.; Rosa, B.; Yang, G.Z. A wearable multisensing
patch for continuous sweat monitoring. Biosens. Bioelectron. 2017, 93, 139–145. [CrossRef] [PubMed]
14. Palanisamy, S.; Devasenathipathy, R.; Chen, S.; Ajmal Ali, M.; Karuppiah, C.; Balakumar, V.; Prakash, P.;
Elshikh, M.S.; Al-Hemaid, F. Direct Electrochemistry of Glucose Oxidase at Reduced Graphene Oxide and
β-Cyclodextrin Composite Modified Electrode and Application for Glucose Biosensing. Electroanalysis 2015,
27, 2412–2420. [CrossRef]Biosensors 2019, 9, 13 14 of 14
15. Kim, J.; Jeerapan, I.; Imani, S.; Cho, T.N.; Bandodkar, A.; Cinti, S.; Mercier, P.P.; Wang, J. Noninvasive Alcohol
Monitoring Using a Wearable Tattoo-Based Iontophoretic-Biosensing System. ACS Sens. 2016, 1, 1011–1019.
[CrossRef]
16. Babor, T.; Rehm, J.; Jernigan, D.; Vaeth, P.; Monteiro, M.; Lehman, H. Alcohol, diabetes, and public health in
the Americas. Revista Panamericana De Salud Pública 2012, 32, 151. [CrossRef] [PubMed]
17. Emanuele, N.V.; Swade, T.F.; Emanuele, M.A. Consequences of alcohol use in diabetics. Alcohol Health
Res. World 1998, 22, 211–219. [PubMed]
18. Adelsmayr, G.; Brunner, R.; Holzinger, U. Impact of blood glucose on blood lactate levels in a medical ICU:
A retrospective cohort study. Crit. Care 2012, 16, P165. [CrossRef]
19. Mizock, B.A.; Falk, J.L. Lactic acidosis in critical illness. Crit. Care Med. 1992, 20, 80–93. [CrossRef]
20. Mathew, M.T.; Ariza, E.; Rocha, L.A.; Fernandes, A.C.; Vaz, F. TiCxOy thin films for decorative applications:
Tribocorrosion mechanisms and synergism. Tribol. Int. 2008, 41, 603–615. [CrossRef]
21. Du, X.; Anzai, J.; Osa, T.; Motohashi, R. Amperometric alcohol sensors based on protein multilayers composed
of avidin and biotin-labeled alcohol oxidase. Electroanalysis 1996, 8, 813–816. [CrossRef]
22. Munje, R.D.; Muthukumar, S.; Prasad, S. Lancet-free and label-free diagnostics of glucose in sweat using
Zinc Oxide based flexible bioelectronics. Sens. Actuators B Chem. 2017, 238, 482–490. [CrossRef]
23. Scholz, F. Voltammetric techniques of analysis: The essentials. ChemTexts 2015, 1, 17. [CrossRef]
24. Munje, R.D.; Muthukumar, S.; Selvam, A.P.; Prasad, S. Flexible nanoporous tunable electrical double layer
biosensors for sweat diagnostics. Sci. Rep. 2015, 5, 14586. [CrossRef] [PubMed]
25. Sonner, Z.; Wilder, E.; Heikenfeld, J.; Kasting, G.; Beyette, F.; Swaile, D.; Sherman, F.; Joyce, J.; Hagen, J.;
Kelley-Loughnane, N.; et al. The microfluidics of the eccrine sweat gland, including biomarker partitioning,
transport, and biosensing implications. Biomicrofluidics 2015, 9, 031301. [CrossRef] [PubMed]
26. Omar, F.M.; Aziz, H.A.; Stoll, S. Aggregation and disaggregation of ZnO nanoparticles: Influence of pH and
adsorption of Suwannee River humic acid. Sci. Total Environ. 2014, 468–469, 195–201. [CrossRef] [PubMed]
27. Heinonen, S.; Nikkanen, J.; Huttunen-Saarivirta, E.; Levänen, E. Investigation of long-term chemical stability
of structured ZnO films in aqueous solutions of varying conditions. Thin Solid Films 2017, 638, 410–419.
[CrossRef]
28. Armbruster, D.A.; Pry, T. Limit of Blank, Limit of Detection and Limit of Quantitation. Clin. Biochem. Rev.
2008, 29, S52.
© 2019 by the authors. Licensee MDPI, Basel, Switzerland. This article is an open access
article distributed under the terms and conditions of the Creative Commons Attribution
(CC BY) license (http://creativecommons.org/licenses/by/4.0/).You can also read