Allelopathy as a Factor of Improving Anti-hyperglycaemic Activities of - SciHub.org
←
→
Page content transcription
If your browser does not render page correctly, please read the page content below
AGRICULTURE AND BIOLOGY JOURNAL OF NORTH AMERICA
                      ISSN Print: 2151-7517, ISSN Online: 2151-7525, doi:10.5251/abjna.2020.11.1.5.23
                                    © 2020, ScienceHuβ, http://www.scihub.org/ABJNA

     Allelopathy as a Factor of Improving Anti-hyperglycaemic Activities of
                   Tithonia diversifolia and Murraya koenigii
     Oluwatomi Bolanle Agboola1, Olutobi Olufunmilayo Otusanya2, Adeleke Clement
                      Adebajo1,3,* and Ifeoluwa Isaac Ogunlowo1
 1
  Department of Pharmacognosy, Faculty of Pharmacy, Obafemi Awolowo University, Ile-Ife.
   Nigeria; 2Department of Biological Sciences, College of Natural and Applied Sciences,
  Wesley University, Ondo, Nigeria; 3Department of Pharmacognosy and Herbal Medicine,
  School of Pharmacy, University of Health and Allied Sciences, Ho, Volta Region. Ghana.
       *: Address correspondence to: Prof. Adeleke Clement Adebajo, Department of
 Pharmacognosy, Faculty of Pharmacy, Obafemi Awolowo University, Ile Ife, Nigeria. E-mail:
caadebajo@gmail.com, cadebajo@uhas.edu.gh; Phone: +2348033679390, +233505960684.
                                                         ABSTRACT
        Tithonia diversifolia (Tithonia), with allelopathic activity report, and Murraya koenigii (Curry) are used
        ethnomedicinally as antidiabetics in Nigeria. Separately established one week old shoots of M. koenigii
        and seedlings of T. diversifolia (N = 15) were divided into regimes and given daily, mornings and
        evenings, 800 mL of water Tithonia (TNC) and Curry (MNC) negative controls, or aqueous extracts of
        fresh shoots of Curry (TTM) or Tithonia (MTT) or water for co-planted Tithonia (TPM) and Curry (MPT)
        for 20 weeks. The plant growth parameters (N = 5) were measured up till the 10th week, and anti-
        hyperglycaemic activity of their leaf, stem and root extracts were assayed using glucose-loaded wistar
        rats. Appropriate statistical model was used. The results showed that Curry increased the growth
        parameters and yields of Tithonia, and produced significantly higher anti-hyperglycaemic activities of
        its leaf, stem and root, an evidence of allelopathic relationship between Tithonia and Curry. Also,
        Tithonia significantly enhanced antihyperglycaemic activity of Curry leaf and produced an inhibitory
        effect of its root. Allelopathic effects were probably by modulating enzymatic activity of biogenesis of
        the plants’ anti-hyperglycaemic constituents. Hence, allelopathy is suggested as a factor in improving
        the desired hyperglycaemia-lowering activities of Tithonia and Curry.
         Keywords: Allelopathic relationship, Tithonia diversifolia, Murraya koenigii, anti-hyperglycaemic
         activity, growth parameters.
                                                         (Otusanya and Ilori, 2012), but majorly in leaves
INTRODUCTION
                                                         (Chandra and Mali, 2012). Since allelochemicals are
Allelopathy, a phenomenon known for over 2000 years      generally present in minute quantities in different plant
(Kruse et al., 2000; Willis, 2007), is described as both tissues, chemical techniques are not sensitive enough
positive (sympathetic) and negative (pathetic)           to detect them. Hence, the use of bioassays that are
biochemical interactions between microorganisms and      more sensitive than chemical methods have been
plants, and in-between plants (An et al., 1998;          suggested (Chandra and Mali, 2012).
Agboola, 2015). For allelopathic effects to be
                                                         Tithonia diversifolia (Hemsl.) A. Gray (Asteraceae)
produced in plants, it has been shown that
                                                         known as sunflower (Sharrock et al., 2004), is also
“allelochemicals” must come in contact with such
                                                         used as manure (Olabode et al., 2007). Its positive and
plants at their sensitive stages of development (Kruse
                                                         negative allelopathic activities (Olabode et al., 2007;
et al., 2000). These “allelochemicals” are secondary
                                                         Oke et al., 2011) have been reported and these are
metabolites that are synthesized in the plants during
                                                         suspected to be most effective when the plant is alive
their growth and developmental period (Asaduzzaman
                                                         and fresh (Taiwo and Makinde, 2005). Although,
et al., 2010). Also, they are generally water soluble
                                                         ethanolic extract of the aerial parts is reported toxic to
(Iman et al., 2006) and are released into the
                                                         animals (Elufioye et al., 2009), the whole herb has
environment by ecological processes of volatilization,
                                                         significantly reduced blood glucose levels (Miura et al.,
leaching, root exudation or decomposition of plant
                                                         2002, 2005). Murraya koenigii (Linn.) Sprengor
residues (Gupta and Mittal, 2012). Presently, they
                                                         (Rutaceae) commonly called Curry leaf tree, is also
have been reportedly found in nearly all plant parts
                                                         used ethnomedicinally in the management of diabetes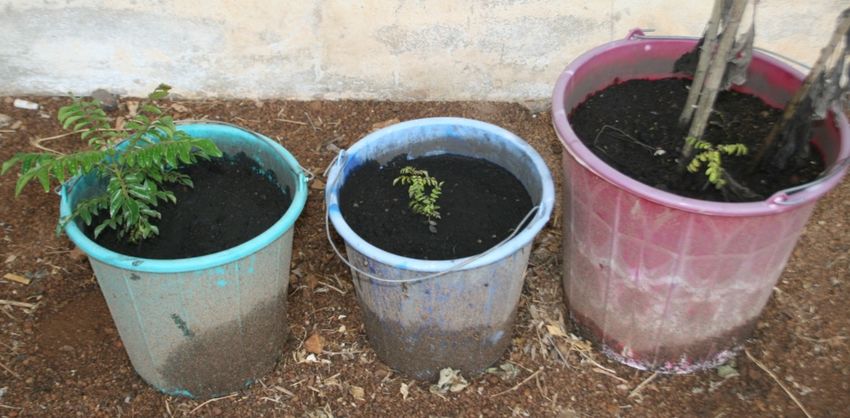
Agric. Biol. J. N. Am., 2020, 11(1):5-23

(Adebajo et al., 2004, 2006). Its petroleum ether,                 Ademoriyo, Department of Botany, Obafemi Awolowo
methanol and aqueous extracts have been found                      University (O.A.U.), Ile-Ife, and their respective
tolerable to a maximum dose of 2,000 mg/kg                         voucher specimens IFE-17458 and IFE-17438, were
(Lanjhiyana et al., 2011). In addition to its folkloric uses       deposited in the IFE herbarium of the Botany
as an anti-dysentery and anti-diabetes, its leaf                   Department.
methanolic extract was moderately toxic (LD50 =
                                                                   Seventy-two grams each of the tender fresh shoots of
316.23 mg/kg body weight) to rats and at higher doses
                                                                   T. diversifolia or M. koenigii were cut into small chips
had appreciable effect on the liver and kidney, leading
                                                                   of about 4 cm, milled to a coarse texture and soaked
to liver inflammation (Adebajo et al., 2006). Although
                                                                   in 1 L of water for 12 h. The resulting extract was first
there is no allelopathic activity reported for M. koenigii,
                                                                   filtered through cheese cloth to remove fibre debris,
it has been observed that it prohibits the growth of
                                                                   and afterwards through Whatman No. 1 filter paper.
other plants under its shade (Adebajo, 1997).
                                                                   The filtrate obtained was the fresh shoot aqueous
Diabetes mellitus is a group of metabolic diseases that            extract, prepared once daily and kept in the fridge (4°
is characterised by hyperglycaemia as a result of                  C) until needed (Ahn and Chung, 2000).
derangement in the metabolism of carbohydrate,
                                                                   Cultivation of regimes of T. diversifolia and M.
protein and fat and arises from defects in insulin
                                                                   koenigii: Tithonia diversifolia and M. koenigii
secretion, its action or both (Jadhav and
                                                                   seedlings from the nursery were transplanted into
Puchchakayala, 2012). Oral glucose tolerance test
                                                                   perforated plastic buckets filled with top humus soil
(OGTT) (Kumar et al., 2011), which measures ability
                                                                   and supplied with water for the first two weeks, to
to utilise glucose, produces transient hyperglycaemia
                                                                   ensure their establishment, prior to treatment. The
and its use has been suggested in diagnosing pre-
                                                                   temperature range was 28-32° C during the day and
diabetes and diabetes (Thongsom et al., 2013) as well
                                                                   24-27° C at night. Following a modification of previous
as measuring anti-hyperglycaemic (hyperglycaemia-
                                                                   methodology (Otusanya et al., 2007; Oyerinde et al.,
lowering ) activity of plants, extracts and drugs
                                                                   2009; Oke et al., 2011), seedlings in each bucket were
(Verspohl, 2002; Adebajo et al., 2007). Also, diabetes
                                                                   thinned down to four. The T. diversifolia and M.
is incurable, has serious complications and most of the
                                                                   koenigii plants were given daily, mornings and
existing synthetic oral hypoglyceamic agents are
                                                                   evenings for a period of 20 weeks, 800 mL of water or
expensive and have many undesirable side effects
                                                                   appropriate aqueous extract, as indicated below and
(Tembhurne and Sakarkar, 2009). Hence, in our
                                                                   divided into the following six regimes, of fifteen
laboratory, we have continued investigations of plants
                                                                   buckets each:
with anti-diabetic ethnomedicinal use in order to justify
                                                                   Tithonia negative control (TNC) regime: T. diversifolia
their use and possibly identify their active constituents
                                                                         grown alone and given 800 mL of water,
(Alade et al., 2011, 2012; Adebajo et al., 2004, 2006,
                                                                   Tithonia treated with Murraya (TTM) regime: T.
2007, 2009, 2013a,b; Ayoola et al., 2017, 2019).
                                                                         diversifolia grown alone and given 800 mL of
Furthermore, since allelochemicals have been
                                                                         aqueous extract of M. koenigii,
reported to affect plant metabolisms (Dadkhah, 2012;
                                                                   Tithonia co-planted with Murraya (TPM) regime: T.
Gupta and Mittal, 2012), we investigated the
                                                                         diversifolia grown together with M. koenigii and
allelopathic relationship between T. diversifolia and M.
                                                                         given 800 mL of water,
koenigii and its effects on the anti-hyperglycaemic
                                                                   Murraya negative control (MNC) regime: M. koenigii
activities of these two plants.
                                                                         grown alone and given 800 mL of water,
MATERIALS AND METHODS                                              Murraya treated with Tithonia (MTT) regime: M.
                                                                         koenigii grown alone and given 800 mL of
Equipment and chemicals: Accu-Chek® Active
                                                                         aqueous extract of T. diversifolia,
Glucometer (GC Model) with Accu-Chek Active Test
                                                                   Murraya co-planted with Tithonia (MPT) regime: M.
strips (Roche Diagnostics, Mannheim, Germany),
                                                                         koenigii grown together with T. diversifolia and
glibenclamide (Hovid Bhd, Malaysia) and Whatman
                                                                         given 800 mL of water.
No. 1 filter paper were used.
                                                                   Measurement of the growth parameters: The plant
Collection of plant materials and preparation of the
                                                                   shoot height, leaf length and width were measured
aqueous extracts: Young shoots of M. koenigii, which
                                                                   weekly, for 10 weeks. Also, the leaf areas were
were about a week after sprouting from the rhizomes,
                                                                   calculated. All the measurements were done in five
and seeds of T. diversifolia were collected. These
                                                                   replicates and the mean calculated (Oyerinde et al.,
plants were identified and authenticated by Mr. G.A.
                                                                   2009).

                                                               6
Agric. Biol. J. N. Am., 2020, 11(1):5-23
Harvesting of the various regimes of the two glucometer. This measurement was repeated at 0.5,
plants: The six regimes given above, were harvested 1.0, 2.0 and 4.0 h after administration of normal saline,
at the end of the twenty weeks of treatment. They were extract or drug (Adebajo et al., 2013a,b; Ayoola et al.,
carefully uprooted using forceps to tease around the 2017).
soil surrounding the roots, the soil debris washed off
Statistical analysis: The glucose levels of five
and blotted dry to remove any surface moisture. They
animals in each group (N = 5) and the quantitative
were thereafter separated into their leaves, stems and
measurements of botanical parameters (N = 5) were
roots. The leaves were air dried while the stems and
expressed as mean ± SEM. Data obtained were
roots were oven (40° C) dried. They were separately
subjected to one way analysis of variance (ANOVA),
powdered and weighed (Thongsom et al., 2013;
followed by Dunnett range and Student-Newman-
Bantie and Gebeyehu, 2015).
Keul's post hoc tests for comparisons to determine the
Extraction of the various regimes: Powdered source of significant differences. Values of p < 0.05
samples of the different parts (leaf, stem and root) of were considered to be of statistical significance.
M. koenigii and T. diversifolia regimes were weighed
RESULTS AND DISCUSSION
into conical flasks, and soaked in methanol for 72
hours, with occasional stirring. They were filtered Justification of the study: Selection of optimum
using filter papers and the extractions were repeated factors for cultivation of medicinal plants, such as
3 times. The individual extracts were separately application of manure, targeted times and seasons of
bulked, concentrated and allowed to dry in a collection, consideration of altitude, rain, pH of soil,
desiccator. Their dried weights, after 48 hours, were etc. or the use of tissue culture in production of
recorded and their yields calculated (Bantie and pharmaceuticals are used in obtaining plants or clones
Gebeyehu, 2015). with desired active constituents and
biological/pharmacological actions (Evans, 2009). In
Animals: Animals used were healthy Wistar rats
continuation of our study of factors that would increase
(150–250 g) of either sex bred under standard
yield of volatile oils of plants, plant constituents and
conditions (temp. 27±3° C, relative humidity 65 %) and
improve their biological activities (Adebajo et al., 1989,
natural 12 h daylight/night cycle in the animal house of
1997; Onayade et al., 1999), we investigated whether
the Department of Pharmacology, Faculty of
allelopathic study could be included among these
Pharmacy, O.A.U., Ile-Ife, Nigeria. The animals were
factors. Since anti-hyperglycaemic activities have
kept in different cages based on their sex and
been reported for both T. diversifolia and M. koenigii
acclimatised by maintaining them under experimental
(Miura et al., 2002, 2005; Adebajo et al., 2004, 2006)
conditions for about 7 days, prior to drug
and bioassays are reported more sensitive than
administration. They were fed on a standard pellet diet
chemical methods in establishing allelopathic
(Bendel Feeds, Nigeria) and water was given ad
relationships (Chandra and Mali, 2012), the OGTT
libitum. Principles of laboratory animal care (NIH
assay, in addition to thin layer chromatography (TLC),
Publication no.85-23) were followed in this study
was used in this study to establish allelopathic activity
(Adebajo et al., 2004, 2006; Ayoola et al., 2017).
between T. diversifolia and M. koenigii.
Anti-hyperglycaemic assays of the extracts: The
There are reports of allelopathy for centuries (An et al.,
anti-hyperglycaemic activities of the extracts obtained
1998; Kruse et al., 2000; Willis, 2007; Agboola, 2015),
from the different parts of various T. diversifolia and M.
however its use in obtaining plants with improved or
koenigii regimes were determined using OGTT model.
desired pharmacological/biological activities or
A 10 g/kg glucose was given orally (p.o.) to normal rats
selecting plants with higher pharmacological activity
that were fasted overnight for 18 h and those with
for drug development is unknown. In a general sense,
blood glucose level > 7.0 mmol/L (126 mg/dL) after 0.5
there are also reports of allelochemicals affecting
hour (time point 0.0 hour, T0) were presumed
electron transport, root elongation, nutrient uptake,
hyperglycaemic (Adebajo et al., 2013a,b; Ayoola et al.,
enzymes activity, chlorophyll content, protein
2017). Groups of five animals each, of these glucose-
synthesis and photosynthetic rate (Dadkhah, 2012;
induced hyperglycaemic rats were given normal saline
Gupta and Mittal, 2012). Since allelochemicals
(negative control), various extracts (100, 200 and 400
modulate enzymes’ activity and protein synthesis
mg/kg) and glibenclamide (5 mg/kg, positive control).
(Dadkhah, 2012; Gupta and Mittal, 2012), they should
A drop of blood, taken from the tip of the tail of each
therefore, theoretically, influence the in situ
rat, was dropped onto a Glucometer strip and the
biosynthesis of pharmacologically active constituents
blood glucose levels were read off directly from the
7Agric. Biol. J. N. Am., 2020, 11(1):5-23
in plants with their consequent effect on the desired (Kruse et al., 2000). Major source of allelochemicals
pharmacological actions of such plants. This are leaves (Chandra and Mali, 2012).
hypothesis was tested in this study, by evaluating the
The leaf areas of the T. diversifolia TTM and TNC
possibility of allelopathy to significantly increase the
regimes were comparable between the first 4 weeks.
anti-hyperglycaemic activity of plants used
However, betweeen the 5th and 10th weeks, the leaf
ethnomedicinally in Nigeria as antidiabetics. The
areas of TTM were significantly higher than those of
contribution to knowledge at the end of this study
TPM and TNC (Fig. 2). Probably for the same reasons
would be to establish allelopathy as a modulating
given above (Kruse et al., 2000; Taiwo and Makinde,
factor in increasing anti-hyperglycaemic activities of
2005; Iman et al., 2006; Olabode et al., 2007; Oke et
African ethnomedicinal plants. This should be a
al., 2011; Chandra and Mali, 2012), the increased
corollary to selection of optimum factors of cultivation
Tithnonia shoot heights and leaf areas (Figs. 1, 2)
of medicinal plants with desired active constituents
confirmed the stimulatory allelopathic effect of Curry
and biological/pharmacological actions (Evans, 2009).
leaf tree on Tithonia. These results also further
Effects of allelopathy on Tithonia shoot heights confirmed that allelochemicals responsbile for this
and leaf areas : Regimes are defined as the different allelopathic effect were more concentrated in Curry
treatment groups of the plants used in the experiment fresh shoots (stem and leaves) than its root exudates
(Agboola, 2015). The shoot heights of T. diversifolia (Chandra and Mali, 2012) and in already growing
negative control (TNC), T. diversifolia co-planted with Curry shrubs or trees that are alive and fresh (Taiwo
M. koenigii (TPM) and T. diversifolia treated with M. and Makinde, 2005; Olabode et al., 2007; Oke et al.,
koenigii extract (TTM) regimes were comparable (p > 2011). There are similar reports of stimulatory effects
0.05) at 1-2 weeks, while those of TPM and TNC were of the fresh shoot aqueous extract of T. diversifolia on
comparable up till the fifth week. From the 3rd to the the shoot heights and leaf areas of Cleome gynandra
10th week, the heights of the TTM regime were (spider plant) and Zea mays (maize) (Oyerinde et al.,
significantly (p < 0.05) higher than those of the TNC 2009; Musiyimi et al., 2012; Aladejimokun et al., 2014),
and the TPM regimes, while those of TPM regime as well as those of other plants (Taiwo and Makinde,
were higher than those of the TNC, in the 6th and 8- 2005; Olabode et al., 2007; Oke et al., 2011; Chandra
10th weeks (Fig. 1). It was therefore obvious that M. and Mali, 2012; Otusanya and Ilori, 2012).
koenigii had a stimulatory allelopathic effect on the
Furthermore, the TPM leaf area was significantly
shoot height of T. diversifolia. This effect was greater
higher that those of TTM and TNC at 1-4 weeks, but
in Tithonia regime watered with aqueous extract of M.
was comparable to that of TNC betweeen the 5th and
koenigii (TTM) than when it was co-planted with Curry
10th weeks (Fig. 2). Since the growth stimulation
(TPM) (Fig.1). This could be because in the early
observed between 8th and 10th weeks in shoot height
stage (1-5 weeks) of the experiment, allelochemicals
of the TPM regime (Fig. 1) was not sustained in the
were either yet to be formed in the co-planted M.
leaf area (Fig. 2), the positive allelopathic effect of co-
koenigii (TPM) regime (Asaduzzaman et al., 2010), or
planting Curry Leaf with Tithonia (TPM) was doubtful.
during the sensitive periods of Tithonia development,
newly bio-synthesised allelochemicals in the Curry The Curry Leaf tree MPT, MTT and MNC regimes,
plant were not readily released into the soil by the respectively had comparable heights of 4.72 ± 0.40,
ecological processes of leaching and root exudation 5.12 ± 0.15 and 4.46 ± 0.36 cm, indicating that the M.
(Gupta and Mittal, 2012) or had problems with their koenigii regimes stopped growing at the 6th week. At 1
absorption through Tithonia roots (Kruse et al., 2000). - 10th weeks, shoot heights of MPT and MTT regimens
Furthermore, the significantly greater allelopathic were comparable, while between the 1st and 3rd
influence observed with the Tithonia TTM regime may weeks, the shoot heights of MPT and MTT regimens
probably be because Curry allelochemicals were were significantly higher than that of the MNC. Also, at
water soluble (Iman et al., 2006) and more easily 4-5 weeks, only MTT regime was significantly higher
absorbed through the Tithonia roots (Kruse et al., than MNC group (Fig. 3). Therefore, the
2000). Also, there may have been a higher allelochemicals present in the aqueous extracts
concentration of bio-synthesised allelochemicals prepared from fresh shoots of Tithonia gave significant
residing in the fresh shoot aqueous extract that was stimulatory allelopathic effects on growth of Curry leaf.
prepared from the already grown Curry leaf tree
8Agric. Biol. J. N. Am., 2020, 11(1):5-23
Fig.1. Comparison of shoot heights of the different Tithonia diversifolia regimes.
60
*
Plant height (cm)
50
* * * *
40
* *
30 * * TTM
20
* * TPM
* TNC
10
0
1 2 3 4 5 6 7 8 9 10
Weeks
TTM: Tithonia diversifolia treated with Murraya koenigii aqueous extract; TPM: Tithonia diversifolia co-planted with
Murraya koenigii; TNC: Tithonia diversifolia planted alone (negative control); data were expressed as Mean ± SEM
and subjected to one way analysis of variance (ANOVA), followed by Dunnett range and Student Newman Keul's
post hoc tests for comparisons to determine the source of significant differences. *: Values at each time point were
significantly different (p < 0.05) from those of the negative control group. N = 5.
Fig 2. Comparison of leaf areas of the different Tithonia diversifolia regimes.
* *
120
100
* *
Leaf Area cm2
80
60 * * TTM
40 *
* * *
TPM
20 TNC
0
1 2 3 4 5 6 7 8 9 10
Weeks
TTM: Tithonia diversifolia treated with Murraya koenigii aqueous extract; TPM: Tithonia diversifolia co-planted with
Murraya koenigii; TNC: Tithonia diversifolia planted alone (negative control); data were expressed as Mean ± SEM
and subjected to one way analysis of variance (ANOVA), followed by Dunnett range and Student Newman Keul's
post hoc tests for comparisons to determine the source of significant differences. *: Values at each time point were
significantly different (p < 0.05) from those of the negative control group. N = 5.
9Agric. Biol. J. N. Am., 2020, 11(1):5-23
Hence, in addition to the use of Tithonia as manure addition to modulating effects of the copious and
(Olabode et al., 2007; Oke et al., 2011), positive evergreen foliage that M. koenigii produces, which
allelopathic activity of T. diversifolia on Curry leaf tree was earlier suggested to prevent growth of other
that was demonstrated in this study (Fig. 3) may plants under its shade (Adebajo, 1997).
confirm allelopathy as a factor of growth stimulation of
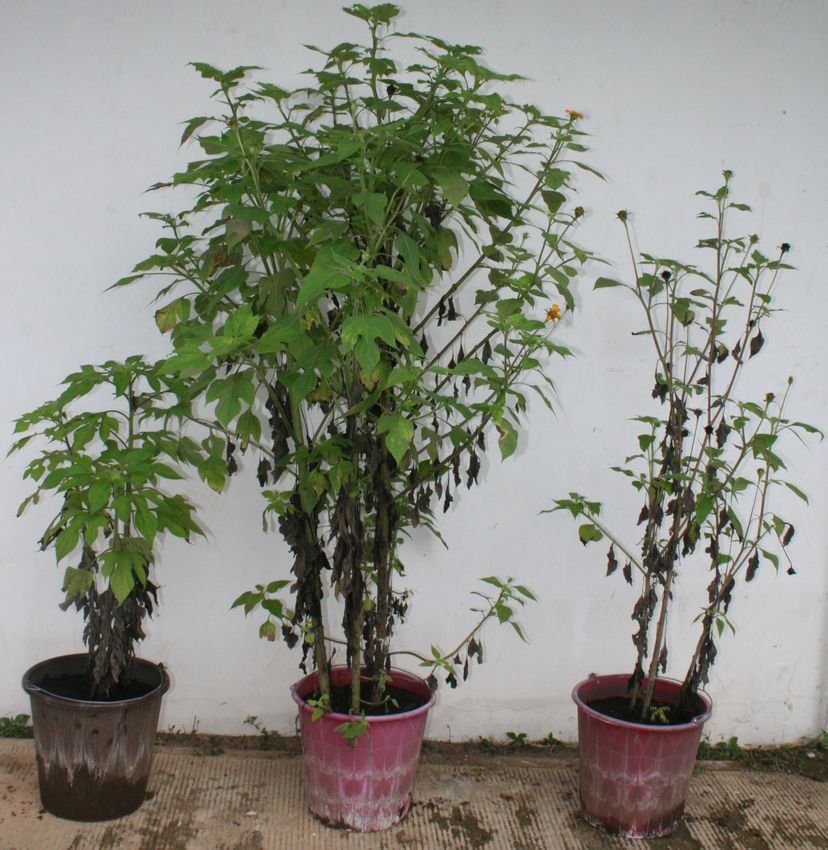
On the other hand, the order of dried weight yields of
M. koenigii. The same reasons given earlier (Kruse et
the leaf, stem and root of M. koenigii regimes was
al., 2000; Taiwo and Makinde, 2005; Olabode et al.,
MNC (MC) > MTT > MPT (Fig. 6). This represented an
2007; Asaduzzaman et al., 2010; Oke et al., 2011;
inhibitory allelopathic influence of T. diversifolia on M.
Chandra and Mali, 2012; Gupta and Mittal, 2012;
koenigii that was confirmed by the picture of the pots
Otusanya and Ilori, 2012) for establishing allelopathy,
containing these regimes (Fig. 7). Since this inhibitory
occasioned by the allelochemicals present in Curry
effect was highest in the MPT regime (Figs. 6, 7), it
leaf tree, as a factor of growth stimulation of T.
suggested that the inhibitory allelochemicals of T.
diversifolia (Figs. 1, 2) might be responsible for similar
diversifolia were produced more insitu and released as
ability demonstrated for Curry leaf tree (Fig. 3).
root exudates when grown together with Curry.
However, this effect was not replicated in the leaf area,
However, its already grown shoot contained
as values of all the three regimes were comparable.
stimulatory allelochemicals that were only active for 5
Dried weight yields: The dried leaf, stem and root months (short acting). Similarly, the aqueous extract
weight yields of the Tithonia regimes was in the order of T. diversifolia demonstrates significant inhibitory
of TTM > TPM > TNC (Fig. 4), which indicated that effects on the dried weight of the seedling shoots of
TTM regime gave the greatest dried weight yields. The Amaranthus cruentus (Otusanya et al., 2007).
picture of the pots containing these regimes (Fig. 5)
Anti-hyperglycaemic activity of T. diversifolia leaf
showed that the TTM had profuse growth and thereby
regimes: The maximal blood glucose levels of the
supported its highest dried leaf, stem and root weight
glucose-loaded rats given Tween 80 in normal saline
yields. These results (Figs. 4, 5), together with the
(hyperglycaemic negative control group, NC) were at
stimulatory allelopathic effect of M. koenigii on the
0.5 h after glucose load, which was taken as 0.0 h (T0)
shoot height and leaf area of T. diversifolia (Figs. 1, 2),
for the experiment (Tables 1 – 5). This was in
confirmed that the water soluble allelochemicals of M.
agreement with reports that ingested glucose takes an
koenigii were more concentrated in shoots of the
half hour to be absorbed from the intestine or guts (Kar
already grown Curry plants and easily absorbed
et al., 1999; Verspohl, 2002; Adebajo et al., 2007,
through Tithonia roots (Gupta and Mittal, 2012;
2013a,b; Ayoola et al., 2017, 2019). Hence, the
Morikawa et al., 2012; Otusanya and Ilori, 2012).
extracts (100-400 mg/kg) and glibenclamide (Pc, 5
Similar significant increases in the dry weights of C.
mg/kg) were given p.o. to the rats that were
gynandra and Z. mays, which represented stimulation
hyperglycaemic (blood glucose level > 7.0 mmol/L or
in growth, occur when watered with the aqueous
126 mg/dL) at this time (T0). The observed time-
extract of T. diversifolia, (Oyerinde et al., 2009;
dependent reduction (T0-T4) of the glucose levels of
Musiyimi et al., 2012).
the NC group of rats (Tables 1 - 5, Figs. 8 - 12) was
Furthermore, the picture (Fig. 5) showed that the due to homeostatic regulatory mechanisms, which
Tithonia planted together with Curry plant (TPM) was naturally brings the glucose levels back to normalcy,
in poorer state of growth than the Tithonia negative 1.5 to 2.0 hours after its ingestion (Kar et al., 1999;
control and confirmed the non-reproducible Verspohl, 2002; Adebajo et al., 2007, 2013a,b; Ayoola
stimulatory growth effect of Curry on Tithonia (Figs. 1, et al., 2017). This phenomenon has also been given
2). This may be due to an inhibitory allelopathic as an indication of healthy state of the rats’
relationship between Tithonia and Curry plants pancreases (Adebajo et al., 2013a,b; Ayoola et al.,
occasioned by other allelochemicals that were 2017, 2019). Therefore, comparison of the glucose
produced when Tithonia was co-planted with Curry. levels at each time Tt (T0.5-T4.0) of the hyperglycaemic
Hence, the stimulatory and inhibitory allelopathic test groups (rats given leaf, stem and root extracts,
effects of Curry on Tithonia reported in this study were and glibenclamide) with those of the NC, should
due to allelochemicals inherent in grown Curry shrubs indicate their blood glucose lowering activities
and trees or produced insitu and released as root (Adebajo et al., 2013a,b; Ayoola et al., 2017).
exudates when grown together, respectively. This was
the first report of allelopathic relationship between
Tithonia and Curry plants. Also, this report was an
10Agric. Biol. J. N. Am., 2020, 11(1):5-23
At T0.5 (0.5 h), Pc elicited glucose level that was mg/kg) and 200 mg/kg of TNC and TPM elicited anti-
comparable to that of the NC rats, while those of the hyperglycaemic activity that was comparable to the 30
leaf extracts (100-400 mg/kg) of T. diversifolia TNC, % given by glibenclamide. At T4.0 (4 h), the 51 % blood
TPM and TTM regimes were mostly significantly glucose reduction given by TTM (100 mg/kg) was
higher, indicating that these extracts demonstrated comparable to the 45 % elicited by Pc. The order of
hyperglycaemic activity (Table 1). At T1.0 (1.0 h), only anti-hyperglycaemic activity at the fourth hour was
100 mg/kg of TNC and TTM demonstrated anti- therefore TTM (100 mg/kg) = Pc (5 mg/kg) > TNC (100
hyperglycaemic activities that were comparable to and mg/kg) = TPM (100, 200 mg/kg) > TNC (200, 400
significantly higher than that of Pc, respectively, mg/kg) = 200 mg/kg of TTM (Table 1).
indicating that they possessed the glibenclamide
extra-pancreatic activity (Adebajo et al., 2013a,b;
Ayoola et al., 2017, 2019). At T2.0 (2 h), only TTM (100
Fig 3. Comparison of shoot heights of the different Murraya koenigii regimes.
6
5
* * *
*
Plant height (Cm)
4 *
3 MTT
2 MPT
1 MNC
0
1 2 3 4 5 6 7 8 9 10
Weeks
MTT: Murraya koenigii treated with Tithonia diversifolia aqueous extract; MPT: Murraya koenigii co-planted with
Tithonia diversifolia; MNC: Murraya koenigii planted alone (negative control); data were expressed as Mean ± SEM
and subjected to one way analysis of variance (ANOVA), followed by Dunnett range and Student Newman Keul's
post hoc tests for comparisons to determine the source of significant differences. *: Values at each time point were
significantly different (p < 0.05) from those of the negative control group. N= 5.
Fig 4. Dry weights of leaf, stem and root of the different Tithonia diversifolia regimes
14000
12000
10000 TTM
yield (g)
8000 TPM
6000
TNC
4000
2000
0
Leaves Stem Root
TTM: Tithonia diversifolia treated with Murraya koenigii aqueous extract; TPM: Tithonia diversifolia co-planted with
Murraya koenigii; TNC: Tithonia diversifolia planted alone (negative control).
11Agric. Biol. J. N. Am., 2020, 11(1):5-23
Fig. 5. Pictures of the allelopathic effects of Murraya koenigii on Tithonia diversifolia regimes after 20 weeks of
treatment.
TNC TTM TPM
TNC: Tithonia diversifolia planted alone (negative control); TTM: Tithonia diversifolia treated with aqueous extract of Murraya
koenigii; TPM: Tithonia diversifolia co-planted with Murraya koenigii.
Fig 6. Dry weights of leaf, stem and root of the different Murraya koenigii regimes
120
100
MTT
Yield (grams)
80
MPT
60
40 MC
20
0
Leaves Stem Root
MTT: Murraya koenigii treated with Tithonia diversifolia aqueous extract; MPT: Murraya koenigii co-planted with Tithonia
diversifolia; MC: Murraya koenigii planted alone (MNC, negative control).
12Agric. Biol. J. N. Am., 2020, 11(1):5-23
Fig. 7. Pictures of the allelopathic effects of Tithonia diversifolia on Murraya koenigii regimes after 20 weeks of
treatment.
MNC MTT MPT
MNC: Murraya koenigii planted alone (negative control); MTT: Murraya koenigii treated with aqueous extract of
Tithonia diversifolia; MPT: Murraya koenigii co-planted with Tithonia diversifolia.
Fig. 8. Anti-hyperglycaemic activity of leaf extracts of T. diversifolia regimes at 100 mg/kg in glucose-loaded rats.
*
150
†
% Blood glucose
† † NC
100 * † † **
* TNC
* * †† TPM
*
50 ** TTM
Pc
0
0 0.5 1 2 4
Hour
Values are given as mean ± SEM for each group of five rats. NC: Rats given Tween 80 as solvent of dissolution (negative
control); TNC: leaf extract from T. diversifolia planted alone; TPM: leaf extract from T. diversifolia co-planted with M. koenigii;
TTM: leaf extract from T. diversifolia treated with aqueous extract of M. koenigii; Pc (PC): Glibenclamide (GLI, 5 mg/kg, positive
control); N = 5. †: p < 0.05 change in blood glucose vs Glibenclamide; *: p < 0.05 decrease in blood glucose vs Tween 80 (NC).
13Agric. Biol. J. N. Am., 2020, 11(1):5-23
by inference, allelochemicals, was able to improve the
At higher dose (400 mg/kg), extracts of all the regimes
anti-hyperglycaemic activity of Tithonia, a
were mostly devoid of anti-hyperglycaemic activity.
pharmacological activity of interest, probably by
The activity of 100 and 200 mg/kg of TNC was
modulating the enzymatic activity that controlled the
generally comparable and same was observed for
biosynthesis of the active secondary metabolites
these doses of TPM (Table 1). The greatest difference
(Dadkhah, 2012; Gupta and Mittal, 2012). Hence,
in the anti-hyperglycaemic activity among the three
allelopathy is hereby suggested as a factor in
regimes was at 100 mg/kg, the least tested dose (Fig.
improving the desired hyperglycaemia-lowering
8). Here, TNC and TPM activity was comparable at 2
activity of T. diversifolia.
and 4 hours, while at 1.0 hour, anti-hyperglycaemic
activity of TNC was significantly higher than that of The TLC (n-hexane:CHCl3 1:1) of leaf extracts of TNC,
TPM. Also, at 2 and 4 hours, anti-hyperglycaemic TPM and TTM regimes showed that they had 2 spots
activity of TTM was comparable to that of Pc and (Rf 0.00, 0.03) common to them all, while both TPM
significantly higher than those of TPM and TNC. Order and TTM regimes were similar and had additional 6
of anti-hyperglycaemic activity at 1.0 hour was TTM = spots. This suggested that the difference in anti-
TNC > Pc = TPM. Hence, the TTM regime (100 mg/kg) hyperglycaemic activity of TPM and TTM may be due
was the most active anti-hyperglycaemic extract, and to quantitative differences in their constituents, while
because it had a similar profile of activity as that between TNC and TTM may be qualitative in
glibenclamide (Fig. 8), it should probably have the mild nature. The physicochemical technique of TLC did not
extra-pancreatic and major insulin stimulating activity show any detectable difference in the constituents of
of glibenclamide (Adebajo et al., 2013a,b; Ayoola et TPM and TTM regimes. However, their varied anti-
al., 2017). A 80 % T. diversifolia ethanolic leaf extract hyperglycaemic activity may support the use of this
(500 and 1500 mg/kg, p.o.) gives significant (p < 0.05) bioassay as a method that is more sensitive in
reduction of blood glucose in KK-Ay mice 7 hours after detecting allelopathy or establishing allelopathic
administration. Also, three weeks after, this extract relationships between plants than the chemical ones,
gives a significant decrease in blood glucose in mice, such as TLC (Chandra and Mali, 2012). As a crude
using an insulin tolerance test (Miura et al., 2002, analytical technique, the TLC might have failed here.
2005). However, the use of much better analytical
techniques, such as High Pressure Liquid
Furthermore, the enhanced anti-hyperglycaemic
Chromatography (HPLC) and the hyphenated
activity of TTM over those of TPM and TNC (Table 1,
techniques of HPLC-Mass Spectrometry (HPLC-MS),
Fig. 8) could only be ascribed to influence of
etc, with greater power of resolution and accuracy in
allelopathic relationship between Tithonia and Curry
identification of the plant components, may show the
plants. Therefore, improved anti-hyperglycaemic
difference between TTM and TPM (Adebajo, 1997).
activity of TTM (Table 1, Fig. 8) corroborated
stimulatory allelopathic effects of Curry leaf tree on Antihyperglycaemic activity of the stem regimes of
growth parameters (Figs 1, 2), dried weight yields (Fig. T. diversifolia: At 0.5 h, the extracts (100-400 mg/kg)
4) and physical growth of the Tithonia regimes (Fig. 5) of all Tithonia stem regimes and glibenclamide (5
and showed that TTM demonstrated the highest mg/kg) were either significantly hyperglycaemic or
allelopathic activity of Curry on Tithonia. These results lacked anti-hyperglycaemic activity. Moderate 23 %
further suggested that allelochemicals present in the blood glucose reduction by TPM (400 mg/kg), which
Curry aqueous extract must have stimulated in was comparable to that given by Pc, was the only
Tithonia TTM regime, the biosynthesis of greater significant anti-hyperglycaemic activity at 1.0 hour.
quantities of the anti-hyperglycaemic constituents Also, at all hours, TTM (200, 400 mg/kg) and TNC
found in TNC (quantitative difference) or other (100, 400 mg/kg) were either hyperglycaemic or
constituents with greater activity (qualitative inactive. However, TNC (200 mg/kg), TTM (100
difference). They further confirmed characteristics of mg/kg) and TPM (100-400 mg/kg) showed only
the allelochemicals present in Curry leaf tree, as moderate anti-hyperglycaemic activity at 4 hour (Table
enumerated above (Kruse et al., 2000; Taiwo and 2) that may be through insulin stimulation (Adebajo et
Makinde, 2005; Iman et al., 2006; Olabode et al., al., 2013a,b; Ayoola et al., 2017).
2007; Asaduzzaman et al., 2010; Oke et al., 2011;
Chandra and Mali, 2012; Gupta and Mittal, 2012;
Morikawa et al., 2012; Otusanya and Ilori, 2012).
Moreover, the results established that allelopathy, and
14Agric. Biol. J. N. Am., 2020, 11(1):5-23
Table 1. Effects of leaf methanolic extracts of the different treatment regimes of Tithonia diversifolia in glucose-
induced hyperglycaemic rats
Extract/Drug Blood glucose level as percentage of To (reduction in blood glucose relative to negative control at Tt)
Doses (mg/kg) 0h 0.5 h 1h 2h 4h
a,b c,d,e d,e
NC 100± 0.0 77.5±4.6 85.2±5.1 84.9±5.9 76.4±2.2d
a,b,c,d a,b b,c,d
TNC (100) 100± 0.0 85.4±4.1 69.7±3.8 73.3± 2.9 57.1± 1.7b
(-10.2%) (18.2 %) (13.7 %) (25.3%)
TNC (200) 100± 0.0 86.7±3.5b,c,d,e 77.2± 2.5b,c 65.5± 4.6a,b 65.1± 3.0b,c
(-11.9%) (9.4%) (22.9%) (14.7%)
TNC (400) 100± 0.0 90.6± 1.2c,d,e 87.4±2.4d,e 79.5± 2.9c,d,e 64.4± 0.9b,c
(-16.9%) (-2.6) (6.4%) (15.7%)
TPM (100) 100 ± 0.0 102.0±11.0c,d,e 84.4±5.2c,d 78.3±8.2b,c,d,e 59.1±4.1b,c
(-31.6%) (0.9%) (7.8%) (22.6%)
TPM (200) 100± 0.0 105.3±9.5e 77.8±8.7a,b,c,d 64.4 ±6.5a,b,c 60.0±5.0b,c
(-35.9%) (8.7%) (24.1%) (21.5%)
TPM (400) 100± 0.0 97.2±5.4d,e 101.0±6.4e 88.7±4.2e 73.8±7.1c,d
(-25.2%) (-18.5%) (-4.5%) (3.4%)
TTM (100) 100± 0.0 84.4±3.2a,b,c,d 60.1±5.3a 56.1±4.2a 37.2±1.5a
(-8.9%) (29.5%) (34.0%) (51.3%)
TTM (200) 100± 0.0 79.8±6.7a,b,c 84.2±4.6c 71.2±2.6b,c 63.7±2.2b,c
(-3.0%) (1.2%) (16.1%) (16.8%)
TTM (400) 100± 0.0 71.7±4.7a 82.1±2.3c,d 79.7±4.0c,d,e 72.2±6.6c,d
(7.5%) (3.6%) (6.1%) (5.5%)
PC (Pc, GLI, 5) 100± 0.0 76.6±6.1a,b 77.1±4.4b,c,d 59.5±3.5a 42.0±1.9a
(1.2%) (9.5%) (29.9%) (45.0%)
KEY: Data show the mean ± SEM blood glucose levels at the different time points expressed as percentages of levels at 0 h (T0), n = 5. NC
(Normal saline): Diabetic negative control group given 1 % Tween 80 in normal saline; TNC: methanolic extract of T. diversifolia growing alone;
TTM: methanolic extract of T. diversifolia treated with aqueous extract of M. koenigii; TPM: methanolic extract of T. diversifolia co-planted with
M. koenigii; PC (Pc, GLI): Glibenclamide (5 mg/kg). Values with different superscripts within columns are significantly different (p < 0.05, one-
way analysis of variance followed by the Student–Newman–Keuls’ test).
Table 2. Effects of stem methanolic extracts of the different treatment regimes of Tithonia diversifolia in glucose-
induced hyperglycaemic rats
Extract/Drug Blood glucose level as percentage of To (reduction in blood glucose relative to negative control at Tt)
Doses (mg/kg) 0h 0.5 h 1h 2h 4h
a c c,d
NC 100±0.0 77.5±4.6 85.2±5.1 84.9±5.9 76.4±2.2d
TNC (100) 100±0.0 103.4±9.4c,d 101.2±5.4d 85.5±5.2c,d 67.2±5.1c,d
(-33.4%) (-18.8%) (-0.7%) (12.0%)
TNC (200) 100±0.0 99.9±6.5c,d 101.0±6.2d 88.9±5.3c,d 62.0±5.8b,c
(-28.9%) (-18.5%) (4.7%) (18.8%)
d d d
TNC (400) 100±0.0 117.0±11.5 111.0±7.0 95.4±7.5 84.4±4.8e
(-51.0%) (-30.3%) (-12.4%) (-10.5%)
b b,c b
TPM (100) 100±0.0 85.2±2.4 78.9±2.5 70.2±3.0 59.1±5.0b,c
(-9.9%) (7.4%) (17.3%) (22.6%)
TPM (200) 100±0.0 81.8±4.2a,b 76.3±4.8b,c 70.1±3.9b 63.3±4.3b,c
(-5.5%) (10.5%) (17.4%) (17.2%)
a a,b a
TPM (400) 100±0.0 76.2±5.8 65.4±6.1 58.2±6.0 54.1±5.3b
(1.7%) (23.2%) (31.5%) (29.2%)
15Agric. Biol. J. N. Am., 2020, 11(1):5-23
Extract/Drug Blood glucose level as percentage of To (reduction in blood glucose relative to negative control at Tt)
Doses (mg/kg) 0h 0.5 h 1h 2h 4h
d d c,d
TTM (100) 100±0.0 107.3±6.6 104.1±9.1 84.3±9.6 57.2±6.6b,c
(-38.5%) (-22.2%) (0.7%) (25.1%)
c b,c b,c
TTM (200) 100±0.0 92.0±2.7 79.0±3.1 77.2±3.5 72.3±2.3d
(-18.7%) (7.3%) (9.1%) (5.4%)
TTM (400) 100±0.0 89.4±2.9b,c 80.8±2.9c 75.1±3.5b,c 76.4±3.8d,e
(-15.4%) (5.2%) (11.5%) (0%)
a a,b,c a
PC (Pc, GLI, 5) 100±0.0 76.6±6.1 77.1±4.4 59.5±3.5 42.0±1.9a
(1.2%) (9.5%) (29.9%) (45.0%)
KEY: Data show the mean ± SEM blood glucose levels at the different time points expressed as percentages of levels at 0 h (T0), n = 5. NC
(Normal saline): Diabetic negative control group given 1 % Tween 80 in normal saline; TNC: methanolic extract of T. diversifolia growing alone;
TTM: methanolic extract of T. diversifolia treated with aqueous extract of M. koenigii; TPM: methanolic extract of T. diversifolia co-planted with
M. koenigii; PC (Pc, GLI): Glibenclamide (5 mg/kg). Values with different superscripts within columns are significantly different (p < 0.05, one-
way analysis of variance followed by the Student–Newman–Keuls’ test).
Table 3. Effects of root methanolic extracts of the different treatment regimes of Tithonia diversifolia in glucose-
induced hyperglycaemic rats
Extract/Drug Blood glucose level as percentage of To (reduction in blood glucose relative to negative control at Tt)
Doses (mg/kg) 0h 0.5 h 1h 2h 4h
b,c d,e d
NC 100±0.0 77.5±4.6 85.2±5.1 84.9±5.9 76.4±2.2d,e
TNC (100) 100±0.0 99.9±4.2d,e 96.8±8.5e 88.1±10.0c,d 88.6±6.5e,f
(-28.9%) (-13.6 %) (-3.8 %) (-16.0%)
a,b,c c,d,e c,d
TNC (200) 100±0.0 78.6±9.0 86.2±8.8 83.1±8.8 82.1±9.8e,f
(-1.4%) (-1.2) (2.1%) (-7.5%)
d,e d,e c,d
TNC (400) 100±0.0 102.2±7.7 90.2±9.7 83.0±10.7 67.6±10.7b,c,d
(-31.9%) (-5.9%) (2.2%) (11.5%)
e e d
TPM (100) 100±0.0 106.0±0.8 98.0±5.2 84.1±5.4 71.2±2.7d
(-36.8%) (-15.0%) (0.9%) (6.8%)
b,c b,c,d c,d
TPM (200) 100±0.0 82.7±6.0 76.8±8.3 79.0±7.2 75.2±4.9d,e
(-6.7%) (9.9%) (6.9%) (1.6%)
d e c,d
TPM (400) 100±0.0 93.6±3.2 93.2±4.5 77.8±4.2 69.0±3.7c,d
(-20.8%) (-9.4%) (8.4%) (9.7%)
a a a
TTM (100) 100±0.0 63.2±3.9 56.5±5.1 47.5±4.4 38.7±3.6a
(18.5%) (33.7%) (44.1%) (49.3%)
TTM (200) 100±0.0 84.5±4.9b 68.2±4.3a,b,c 65.0±6.7b,c 57.3±6.5b,c
(-9.0%) (20.0%) (23.4%) (25%)
a,b,c a a,b
TTM (400) 100±0.0 77.9±8.1 58.9±3.1 58.6±4.2 52.6±4.6b
(0.5%) (30.9%) (31.1%) (31.2%)
a,b b,c,d a,b
PC (Pc, GLI, 5) 100±0.0 76.6±6.1 77.1±4.4 59.5±3.5 42.0±1.9a
(1.2%) (9.5%) (29.9%) (45.0%)
KEY: Data show the mean ± SEM blood glucose levels at the different time points expressed as percentages of levels at 0 h (T0), n = 5. NC
(Normal saline): Diabetic negative control group given 1 % Tween 80 in normal saline; TNC: methanolic extract of T. diversifolia growing alone;
TTM: methanolic extract of T. diversifolia treated with aqueous extract of M. koenigii; TPM: methanolic extract of T. diversifolia co-planted with
M. koenigii; PC (Pc, GLI): Glibenclamide (5 mg/kg). Values with different superscripts within columns are significantly different (p < 0.05, one-
way analysis of variance followed by the Student–Newman–Keuls’ test).
16Agric. Biol. J. N. Am., 2020, 11(1):5-23
probably induced biogenesis of constituents with
At 2.0 hour, order of anti-hyperglycaemic activity
greater anti-hyperglycaemic activity in Tithonia leaf,
demonstrated by the doses of the regimes was Pc =
which were selectively stored in Tithonia roots.
TPM (400 mg/kg) > TPM (100, 200 mg/kg) = TTM
(200, 400 mg/kg) while at 4.0 hour, it was Pc > TPM Moreover, the results suggested that mechanisms of
(400 mg/kg) = TTM, TPM (100 mg/kg) = TNC, TPM action of these anti-hyperglycaemic constituents may
(200 mg/kg) (Table 2). be by both extrapancreatic and insulin stimulation
(Ayoola et al., 2017), and this agreed with an earlier
Therefore, the general lack of glucose reducing ability
report of an antidiabetic activity of T. diversifolia that is
of the Tithonia stem (TNC) extract (Table 2, Fig. 9)
due to the stimulation of insulin release from the β-
suggested that addition of the stem to a leaf herbal
cells in the islets of Langerhans (Olukunle et al., 2014).
preparation would not contribute significantly to its
At all hours, the anti-hyperglycaemic activities of 100
ethnomedicinal use in managing diabetes (Miura et al.,
mg/kg of leaf and root extracts of TTM regime (Tables
2002, 2005). Since 400 mg/kg of the TPM extract had
1, 3) were comparable and significantly the highest.
the highest anti-hyperglycaemic activity at all hours
However, this activity of the root extract was
(Table 2), comparison of the anti-hyperglycaemic
significantly higher than that of the leaf at 400 mg/kg
activity of all the regimes at this dose (Fig. 9) clearly
(Figs. 8, 10). Theoretically therefore, anti-
showed the stimulatory allelopathic effect of Curry on
hyperglycaemic activity of TTM root regime was higher
this activity of Tithonia stem. Hence, the
than that of the leaf. Nevertheless, for agro-economic
allelochemicals synthesised insitu in the Curry leaf
considerations, the TTM leaf regime should be
plant when co-planted with Tithonia and released by
preferred in anti-hyperglycaemic drug development of
exudation through its roots probably stimulated in
Tithonia, as utilisation of the root may lead to
Tithonia TPM regime, the synthesis of anti-
destruction of the plant.
hyperglycaemic constituents that were either
quantitatively or qualitatively different from those of the Hyperglycaemia lowering activity of the leaf
TNC and TTM regimes. This was another evidence regimes of M. koenigii: At 0.5 – 2.0 hours, the leaf
supporting the use of allelopathy in selecting plant extract (100 – 400 mg/kg) of M. koenigii negative
strains with better anti-hyperglycaemic activity. control plant regime (MNC) was either inactive or
showed significant hyperglycaemic activity. Also, at
Anti-hyperglycaemic activity of the root regimes of
4.0 hour, they gave a moderate and comparable anti-
T. diversifolia: All doses of the TNC and TPM root
hyperglycaemic activity that was significantly lower
extracts had hyperglycaemic activity at 0.5 and 1.0
than that of glibenclamide (Table 4). This indicated
hours and lacked anti-hyperglycaemic activity at 2 and
that M. koenigii leaf extract was slow in demonstrating
4 hours (Table 3). The lack of anti-hyperglycaemic
its activity, a position that agrees with an earlier report
activity of TNC stem and root regimes (Tables 2, 3;
of its slow-acting property (Adebajo et al., 2004, 2006).
Figs. 9, 10) strongly indicated that the folkloric use of
the whole herb of Tithonia as antidiabetic (Miura et al., On the other hand, 400 mg/kg of the Tithonia treated
2002, 2005) may be in-appropriate. Therefore, it may Curry regime (MTT) was inactive at all hours while its
be necessary to correct the traditional practitioners to 200 mg/kg showed only moderate 18 and 17 % anti-
limit the antidiabetic usage of Tithonia to just the hyperglycaemic activity at the first and fourth hours,
leaves that demonstrated moderate anti- respectively. However, its 100 mg/kg gave glucose
hyperglycaemic activity (Table 1, Fig. 8). Only doses levels at 0.5, 1.0 and 4.0 hours that were significantly
of TTM gave significant blood glucose reductions and lower than those given by glibenclamide, while its 30
their order of anti-hyperglycaemic activity at 0.5, 1.0, % anti-hyperglycaemic activity at 2.0 hour was
2.0 and 4.0 hours was Pc = TTM 100 mg/kg = 400 comparable with that of the standard drug (Table 4,
mg/kg > 200 mg/kg, TTM 100 mg/kg = 400 mg/kg > Pc Fig. 11). Antihyperglycaemic activity demonstrated by
= 200 mg/kg, TTM 100 mg/kg > Pc = 400 mg/kg > 200 100 mg/kg of the MTT Curry leaf extract was
mg/kg, and TTM 100 mg/kg = Pc > 400 mg/kg = 200 significantly the best and its comparison with that of
mg/kg, respectively. Hence, 100 mg/kg of TTM roots MNC at this dose (Fig. 11), clearly showed the effects
had the highest antihyperglycaemic (Table 3). of Tithonia allelochemicals in stimulating the
Similarly, the lowest dose (100 mg/kg) of M. koenigii elaboration of secondary metabolites with higher anti-
gives the highest anti-hyperglycaemic activity hyperglycaemic activity in the Curry plant.
(Adebajo et al., 2006). Comparison of all the Tithonia
regimes at this dose (Fig. 10) clearly showed that
allelochemicals present in grown Curry leaf tree
17Agric. Biol. J. N. Am., 2020, 11(1):5-23
Fig. 9. Antihyperglycaemic activity of stem extracts of T. diversifolia regimes at 400 mg/kg in glucose-
loaded rats.
150 *
†
% Blood glucose
†
† NC
100 † †
† † † TNC
* * *
50 * TPM
TTM
0 PC
0 0.5 1 2 4
Hour
Values are given as mean ± SEM for each group of five rats. NC: Rats given Tween 80 as solvent of dissolution
(negative control); TNC: stem extract from T. diversifolia planted alone; TPM: stem extract from T. diversifolia co-
planted with M. koenigii; TTM: stem extract from T. diversifolia treated with aqueous extract of M. koenigii; PC (Pc):
Glibenclamide (5 mg/kg, positive control), N = 5. †: p < 0.05 change in blood glucose vs Glibenclamide; *: p < 0.05
decrease in blood glucose vs Tween 80.
Fig. 10. Antihyperglycaemic activity of root extracts of T. diversifolia regimes at 100 mg/kg in glucose-loaded rats.
150 **
†† ††
% Blood glucose
† †
† † NC
100 * †
* * †
† TNC
* **
50 TPM
TTM
0
PC
0 0.5 1 2 4
Hour
Values are given as mean ± SEM for each group of five rats. NC: Rats given Tween 80 as solvent of dissolution (negative control);
TNC: root extract from T. diversifolia planted alone; TPM: root extract from T. diversifolia co-planted with M. koenigii; TTM: root
extract from T. diversifolia treated with aqueous extract of M. koenigii; PC (Pc): Glibenclamide (5 mg/kg, positive control). †: p < 0.05
change in blood glucose vs Glibenclamide; *: p < 0.05 decrease in blood glucose vs Tween 80.
18Agric. Biol. J. N. Am., 2020, 11(1):5-23
mg/kg of the Murraya MNC root extract at 4 hour was
Since the stimulatory allelopathic effect of T.
diversifolia on M. koenigii was much more obvious in comparable to that of glibenclamide (Table 5). Daily
the anti-hyperglycaemic assay (Fig. 11) than the administration of metformin (50 mg/kg), and 400
growth parameters (Fig. 3), this confirmed the report mg/kg of aqueous and alcoholic extracts of M. koenigii
that bioassays are more sensitive than chemical root for 21 days gives 59, 58 and 55 % percentage
methods in establishing allelopathic relationships change in fasting blood glucose of alloxan-induced
(Chandra and Mali, 2012). Also, 24, 39, 30 and 59 % diabetic rats (Singh et al., 2012). Moreover, the 100
anti-hyperglycaemic activity at 0.5 - 4.0 hours given by
mg/kg of the untreated (MNC) leaf extract
100 mg/kg of MTT, which was significantly higher than
that of glibenclamide (Table 4, Fig.11), showed that demonstrated a significantly higher
the profile of activity of this allelopathic moderated antihyperglycaemic activity than that of its root extract
Curry leaf was probably different from that at the fourth hour, but at 200 and 400 mg/kg, the
glibenclamide.Action of glibenclamide is through activity of its root extract was significantly higher at all
extrapancreatic and pancreatic activities (Adebajo et hours (Tables 4, 5). This indicated that M. koenigii root
al., 2004, 2006, 2013a,b; Ayoola et al., 2017). It would presented in this study (Table 5, Fig. 12) would make
therefore be interesting to establish the structural
identities of these newly biosynthesized anti- a better anti-hyperglycaemic herbal drug, and agrees
hyperglycaemic constituents of the TTM Curry leaf with the suggestion that aqueous extract of this Curry
extract and determine their mechanism(s) of action, root should be prescribed as adjunct to dietary therapy
using other standard drugs that operate via different and drug treatment for controlling diabetes mellitus
mechanisms of action from that of glibenclamide. (Singh et al., 2012). However, since exploitation of the
Hyperglycaemia lowering activity of the root root as an anti-hyperglycaemic drug would lead to the
regimes of M. koenigii: The three Murraya stem
destruction of the plant, daily watering of the Curry
regimes (MNC, MTT, MPT) were not tested using
OGTT, because their yields were too low. At 100 plants with aqueous extracts of freshly collected
mg/kg, the MNC and MTT Murraya root extracts were Tithonia leaves would stimulate in the Curry leaves the
devoid of hyperglycaemia-lowering activity at all biogenesis of constituents with significantly higher
hours. However, at 200 mg/kg, both MTT and MNC anti-hyperglycaemic activity than those found in the
extracts lacked anti-hyperglycaemic activity at 0.5 harvested Curry roots (Tables 4, 5). This clearly
hour while the activity of MNC was significantly higher confirmed a possible role of allelopathy in drug
than those of MTT and NC extracts at 1 – 4 hours
development of Tithonia and Curry leaf tree.
(Table 5, Fig. 12). On the other hand, at 400 mg/kg,
the activity of MTT and MNC root extracts was CONCLUSION
comparable with each other and with glibenclamide at Positive allelopathic relationship between Tithonia and
1 - 4 hours, while at 0.5 hour, only MNC extract was Curry stimulated increased growth parameters of T.
significantly active. Hence, the order of anti- diversifolia, as well as produced T. diversifolia leaf,
hyperglycaemic activity of MTT and MNC extracts at stem and root with significantly higher anti-
0.5, 1.0, 2.0 and 4.0 hours was MNC (400 mg/kg), hyperglycaemic activities. Allelopathic influence of T.
MNC (200, 400 mg/kg) = MTT (400 mg/kg), MNC (200 diversifolia on Curry leaf tree similarly resulted in a
mg/kg) = MTT (400 mg/kg) = Pc > MNC (400 mg/kg), significantly enhanced anti-hyperglycaemic activity of
and MNC (200, 400 mg/kg) = Pc = MTT (400 mg/kg) M. koenigii leaf, while that on Curry root was inhibitory.
> MTT (200 mg/kg), respectively (Table 5). Therefore, These allelopathic effects were more in Tithonia or
this indicated similarity in the anti-hyperglycaemic Curry that was watered with aqueous extract of Curry
activity of MTT and MNC extracts, although that of or Tithonia, respectively than in those co-planted.
MNC was slightly more active (Fig. 12). Thus these Therefore, allelochemicals that were synthesised in
results (Table 5, Fig. 12) represented slight inhibitory Curry leaf tree growing on the field were water soluble,
allelopathic effects of Tithonia on the anti- more concentrated in M. koenigii fresh shoots (leaves
hyperglycaemic activity of Curry leaf, similar to the and stems) and readily absorbed through the Tithonia
inhibitory allelopathic influence of T. diversifolia on roots probably modulated enzymatic activity in
yields of the leaves, stems and roots regimes of M. Tithonia leaf and root to stimulate the biogenesis of
koenigii (Fig. 6) and the obviously better growth of anti-hyperglycaemic constituents with higher blood
MNC than those of MTT and MPT (Fig. 7). Also, the glucose lowering activity. These Tithonia and Curry
aqueous extract of T. diversifolia gives significant constituents that are produced as a result of
inhibitory effects on the dried weight of A. cruentus allelopathy were either qualitatively or quantitatively
shoots (Otusanya et al., 2007). different from those in the normal growing Tithonia and
The comparable (p > 0.05) antihyperglycaemic activity Curry.
of 57 and 45 % given respectively by 200 and 400
19Agric. Biol. J. N. Am., 2020, 11(1):5-23
Table 4. Anti-hyperglycaemic effects of leaf methanolic extracts of two treatment regimes of Murraya
koenigii in rats
Extract/Drug Blood glucose level as percentage of To (reduction in blood glucose relative to negative control at Tt)
Doses (mg/kg) 0h 0.5 h 1h 2h 4h
b,c c,d c,d
NC) 100±0.0 77.5±4.6 85.2±5.1 84.9±5.9 76.4±2.2e
MNC (100) 100±0.0 70.7±1.5b 77.0±3.2b,c 71.0±3.3b,c 55.6±3.7c
(8.8%) (9.6 %) (16.4 %) (27.4%)
d d c
MNC (200) 100±0.0 100.5±3.7 94.4±2.6 80.5±2.2 62.0±2.2c,d
(-29.7%) (-10.7%) (5.2%) (18.8%)
e c,d b,c
MNC (400) 100±0.0 120.8±10.6 100.4±11.3 71.8±6.1 54.5±3.9c
(-55.9%) (-17.8%) (15.4%) (28.7%)
MTT (100) 100±0.0 58.9±2.9a 52.0±7.0a 59.3±6.9a,b 31.0±2.9a
(24.0%) (39.0%) (30.2%) (59.4%)
c b c
MTT (200) 100±0.0 82.5±2.9 69.6±4.5 73.0±3.7 63.8±3.6c,d
(-6.5%) (18.3%) (14.0%) (16.5%)
c b,c b,c
MTT (400) 100±0.0 82.1±4.4 76.8±5.1 73.2±6.1 70.3±6.4d,e
(-5.9%) (9.9%) (13.8%) (8.0%)
PC (Pc, GLI, 5) 100±0.0 76.6±6.1b,c 77.1±4.4b,c 59.5±3.5a,b 42.0±1.9b
(1.2%) (9.5%) (29.9%) (45.0%)
KEY: Data show the mean ± SEM blood glucose levels at the different time points expressed as percentages of levels at 0 h (T0), n = 5. NC
(Normal saline): Diabetic negative control group given 1 % Tween 80 in normal saline; MNC: methanolic extract of M. koenigii growing alone;
MTT: methanolic extract of M. koenigii treated with aqueous extract of T. diversifolia; PC (Pc, GLI): Glibenclamide (5 mg/kg). Values with
different superscripts within columns are significantly different (p < 0.05, one-way analysis of variance followed by the Student–Newman–
Keuls’ test).
Table 5. Anti-hyperglycaemic effects of root methanolic extracts of two treatment regimes of Murraya koenigii in rats
Extract/Drug Blood glucose level as percentage of To (reduction in blood glucose relative to negative control at Tt)
Doses (mg/kg) 0h 0.5 h 1h 2h 4h
b,c d c
NC 100±0.0 77.5±4.6 85.2±5.1 84.9±5.9 76.4±2.2d
MNC (100) 100±0.0 82.9±3.4c 81.1±6.5c,d 74.3±5.2c 71.8±2.7c,d
(-7.0%) (4.8%) (12.5%) (6.0%)
b b a
MNC (200) 100±0.0 72.9±1.8 66.6±2.9 54.8±5.0 32.8±5.9a
(5.9%) (21.8%) (35.5%) (57.1%)
a a,b b
MNC (400) 100±0.0 57.5±8.8 57.8±4.7 62.5±2.5 41.7±4.2a,b
(25.8%) (32.2%) (26.4%) (45.4%)
MTT (100) 100±0.0 89.4±7.4c 87.0±6.6d 75.0±4.5c 65.8±5.1c,d
(-15.4%) (2.1%) (11.7%) (13.9%)
b,c d c
MTT (200) 100±0.0 81.4±6.7 85.6±5.4 72.4±5.4 50.0±6.6b,c
(-5.0%) (-0.5%) (14.7%) (34.6%)
b,c a,b,c a,b
MTT (400) 100±0.0 74.6±4.0 65.7±7.2 57.6±7.8 47.2±8.9a,b
(3.7%) (22.9%) (32.2%) (38.2%)
b,c c,d a,b
PC (Pc, GLI, 5) 100±0.0 76.6±6.1 77.1±4.4 59.5±3.5 42.0±1.9a
(1.2%) (9.5%) (29.9%) (45.0%)
KEY: Data show the mean ± SEM blood glucose levels at the different time points expressed as percentages of levels at 0 h (T0), n = 5. NC
(Normal saline): Diabetic negative control group given 1 % Tween 80 in normal saline; MNC: methanolic extract of M. koenigii growing alone;
MTT: methanolic extract of M. koenigii treated with aqueous extract of T. diversifolia; PC (Pc, GLI): Glibenclamide (5 mg/kg). Values with
different superscripts within columns are significantly different (p < 0.05, one-way analysis of variance followed by the Student–Newman–
Keuls’ test).
20You can also read