Understanding physical drivers of the 2015/16 marine heatwaves in the Northwest Atlantic - Nature
←
→
Page content transcription
If your browser does not render page correctly, please read the page content below
www.nature.com/scientificreports
OPEN Understanding physical drivers
of the 2015/16 marine heatwaves
in the Northwest Atlantic
E. Perez1*, S. Ryan1, M. Andres1, G. Gawarkiewicz1, C. C. Ummenhofer1, J. Bane2 &
S. Haines2
The Northwest Atlantic, which has exhibited evidence of accelerated warming compared to the global
ocean, also experienced several notable marine heatwaves (MHWs) over the last decade. We analyze
spatiotemporal patterns of surface and subsurface temperature structure across the Northwest
Atlantic continental shelf and slope to assess the influences of atmospheric and oceanic processes on
ocean temperatures. Here we focus on MHWs from 2015/16 and examine their physical drivers using
observational and reanalysis products. We find that a combination of jet stream latitudinal position
and ocean advection, mainly due to warm core rings shed by the Gulf Stream, plays a role in MHW
development. While both atmospheric and oceanic drivers can lead to MHWs they have different
temperature signatures with each affecting the vertical structure differently and horizontal spatial
patterns of a MHW. Northwest Atlantic MHWs have significant socio-economic impacts and affect
commercially important species such as squid and lobster.
Marine heatwaves (MHWs), defined as discrete events of anomalously warm ocean temperatures, can disrupt
marine ecosystems and hence human industries like fisheries, tourism, and aquaculture. MHWs can occur
throughout the global ocean and across seasons. Under anthropogenic climate change, more intense and frequent
MHWs are e xpected1,2. The Northwest Atlantic (NWA, see Fig. 1), where waters are warming four times faster
than the global average, has experienced notable MHWs in the last d ecade3–6. This region is home to a highly
productive ecosystem with significant economic importance, and includes the highest-valued seafood port in
the United States, located in New Bedford, M A7. Recent MHWs in 2012 and 2016 have been among the strong-
est on record in the NWA3,5,8. In the NWA, 2012 was not only one of the warmest years on record, but also one
of the most disruptive years to marine ecosystems and fisheries5. Given the economic implications and strong
background warming in the NWA region, it is particularly important to understand drivers of MHWs, especially
the relative role of oceanic versus atmospheric contributions.
Chen et al.4,8 showed that a MHW in 2012 in the NWA was widespread along the continental shelf, reach-
ing from Cape Hatteras to the Gulf of Maine. In 2012, the sea surface temperature (SST) from Cape Hatteras
to the Grand Banks was 2 °C higher than the 1982–2011 a verage5. This warming coincided with an unusually
northward-shifted atmospheric jet stream position that persisted from the end of 2011 into 2012 and confined
the polar air masses to its north. Warm southerly air remained over the northeast U.S. and neighboring conti-
nental shelves for much of the winter, which altered air-sea heat fluxes and reduced heat loss from the oceans,
and caused the 2012 M HW4,8.
Recent variability of the Gulf Stream has likely also contributed to warming of the continental shelf and slope
in this region6. Gulf Stream meanders form further to the west than in the 1990s, and are of larger amplitude9. A
regime shift in 2000 is associated with a substantial increase in the number of WCRs formed annually from Gulf
Stream meander c rests10. Large amplitude meanders and WCRs can bring warm salty water into close proximity
to the continental slope and shelf b reak11,12 and can affect both the Shelfbreak Jet as well as shelf t emperature13.
Gawarkiewicz et al.14 found that an ocean-driven MHW along the continental shelf of the Mid-Atlantic Bight
in 2017 was forced by the presence of a WCR, which resulted in cross-shelf transport of warm and salty Gulf
Stream water. Additionally, a northward shift of the Gulf Stream toward the Tail of Grand Banks, where it poten-
tially blocks the equatorward-flowing Labrador Current has been shown to increase salinity and temperature
of subsurface waters on the Northwest Atlantic Shelf, “downstream” (southwest) of this interaction location15,16.
Warmer, saltier waters southwest of the Tail of the Grand Banks may even reinforce atmospherically-initiated
1
Department of Physical Oceanography, Woods Hole Oceanographic Institution, Woods Hole, MA 02543,
USA. 2Department of Marine Sciences, University of North Carolina-Chapel Hill, Chapel Hill, NC 27599,
USA. *email: eperez@whoi.edu
Scientific Reports | (2021) 11:17623 | https://doi.org/10.1038/s41598-021-97012-0 1
Vol.:(0123456789)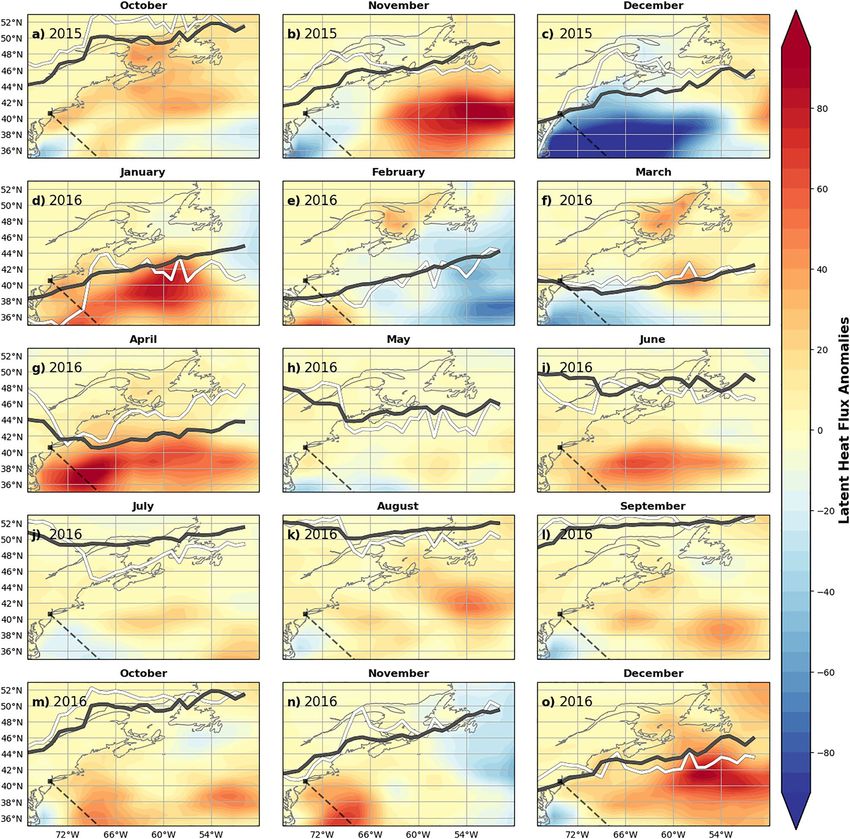
www.nature.com/scientificreports/
Figure 1. Map of the Northwest Atlantic. Positions of warm core rings (WCRs) on their date of absorption for
the 15-month period considered here are indicated with red dots. The dashed (black) line indicates the Oleander
line. The light blue line is the average path of the Gulf Stream (1993–2017). Shaded boxes are sub-regions used
for marine heatwave analysis. This map was generated using Python version 2.7.5.
MHWs, such as the one in 2012 in the N WA15. Thus, both the jet stream motions in the atmosphere and Gulf
Stream variability and rings in the ocean may serve as potential drivers for MHWs in the NWA.
In 2016, SST anomalies similar to those in 2012 were observed in the Gulf of Maine, which led to early lobster
landings and a high total number of landings also in 2 0165. While this had wide-reaching effects on the lobster
fishery supply5,17, the drivers of the anomalously warm shelf temperatures have not been well studied to date.
Additionally, MHW events can exacerbate negative impacts of the anthropogenic background warming that
many iconic Northeast Shelf species like Atlantic Sea Scallop, Atlantic Cod, and Atlantic Mackerel are projected
to experience1,18. Other economically important species, such as Inshore Longfin Squid and Butterfish, may
potentially benefit from climate change18, and how they respond to MHWs is not well known.
In this study, we examine the seasonal evolution and spatial patterns of SST as well as temperature at depth
along an expendable bathythermograph (XBT) repeat section to characterize MHWs detected in 2015/16. We
investigate driving processes with a qualitative assessment of the relative roles of atmospheric forcing (by com-
paring the temperature patterns with jet stream latitude) and oceanic advection (by examining Gulf Stream
position and meandering/ring formation).
The present study is organized as follows. Data and methods are described in “Data and methods” section.
“Temporal evolution of the 2015/16 MHWs” section includes an analysis of MHWs detected in the region from
October 2015 through 2016. “The relative role of possible MHW drivers” section investigates the role of the jet
stream position, as well as Gulf Stream meandering, ring formation, and latent heat flux as possible drivers of
these SST anomalies. The results are discussed in “Discussion” section.
Data and methods
MHWs are identified as anomalously warm, prolonged events with SST anomalies exceeding the 90th percentile
for a duration of 5 days or longer. This standard for defining MHWs using daily SST d ata19 was developed to
allow comparison of different events across seasons and geographic locations. Hobday et al.20 built upon this
MHW definition, proposing MHW categories based on intensity, which is the strength of the SST anomaly. We
apply the MHW detection algorithm by Hobday et al.19, on area-averaged daily SST data (described below) over
six sub-regions covering the shelf and slope region (Fig. 1) using a 30-year baseline from 1986 to 2016. The six
sub-regions are amalgamations of the Shelf/Slope boxes defined in Chen et al.6, and are defined by combinations
of their boxes (A–H and 1–11) as follows: our “South Slope” contains boxes A–B, “Center Slope” contains C–D,
“North Slope” contains E–H, “South Shelf ” contains 1–3 in the Middle Atlantic Bight, “Center Shelf ” contains
4–7 corresponding to the Gulf of Maine and Scotian Shelf, and “North Shelf ” contains 8–11 which is the Gulf
of Saint Lawrence merged with the Newfoundland Shelf. Seaward edges of the Slope boxes are chosen to be
roughly parallel to the main axis of the Gulf Stream to contain part of the Slope Sea, which is the region between
the continental shelf and Gulf Stream.
The SST data used is the NOAA ¼° daily Optimum Interpolation Sea Surface Temperature (OISST)21 dataset
comprising global SST data from 1982 to 2019. OISST blends observations from satellites, ships, buoys, and Argo
Scientific Reports | (2021) 11:17623 | https://doi.org/10.1038/s41598-021-97012-0 2
Vol:.(1234567890)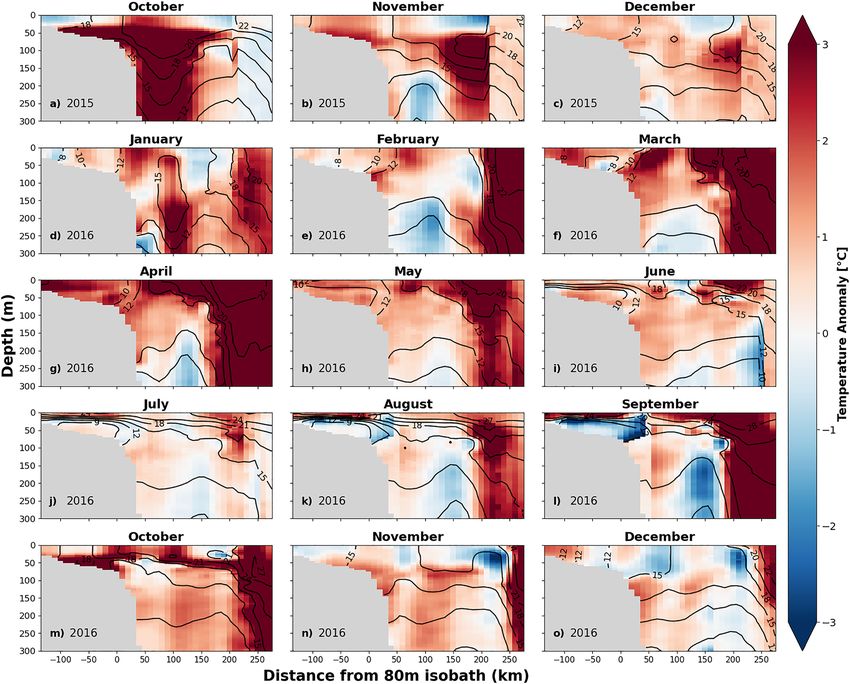
www.nature.com/scientificreports/
floats21. Due to the long timescales over which the drivers of the MHW events operate, our other analyses (e.g.,
of water column temperature anomalies and jet stream position) are conducted with monthly-averaged data.
A Jet Stream Visualization (jsviz) tool22 provides maps and vertical sections of atmospheric pressure and
high-wind features every 6 h based on the hourly 4D ERA5 atmospheric reanalysis data from the European
Centre for Medium-Range Weather Forecasts23. The jet stream’s latitudinal position for a given longitudinal
slice, is characterized by a maximum wind speed (greater than 40 m/s) within the upper-troposphere/lower-
stratosphere. A 30-day low-pass Butterworth filter is applied to produce the jet stream’s latitudinal positions
across 77–50° W. This time series of jet stream position is used here to examine the variability of the jet stream
during 2015/16 and to compare this to other years. The jet stream latitudinal position climatology is based on the
30-year period 1986–2016. Due to the strong gradient in atmospheric temperatures that is associated with the
jet stream, we interpret the position of the jet stream as a proxy for more or less heat flux into the ocean. Hence,
an anomalously far south jet stream position would generally reduce the heat flux into the ocean to the north
of the jet. While an increased heat flux would be associated with an anomalously far north jet stream position.
To investigate heat fluxes, latent heat flux data from the JRA-55 atmospheric reanalysis p roduct24 is used, which
25
spans 1958–present. We focus on latent heat flux as Schlegel et al. found this to be the most relevant term that
modulated the onset and decline of marine heatwaves in the NWA.
A time-mean Gulf Stream path is defined by the 25-cm sea surface height (SSH) contour in the 1993–2017
time-averaged SSH field calculated from daily satellite altimetry maps, as described in A ndres9. The 25-cm SSH
contour from monthly-mean SSH maps is used to investigate the time-variable Gulf Stream path, its proximity
to the continental shelf, and to identify meanders. Additionally, to examine the roles of WCRs, which can be
generated from pinched off meander crests26, the Warm Core Ring Census (1980–2017) as described in Gango-
padhyay et al.27,28 is used to establish the interannual variability in the number of WCRs formed and to examine
where the WCRs dissipated in 2015/1627.
Since 1977, XBTs have been deployed from the container ship CMV Oleander on its repeat track from Eliza-
beth, New Jersey to Hamilton, B ermuda29, providing a unique long-term dataset. To investigate the sub-surface
expression (vertical structure of water temperature) of the MHW on the southern shelf and slope, we use the
monthly XBT gridded temperature sections from the Oleander Line, described in Forsyth et al.13. These transects
span the New Jersey shelf to the northern edge of the Gulf Stream from 1977 to 2018, and temperature anomalies
relative to a monthly climatology are reported on a 10-km (cross-shelf) by 5 m (vertical) grid30. The cross-shelf
positions are defined by the distance between the temperature profile and the 80-m isobath, which is the average
location of the foot of the shelf break front off New Jersey29,31.
Results
Temporal evolution of the 2015/16 MHWs. We identify and examine MHWs in the NWA for the
period October 2015 to December 2016. According to the surface MHW detection algorithm, there are a total
of 7 MHWs for the entire NWA during this period, ranging in intensity from “moderate” to “strong”, and rang-
ing in length from 5 to 42 days. Even though much of the NWA had elevated SST during late 2015 and 2016
(not shown), the NWA did not meet the MHW threshold continuously for the entire period. Rather, SSTs in the
NWA flipped into (and then out of) MHW states, likely driven by various mechanisms throughout the year. We
focus primarily on three periods in the 15-month period, which are the fall 2015, the winter 2015/16, and late
summer 2016 into fall 2016, when multiple of the sub-regions experienced MHW conditions. The intensity of
the MHWs varied geographically within the NWA shelf and slope region (Fig. 2). Each sub-region of the shelf
and slope hence experienced “moderate” to “strong” MHWs, though not necessarily concurrently. The greatest
regional SST anomalies were observed during winter 2015/16, with peak anomalies occurring in the South and
Center Slope regions in January. By the end of November 2015, the northern regions had cooled (eventually
even exhibiting negative temperature anomalies), but the center and southern sub-regions on the shelf and slope
maintained elevated SST anomalies throughout the winter and early spring. In August, the anomalous warming
became more widespread in all regions, and was especially intense in the Center/South Shelf and Slope. These
spatial differences in the evolutions of SST anomalies averaged by sub-region, suggest that the MHWs in this
time period were likely driven by different forcing mechanisms, discussed in “Discussion” section.
During the 15-month period, the entire NWA experienced 7 MHWs. Breaking it down further the combined
Shelf (area-averaged over North, Center, and South) region experienced 4 MHWs and the combined Slope region
experienced 8 MHWs. The longest and most intense MHWs were concentrated in the center and southern
regions (Fig. 2). The South Slope experienced the most MHWs with a total of 13 events and had 248 MHW days
(out of 457 days for the 15-month period). The region that experienced the least anomalous warmth was the
North Shelf which experienced 2 MHWs with a total of 40 MHW days. The Center Shelf had 10 MHWs with a
total of 166 MHW days. A 45-day long “moderate” MHW that lasted from February to April 2016 was the largest
event of the ten. The South Shelf experienced 12 MHWs with a total of 163 MHW days. Its biggest event was a
40-day long “strong” MHW that started in December 2015 and ended in January 2016.
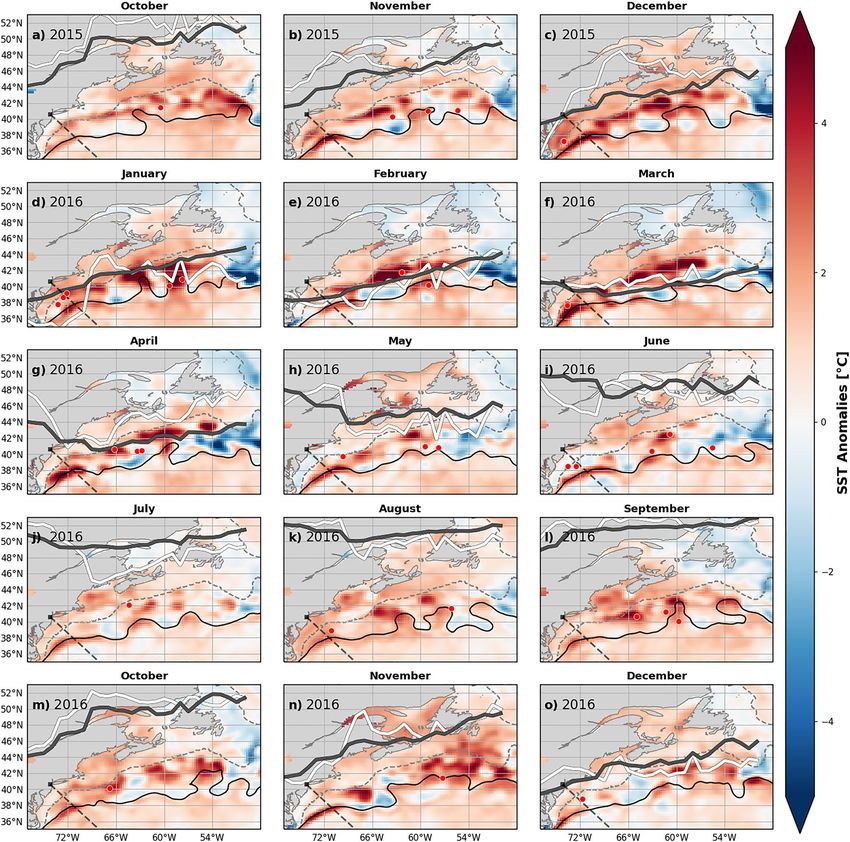
Fall 2015. In October 2015, positive SST anomalies were widespread across the NWA (Fig. 3a). In the North
Slope, South Shelf, and South Slope (Fig. 2b,e,f) “strong” MHW conditions were abating or had just ended. The
Southern Slope had just experienced its largest event on record from February 2015 to October 2015, a 221-day
long “strong” MHW. In the northern regions temperatures had begun to decrease. By November 2015, all other
regions were still anomalously warm, though technically no longer in MHW states. During this same time, the
jet stream was anomalously far north across most of the region 77–50° W, relative to the 1986–2016 climatology
(Fig. 3a–c, white line). The jet stream latitudinal anomaly was especially pronounced in December 2015 over
about 70–60° W, and was displaced northward by about 8° from its climatological position (Fig. 3c, white line).
Scientific Reports | (2021) 11:17623 | https://doi.org/10.1038/s41598-021-97012-0 3
Vol.:(0123456789)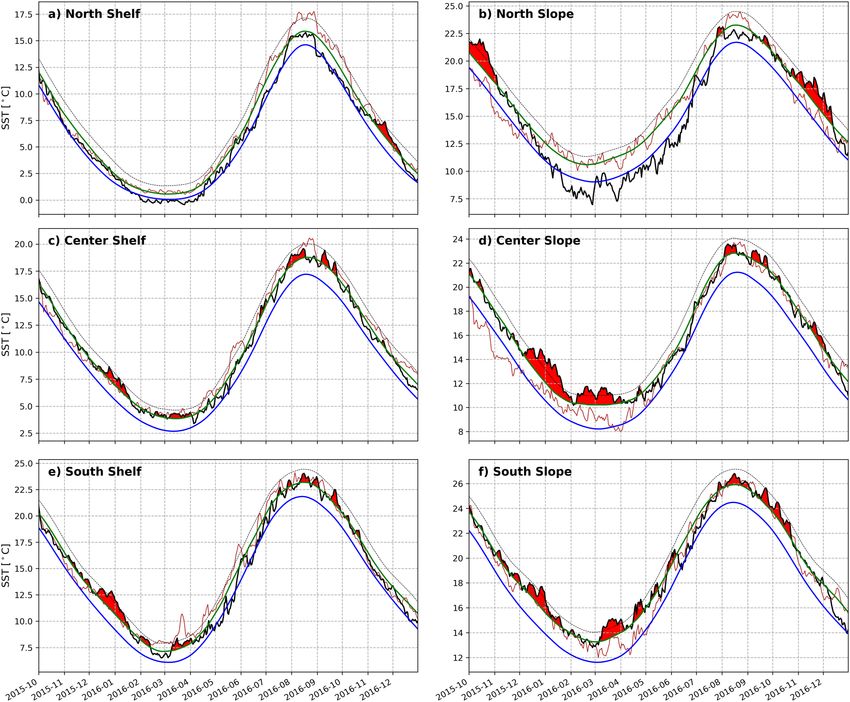
www.nature.com/scientificreports/

                                            Figure 2.  Evolution of the daily SST within sub-regions for October 2015 to December 2016 (black lines). The
                                            October 2011 to December 2012 SSTs are shown for comparison (red line). The blue line is the climatology
                                            based on a 30-year period (1986–2016). The green line is the threshold (90th percentile), as described in Hobday
                                            et al.19,20. The dashed line is twice the threshold, which categorizes a ‘strong’ MHW category. The red shading
                                            indicates a MHW. Note that the y-axes for all plots are different to increase visibility, since SST varies greatly
                                            from north to south.

                                            To get a sense of subsurface anomalies in the Slope and encroaching onto the Shelf, we consider the data from
                                            the Oleander line. These show subsurface temperature anomalies of > 3 °C, as well as anomalies of > 2 °C in the
                                            upper 50 m in October 2015 (Fig. 4a). By the end of fall 2015 and beginning of winter 2016, the strongest SST
                                            signals were seen in the Center and South Slope (Fig. 3b–d).

                                            Winter 2015/16. As noted earlier, by the end of 2015 a MHW in the North Slope ended. Area-averaged SST
                                            anomalies in the northern regions became less pronounced and decreased to about a 0.5 °C anomaly in the
                                            North Shelf as the North Slope experienced a cold anomaly of −0.5 °C in December 2015. Despite this, SST
                                            anomalies in the center and southern sub-regions remained positive in December 2015, with area-averaged SSTs
                                            here exceeding the baseline by more than 1.6–2.6 °C. During this period, the uniform spatial expression of SST
                                            anomalies across the NWA, noted during October 2015 (Fig. 3a), changed over the course of December 2015 to
                                            April 2016 (Fig. 3c–g) as the SST anomalies became concentrated and intensified in the Center and Southern
                                            Slope. Additionally, along the Oleander Line in October and November strong temperature anomalies of > 3 °C
                                            are seen in Fig. 4a,b.
                                                In concert with these SST signatures, large amplitude meanders of the Gulf Stream’s path (determined from
                                            the 25-cm SSH contour and denoted with the black curves in Fig. 3) evolved south of Nova Scotia and the Gulf
                                            of St. Lawrence from October 2015 to January 2016. Some of those meanders pinched off and formed WCRs,
                                            which tend to propagate southwestward along the continental slope. Notably, 7 WCRs were formed in the Center
                                            Slope in December 2015 (not shown), which is about 5 more than the mean (1986–2016). Climatologically, WCR
                                            formations are highest in summer and lowest in winter. July has the most, with about 3 WCRs formations on

          Scientific Reports |   (2021) 11:17623 |               https://doi.org/10.1038/s41598-021-97012-0                                                 4

Vol:.(1234567890)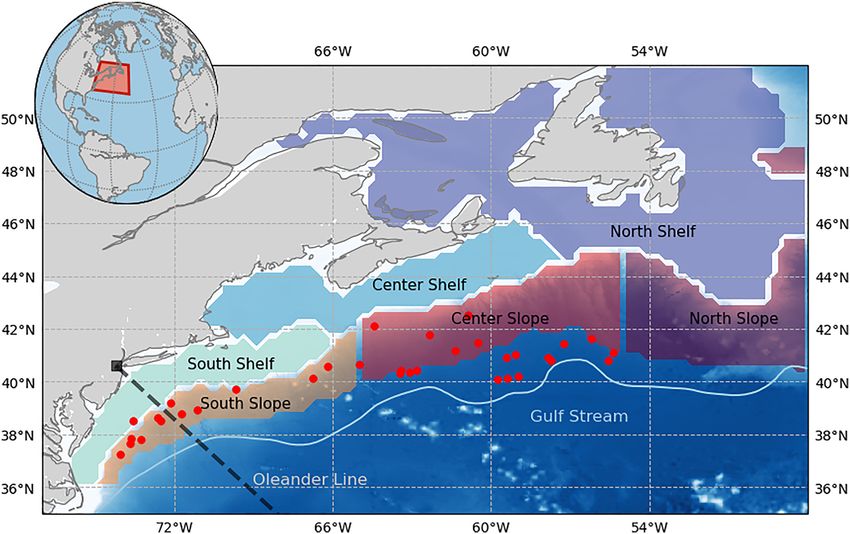
www.nature.com/scientificreports/
Figure 3. SST anomalies in the NWA for the 15-month period 2015/16. Black dashed line indicates the
Oleander Line. Black solid curve indicates the average Gulf Stream path (based on 25 cm SSH isoline) for each
month. Positions of WCRs on their date of absorption for the 15-month period are indicated with red dots. Gray
dashed line is the isobath contour at 500 m. The thick gray line is the climatological position of the jet stream
(1986–2016). The thick white line is the jet stream’s latitudinal position for 2015/16. These maps were generated
using Python version 2.7.5.
average. December has the fewest, with about 1 WCR formation on average10. Interestingly, 3 of those 7 WCRs
formed in December 2015 were absorbed back into the Center and South Slope in early January 2016 (Fig. 3d,
red dots). In total, 5 WCRs were absorbed into the Center and South Slope in January, which is about 4 more
WCRs than usual (Fig. 5) and therefore likely contributing to the observed temperature anomalies.
The sub-region that experienced the most intense MHW during the winter 2015/16 was the Center Slope with
a “strong” MHW that lasted 59 days, from December to January, with a mean SST of 13.4 °C (2.8 °C anomaly).
The South Slope also experienced a “strong” MHW that lasted 44 days around the same time period, with a
mean SST of 16.4 °C (2.4 °C anomaly). Concurrently the Center and South Shelf experienced MHWs, although
the Center Shelf only experienced a “moderate” MHW. The South Shelf also experienced a “strong” heatwave
that lasted 40 days from December to January and had an area-averaged SST of 11.9 °C (2.6 °C anomaly). This
implies the impact of the warm slope waters on the continental shelf temperatures. Besides the anomalous posi-
tion of the jet stream in December 2015, there are not many other anomalies/variability of the jet stream for
Scientific Reports | (2021) 11:17623 | https://doi.org/10.1038/s41598-021-97012-0 5
Vol.:(0123456789)www.nature.com/scientificreports/
Figure 4. Vertical sections of temperature anomalies along the Oleander Line. Color shading indicates the
temperature anomaly and the black lines indicate the isotherms. This figure was generated using Python version
2.7.5.
January to March 2016 (Fig. 3d–f). Along the Oleander Line temperature at-depth anomalies (Fig. 4a–h) likely
contributed to the South Slope MHWs, although the subsurface anomalies wouldn’t have been detected by the
MHW detection algorithm.
For the winter 2015/16, the positive temperature anomalies along the Oleander line persisted at depth beyond
the duration of the surface-defined MHWs. The subsurface temperature sections show almost uniform warm-
ing with depth over the shelf in November–December 2015. In Fig. 4f–g, the March–May 2016 period exhibits
strong warming, exceeding 2–3 °C at depth and across the continental shelf.
Spring 2016. Beginning around May 2016, all regions saw an increase in the temperature anomaly. The jet
stream position in April (Fig. 3g) was anomalously far north over almost the whole region, with a small trough
at about 70° W. Additionally, the Gulf Stream appeared to be northwestward-shifted in April (Figs. 3g, 4g) as
surface and at-depth temperature anomalies > 3 °C increased temperatures in the South Slope (Fig. 4f–h). The
rest of the summer did not see an anomalously northward jet stream, although there was some variation in the
path, nothing greater than 4°N of its usual position. The Center Shelf experienced a series of short, “moderate”
MHWs starting in June and lasting until November (Fig. 3i–o). The South Slope entered a “moderate” MHW
that lasted 41 days from late July to September. Surface-concentrated anomalies of > 1 °C can be seen during the
same time period along the Oleander Line (Fig. 4i–l).
Summer and Fall 2016. In July 2016, SSTs began to increase across all of the Shelf/Slope sub-regions (Fig. 2).
However, it was not until August when all regions, except for the North Shelf, started to experience MHW states.
As time progressed, the warming became more uniform across the regions (Fig. 3k–o). The Gulf Stream’s path
became “wigglier” in August (Fig. 3k–m) and strong warming signals were associated with the large meanders.
Those “hot spots’’ were concentrated in the slope regions from August to November 2016. The temperature
Scientific Reports | (2021) 11:17623 | https://doi.org/10.1038/s41598-021-97012-0 6
Vol:.(1234567890)www.nature.com/scientificreports/
Figure 5. The number of WCR absorptions in the NWA from October 2015 to December 2016 (red line) is
plotted against the absorption climatology for 1986–2016 (black line). An “absorption” occurs when a WCR
merges back into the Gulf Stream or dissipates locally.
anomalies at the Oleander Line started to deepen in September 2016 (Fig. 4l). In October 2016, the temperature
anomalies extended throughout the water column (Fig. 4m). Then in November and December 2016 the anoma-
lies at the Oleander Line decreased, but persisted subsurface (Fig. 4n–o).
SST anomalies peaked in October 2016 for the center and southern regions with anomalies between 1.4 and
2.1 °C. For the northern regions, SST anomalies peaked in November 2016 at 1.6–2.3 °C. Although other regions
weren’t experiencing as strong SST anomalies, the uniform warming in November 2016 (Fig. 3n) is similar to the
pattern in March for the 2012 MHW, in which an unusually northward-shifted jet stream suppressed heat loss
from the ocean4,8. As previously mentioned, all regions experienced varying intensities of MHWs in November
to December 2016. The Center Slope had a “moderate”, 26-day long MHW during this period. The North Shelf
experienced a “strong” MHW that lasted 34 days in the same period. The North Slope experienced a 50-day long
“strong” MHW. The jet stream was northward shifted over about 72–66° W in October to November (Fig. 3m,n).
The SST anomalies in late fall 2016 MHW differed from those in winter 2015/16 in their spatial expression.
The winter 2015/16 exhibited strong warming in the center and southern regions, where the influence of the
Gulf Stream impacted shelf and slope temperatures, while the northern regions remained cool (Fig. 3a–i). This
contrasts with November 2016 when warming was relatively uniform across the Shelf/Slope regions and most
regions entered a “moderate” or “strong” MHW state.
The relative role of possible MHW drivers. Starting in late fall 2015, the jet stream remained north of
its climatological position through the rest of 2015 (Fig. 6a–c), likely driving an increased heat flux south of the
front from the warm subtropical air into the ocean. Usually the movement of the front in the fall brings cool
polar air southward with it. This can be seen in Fig. 6c in which the center and southern regions have a negative
heat flux anomaly, meaning that the region gained more heat than usual in December 2015.
It is likely that the increased heat flux into the ocean during December 2015 initiated the winter 2015/16
MHWs that the center and southern regions experienced. This is consistent with Schlegel et al.25, who found
that latent heat flux is the most common driver of the start of MHWs in the NWA. The unusually active Gulf
Stream meandering and WCR formations/absorptions in winter 2015/16 then further fueled the anomalous SST
patterns observed in the Center and South Slope, as well as the anomalies seen at depth along the Oleander line
from January to April 2016 (Fig. 4d–g).
The jet stream’s position throughout the rest of winter 2015/16 was consistent with its mean climatological
position (Fig. 6d–f). This situation differs from 2012, when the jet stream had an anomalously northward-
shifted position over the shelf regions during February and March (not shown). In 2016, there was no similar
shift in March. Despite this difference in jet stream position in 2016 versus 2012, the 2016 SST anomalies were
similar to 2012. This suggests other drivers must have maintained the high SST anomalies from January to April
2016 (Fig. 3d–g). Notably, strong positive latent heat flux anomalies are seen in November 2015, January 2016,
April 2016, and December 2016 (Fig. 6b,d,g,o) indicates the ocean was losing more heat than usual. In addition
to the negative latent heat flux anomalies seen in December 2015, negative anomalies are seen in center and
northern regions in February 2016 (Fig. 6e), in southern regions in March 2016 (Fig. 6f), and northern regions
in November 2016 (Fig. 6n). For the remaining months of 2016, May to October 2016, latent heat fluxes are not
too anomalously positive or negative (Fig. 6h–m).
In late fall 2016, the jet stream shifted northward into an anomalous position over about 72–66° W in October
to November 2016 (Fig. 6m,n). Combined with a uniform “strong” MHW event across the northern regions
and negative latent heat flux over the same region (Fig. 6m,n) points to an atmospherically-forced MHW for
the late fall 2016.
Scientific Reports | (2021) 11:17623 | https://doi.org/10.1038/s41598-021-97012-0 7
Vol.:(0123456789)www.nature.com/scientificreports/
Figure 6. Latent heat flux anomaly for the 2015/16 period. Negative (positive) anomalies indicate the ocean is
gaining (losing) more heat than usual for the 1986–2016 period. The thick gray line is the climatological position
of the jet stream (1986–2016). The thick white line is the jet stream’s latitudinal position for 2015/16. These maps
were generated using Python version 2.7.5.
Discussion
Our analysis suggests that multiple processes played a role in driving the MHWs during 2015/16. The fall 2015
MHWs seemed to be mostly atmospherically-driven and coincided with an anomalously northward-shifted and
persistent jet stream, which has previously been s hown4,8 to influence the shelf temperatures of the NWA. The
jet stream position in December 2015 heatwave seemed to initiate a winter 2015/16 MHW. SSTs were already
anomalously warm, although not technically in a MHW state. With SST anomalies that were well-above the
mean leading into the winter, the winter 2015/16 MHW was then likely maintained by ocean advection. The
pre-conditioning from the fall likely increased the intensity of the winter MHWs. During the winter 2015/16
large amplitude meanders of the Gulf Stream appeared south of Nova Scotia and the Gulf of St. Lawrence,
resulting in very large temperature anomalies over the continental slope. More WCRs than usual (11 versus 3)
were absorbed into the Slope from January to March 2016 (Fig. 5) and likely fueled a “moderate’’ MHW in the
Center Shelf and “strong” MHWs in the Center Slope, South Shelf, and South Slope. The MHW during the fall
of 2016 was also likely forced by the jet stream remaining well north of its normal position. The warm conditions
Scientific Reports | (2021) 11:17623 | https://doi.org/10.1038/s41598-021-97012-0 8
Vol:.(1234567890)www.nature.com/scientificreports/
in the fall occurred over a wide shelf region in the Middle Atlantic Bight, especially in October. This pattern is
consistent with atmospheric forcing of the MHW, similar to the 2012 event. In summary, for these MHW events,
an interplay of atmospheric and oceanic drivers initiated and maintained MHWs in the NWA during 2015/16.
Globally, the intensity and number of MHW events is projected to increase1. Although much focus is on the
surface expression of the MHWs, there are extreme warming events in the subsurface water masses as well, as
corroborated by the Oleander temperature sections examined here, and these subsurface expressions can have
wide-reaching impacts on marine ecosystems. Gawarkiewicz et al.14,32 have shown, using recent observations
from the Pioneer Array, that intrusions of warm, salty water associated with WCRs that impinge on the upper-
slope and outer shelf are now resulting in intrusions that reach much further onshore across the continental shelf
than in previous decades. This may have significant impacts on both the region’s primary productivity and fishing
outcomes during WCR intrusions. Gawarkiewicz et al.14 noted that annual average chlorophyll-a distributions
during times of on-shelf intrusion were the lowest shelf-wide concentrations reported for data going back to
1998. Thus, these warm subsurface features, which may occupy the shelf for up to 4 months, may have effects
that extend throughout the year.
Additionally, Neto et al.15 and Brickman et al.16 have discussed the implications that a northward-shifted
Gulf Stream interacting with the Labrador Current can have on long-term warming on the continental shelf. We
acknowledge that this mechanism may have also impacted Shelf/Slope temperatures during the study period,
but due to the lack of high-resolution sub-surface measurements at present we did not explore this for the whole
NWA. A dedicated observational program or modelling study would be needed to investigate this mechanism
as a driver for MHWs in the future.
Superimposed on the individual MHWs examined here, the average SST across the entire NWA in 2016 was
higher than the climatological mean for the whole year, and was not just elevated during the MHW events. The
persistent warmer-than-average temperatures in early 2012 caused lobster to molt in April, rather than the typical
timing in J uly5. The annual cycle of lobster landings for 2016 was almost identical to that in 2012, presumably
brought on by the warmer-than-average temperatures during the winter of 2015/16. However, as discussed in
Pershing et al.5, markets were prepared for this early molt based on their prior experience in 2012 and thus prices
did not crash as they had in 2012.
Though generally viewed as detrimental to economically important species like lobster3,5,33, elevated water
temperatures are associated with increased presence of other mid-Atlantic species like blue crabs and longfin
squid (Loligo) in northern regions like the Gulf of Maine3,5. The annual catch of Loligo skyrocketed in 2016.
The average landings for the previous 9 years (2007–2015) was 10.8 hundred metric tonnes. The 2016 landings
were 18.3 hundred metric tonnes, a ~ 70% increase from the previous 9 years. The 2016 catch was the largest
since 199917. Not only are persistently warmer conditions advantageous to some species and harmful to others18,
but it is also possible that the timing of MHW events plays an important role in their ecological and economic
impacts. Though further work is necessary to understand how the ecosystem responds to MHWs forced by
different drivers, these extreme events may have substantial impact on lobster and squid, two commercially
important species of New England.
Data availability
Use of the following datasets is gratefully acknowledged: NOAA High Resolution SST data v2.1 provided by the
NOAA/OAR/ESRL PSL, Boulder, Colorado, USA, from their website at https://psl.noaa.gov/data/gridded/data.
noaa.oisst.v2.highres.html, the XBT data product, gridded and monthly averaged from 1977 to 2018, is available
at https://doi.org/10.5281/zenodo.3967332, the raw CMV Oleander data is available at http://oleander.bios.edu/
data/. The Warm Core Ring Census for 1980–2017 is available from Biological and Chemical Oceanography Data
Management office (BCO–DMO) at https://doi.org/10.26008/1912/bco-dmo.810182.1, the ECMWF Reanalysis
(ERA5) data is available at https://cds.climate.copernicus.eu/cdsapp#!/home. The Jet Stream Visualization tool,
jsviz, was developed by Sara Haines and is available at http://d oi.o
rg/1 0.5 281/z enodo.4 57093 1. The MHW detec-
tion algorithm was written by Eric C. J. Oliver and available at https://github.com/ecjoliver/marineHeatWaves.
Files used by the author to calculate anomalies and plot figures are available upon request.
Received: 16 March 2021; Accepted: 12 August 2021
References
1. Oliver, E. C. J. et al. Projected marine heatwaves in the 21st century and the potential for ecological impact. Front. Mar. Sci. 6, 734
(2019).
2. Laufkötter, C., Zscheischler, J. & Frölicher, T. L. High-impact marine heatwaves attributable to human-induced global warming.
Science 369, 1621–1625 (2020).
3. Mills, K. E. et al. Fisheries management in a changing climate: Lessons from the 2012 ocean heat wave in the Northwest Atlantic.
Oceanography 26, 191–195 (2013).
4. Chen, K., Gawarkiewicz, G. G., Lentz, S. J. & Bane, J. M. Diagnosing the warming of the Northeastern US Coastal Ocean in 2012:
A linkage between the atmospheric jet stream variability and ocean response. J. Geophys. Res. C Oceans 119, 218–227 (2014).
5. Pershing, A. J., Mills, K. E., Dayton, A. M., Franklin, B. S. & Kennedy, B. T. Evidence for adaptation from the 2016 marine heatwave
in the Northwest Atlantic Ocean. Oceanography 31, 152–161 (2018).
6. Chen, Z. et al. Long-term SST variability on the northwest Atlantic continental shelf and slope. Geophys. Res. Lett. 47,
e2019GL085455 (2020).
7. Fisheries, N. Fisheries of the United States, 2018 report. http:// w ww. f ishe r ies. n oaa. g ov/ resou rce/ d ocum e nt/ f ishe
ries-united-states-2018-report.
8. Chen, K., Gawarkiewicz, G., Kwon, Y.-O. & Zhang, W. G. The role of atmospheric forcing versus ocean advection during the
extreme warming of the Northeast US continental shelf in 2012. J. Geophys. Res. C Oceans 120, 4324–4339 (2015).
Scientific Reports | (2021) 11:17623 | https://doi.org/10.1038/s41598-021-97012-0 9
Vol.:(0123456789)www.nature.com/scientificreports/
9. Andres, M. On the recent destabilization of the Gulf Stream path downstream of Cape Hatteras. Geophys. Res. Lett. 43, 9836–9842
(2016).
10. Gangopadhyay, A., Gawarkiewicz, G., Silva, E. N. S., Monim, M. & Clark, J. An observed regime shift in the formation of warm
core rings from the Gulf Stream. Sci. Rep. 9, 12319 (2019).
11. Gawarkiewicz, G. G., Todd, R. E., Plueddemann, A. J., Andres, M. & Manning, J. P. Direct interaction between the Gulf Stream
and the shelfbreak south of New England. Sci. Rep. 2, 553 (2012).
12. Ullman, D. S., Codiga, D. L., Pfeiffer-Herbert, A. & Kincaid, C. R. An anomalous near-bottom cross-shelf intrusion of slope water
on the southern New England continental shelf. J. Geophys. Res. Oceans 119, 1739–1753 (2014).
13. Forsyth, J., Andres, M. & Gawarkiewicz, G. Shelfbreak jet structure and variability off New Jersey using ship of opportunity data
from the CMV oleander. J. Geophys. Res. C Oceans 125, e2020JC016455 (2020).
14. Gawarkiewicz, G. et al. Characteristics of an advective marine heatwave in the middle atlantic bight in early 2017. Front. Mar. Sci.
6, 712 (2019).
15. Neto, A. G., Langan, J. A. & Palter, J. B. Changes in the Gulf Stream preceded rapid warming of the Northwest Atlantic Shelf.
Commun. Earth Environ. 2, 1–10 (2021).
16. Brickman, D., Hebert, D. & Wang, Z. Mechanism for the recent ocean warming events on the Scotian Shelf of eastern Canada.
Cont. Shelf Res. 156, 11–22 (2018).
17. Hendrickson, L. C. Longfin Inshore Squid (Doryteuthis (Amerigo) pealeii) Stock Assessment Update for 2017 (US National Marine
Fisheries Service, Northeast Fisheries Science Center, 2017).
18. Hare, J. A. et al. A vulnerability assessment of fish and invertebrates to climate change on the Northeast U.S. Continental Shelf.
PLoS ONE 11, e0146756 (2016).
19. Hobday, A. J. et al. A hierarchical approach to defining marine heatwaves. Prog. Oceanogr. 141, 227–238 (2016).
20. Hobday, A. J. et al. Categorizing and naming marine heatwaves. Oceanography 31, 162–173 (2018).
21. Reynolds, R. W. et al. Daily high-resolution-blended analyses for sea surface temperature. J. Clim. 20, 5473–5496 (2007).
22. Haines, S. jsviz: Jet Stream Visualization Tool. https://doi.org/10.5281/zenodo.4570931 (2021).
23. Hersbach, H. et al. The ERA5 global reanalysis. Q. J. R. Meteorol. Soc. 146, 1999–2049 (2020).
24. Kobayashi, S. et al. The JRA-55 reanalysis: General specifications and basic characteristics. 気象集誌. 第2輯 93, 5–48 (2015).
25. Schlegel, R. W., Oliver, E. C. J. & Chen, K. Drivers of marine heatwaves in the Northwest Atlantic: The role of air–sea interaction
during onset and decline. Front. Mar. Sci. 8, 627970 (2021).
26. Cornillon, P., Lee, T. & Fall, G. On the probability that a Gulf Stream meander crest detaches to form a warm core ring. J. Phys.
Oceanogr. 24, 159–171 (1994).
27. Gangopadhyay, A. & Gawarkiewicz, G. Yearly census of Gulf Stream warm core ring formation from 1980 to 2017. Biol. Chem.
Oceanogr. Data Manag. Off. https://doi.org/10.26008/1912/BCO-DMO.810182.1 (2020).
28. Gangopadhyay, A. et al. A census of the warm-core rings of the Gulf Stream: 1980–2017. J. Geophys. Res. C Oceans 125,
e2019JC016033 (2020).
29. Forsyth, J. S. T., Andres, M. & Gawarkiewicz, G. G. Recent accelerated warming of the continental shelf off New Jersey: Observa-
tions from the CMVOleander expendable bathythermograph line. J. Geophys. Res. C Oceans 120, 2370–2384 (2015).
30. Forsyth, J. Gridded Oleander XBT Data. https://doi.org/10.5281/zenodo.3967332 (2020).
31. Linder, C. A. & Gawarkiewicz, G. A climatology of the shelfbreak front in the Middle Atlantic Bight. J. Geophys. Res. 103, 18405–
18423 (1998).
32. Gawarkiewicz, G. et al. The changing nature of shelf-break exchange revealed by the OOI Pioneer Array. Oceanography 31, 60–70
(2018).
33. Rheuban, J. E., Kavanaugh, M. T. & Doney, S. C. Implications of future Northwest Atlantic bottom temperatures on the American
Lobster (Homarus americanus) fishery. J. Geophys. Res. Oceans 122, 9387–9398 (2017).
Acknowledgements
The work was supported by a Woods Hole Oceanographic Institution Summer Student Fellowship (to E.P.)
through the National Science Foundation (NSF) REU under grant OCE-1852460, a Feodor-Lynen Fellowship
by the Alexander von Humboldt Foundation and the WHOI Postdoctoral Scholar program (to S.R.), NSF grants
OCE-1924041 (to M.A.) and OCE-1851261 (to G.G.) and OCE-1558920 (to J.B. and H. Seim at the Univ. of
North Carolina), ONR grant N-14-19-1-2646 (to G.G.), and the James E. and Barbara V. Moltz Fellowship for
Climate-Related Research (to C.C.U.). Comments by two anonymous reviewers on an earlier version of the
manuscript are gratefully acknowledged.
Author contributions
E.P. analyzed data, wrote the first draft, made figures, oversaw edits, and compiled references. S.R., M.A., G.G.,
and C.C.U. discussed interpretation and overall structure of the manuscript at every stage. S.R. assisted in
analysis, adapted MHW detection code for NWA, provided important feedback on figures. M.A. provided Gulf
Stream data and assisted interpretation and analysis of Oleander data and Gulf Stream data. G.G. assisted in
interpretation and analysis of WCR data, provided insights into the fishery response to ocean warming. C.C.U.
assisted in analysis, improvement of figures, and provided important feedback at every stage. S.H. helped with
analysis of jet stream data. S.H. and J.B. discussed interpretation of jet stream analysis and provided important
feedback on manuscript.
Competing interests
The authors declare no competing interests.
Additional information
Correspondence and requests for materials should be addressed to E.P.
Reprints and permissions information is available at www.nature.com/reprints.
Publisher’s note Springer Nature remains neutral with regard to jurisdictional claims in published maps and
institutional affiliations.
Scientific Reports | (2021) 11:17623 | https://doi.org/10.1038/s41598-021-97012-0 10
Vol:.(1234567890)www.nature.com/scientificreports/
Open Access This article is licensed under a Creative Commons Attribution 4.0 International
License, which permits use, sharing, adaptation, distribution and reproduction in any medium or
format, as long as you give appropriate credit to the original author(s) and the source, provide a link to the
Creative Commons licence, and indicate if changes were made. The images or other third party material in this
article are included in the article’s Creative Commons licence, unless indicated otherwise in a credit line to the
material. If material is not included in the article’s Creative Commons licence and your intended use is not
permitted by statutory regulation or exceeds the permitted use, you will need to obtain permission directly from
the copyright holder. To view a copy of this licence, visit http://creativecommons.org/licenses/by/4.0/.
© The Author(s) 2021
Scientific Reports | (2021) 11:17623 | https://doi.org/10.1038/s41598-021-97012-0 11
Vol.:(0123456789)You can also read


