Measurement of airflow pattern induced by ceiling fan with quad-view colour sequence particle streak velocimetry
←
→
Page content transcription
If your browser does not render page correctly, please read the page content below
Measurement of airflow pattern induced by ceiling
fan with quad-view colour sequence particle streak
velocimetry

Huan Wang1,2, Hong Zhang1,3, Xiaowei Hu2, Maohui Luo4, Guijin Wang2, Xianting Li1,*, Yingxin
Zhu1

1
  Department of Building Science, Beijing Key Laboratory of Indoor Air Quality Evaluation and
Control, Tsinghua University, Beijing, China
2
  Department of Electronic Engineering, Tsinghua University, Beijing, China
3
  Naval Research Institute, China
4
  Centre for Built Environment, University of California Berkeley, CA 94720, USA
*
  Corresponding email: xtingli@tsinghua.edu.cn

Abstract
Ceiling fans have been widely used for a long time as an effective cooling equipment to create sustainable
indoor environment. However, it is rather difficult for the current measuring techniques to capture such a
complicated airflow field in a whole-room scale. In this study, a novel large-scale airflow measurement
technology, quad-view colour sequence particle streak velocimetry (CSPSV), is developed and applied to
measure the airflow induced by a ceiling fan in a 4 m × 2.5 m × 3 m chamber. Four cameras were used in the
new method, two at the higher position measuring airflow near the ceiling while the other two at the lower
position measuring airflow near the floor, to capture the room-scale flow field. After reconstructing the vectors
from each camera pair, the airflow vectors are merged to fill the blind zone near the ceiling and floor. Based on
the three-dimensional three-component vector field measurement data, the averaged velocity vector, turbulence
intensity, and vorticity were calculated and the airflow patterns were analyzed. The results indicate that the
quad-view CSPSV method provides a more comprehensive measurement in room-size complex air movements
such as ceiling fan airflow. Six pattern zones can be identified for a typical ceiling-fan-induced airflow. The
flow under ceiling fan swirls along its path with the same rotation direction of fan blades with the core shrinking
gradually and becoming diluted by the surrounding air. This study provides a new velocimetry method for room-
sized complex airflow and a better understanding of ceiling fan airflow pattern, which is helpful to the new
concept of integrating ceiling fan with air conditioning system.

Keywords: CSPSV, Ceiling Fan, Measurement, Room Scale, Vorticity

        Building and Environment, April 2019, 152, 122-134   1         https://doi.org/10.1016/j.buildenv.2019.02.015
                                                                           https://escholarship.org/uc/item/2v88v264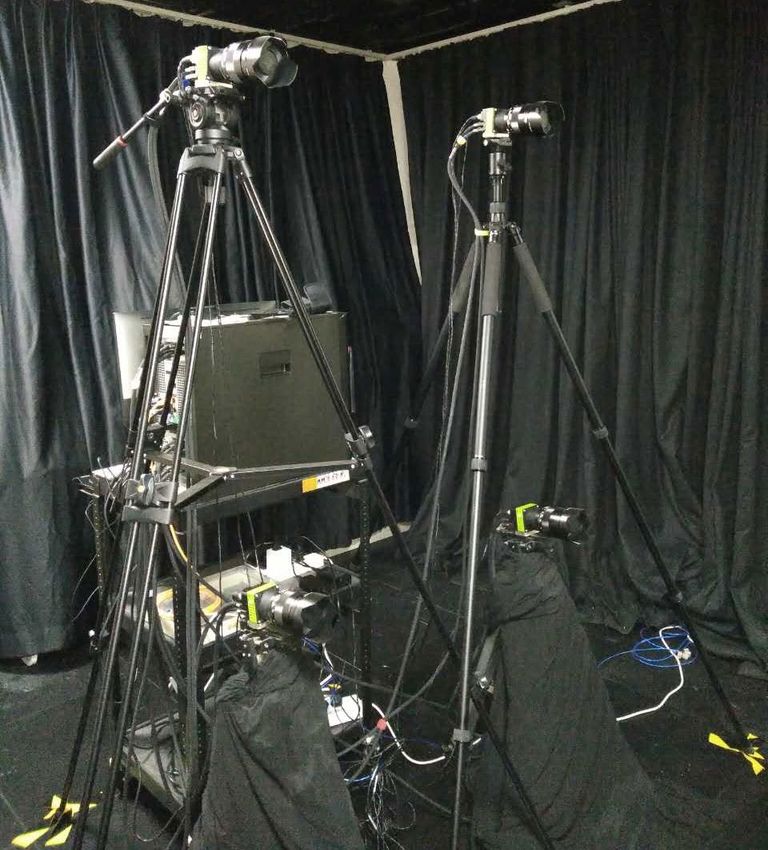
1 Introduction

The building sector consumes as much as 20–40% of the total energy in many countries while the heating
ventilation air-conditioning (HVAC) system accounts for almost half of it [1]. To save energy and improve
indoor environmental quality, methods to promote the energy efficiency of the HVAC system have been
emphasized in recent years. Among them, the ceiling fan has proven to be a straightforward but effective method
to increase indoor thermal comfort while reducing HVAC energy consumption [2]. Compared with conventional
air-conditioning systems, a ceiling fan consumes approximately 10% of its energy to provide the same comfort
level in an indoor environment [3].

According to previous research, the benefits of a ceiling fan can be attributed to many aspects. One is because
ceiling fan can enhance human body heat dissipation through convective heat transfer and sweat evaporation,
thus providing better thermal comfort perception in warm conditions [4–5]. Another reason is the corrective
power of ceiling fan when offsetting air-conditioning setpoint. A review study on indoor air movement [6]
revealed that a 1 m/s increase in air speed has the same effect as reducing the room temperature by 2–3 K.
Similar conclusions have been observed in many air movement studies [7–9]. Another advantage is the fast-
responding nature of air movement that can act to individual thermal demand quickly and locally. Given these
benefits, ceiling fan has been utilized as a flexible solution for indoor environment improvement. For example,
Zhu et al. [11] combined ceiling fan with ceiling ultraviolet radiation sterilization device; consequently, it
improved the efficiency of bacteria sterilization effectively and created a healthier and safer indoor public space.
Another case study [12] integrated ceiling fan with space heating and significantly reduced the thermal
stratification issue in heated buildings.

Considering the important role of ceiling fans in creating a sustainable indoor built environment, it is essential
to understand its airflow pattern for a better layout design and operation. However, it is still challenging for the
current measuring techniques to capture its flow field because of its large scale and complexity. The current
airflow visualization method can illustrate its primary flow structure, but little is known about the detailed
airflow characteristics [13–14]. One typical example is the study done by Gao et al. [15]. They measured ceiling
fan airflow speed in a room size chamber through intensive point-by-point measurements and visualize the flow
field using tracer gas method. Although they captured the speed values and rough direction information, the
structural characteristics of the flow field were not described intuitively. Moreover, regarding the ceiling fan
induced airflow itself, as the discharge speed of the ceiling fan is high and the roof height is limited, the airflow
could interact with the ceiling and floor intensely and affect the indoor airflow pattern, rendering the precise
airflow measurements in these areas is challenging. Therefore, a large space and three-dimensional airflow
measurement method would facilitate the further study of ceiling fans.

To date, widely used methods for indoor airflow pattern study are primarily computational fluid dynamics (CFD)
        Building and Environment, April 2019, 152, 122-134   2          https://doi.org/10.1016/j.buildenv.2019.02.015
                                                                            https://escholarship.org/uc/item/2v88v264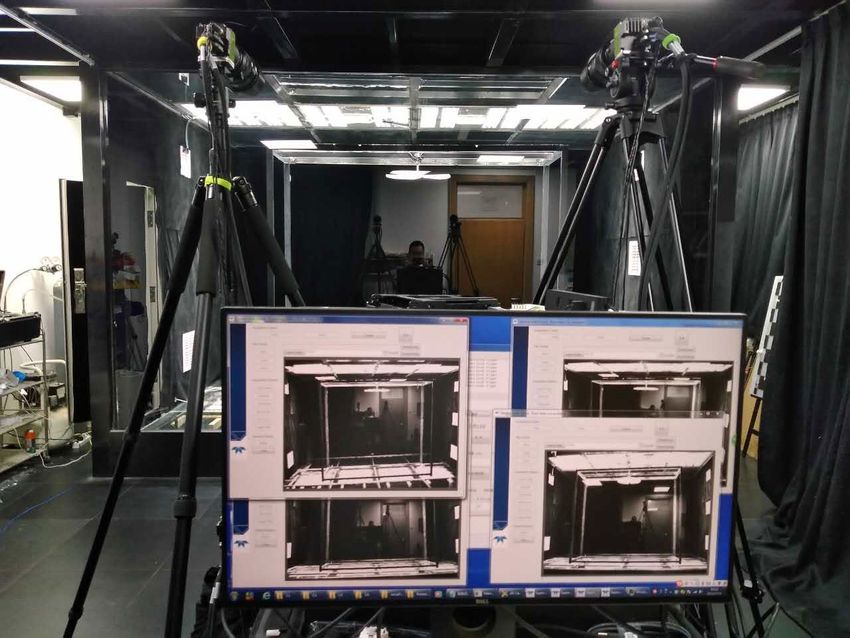
simulation [16–18] and field measuring by point with a heating wire anemometer (HWA) [13,15,19]. The CFD
approach can provide detailed airflow characters, but its accuracy highly relies on experimental validation and
user experience. HWA is the most widely used sensor for air velocity test but also accompanied with drawbacks.
For example, the measuring sensor must be placed in the flow field, rendering itself an obstacle for airflow, and
the released heat limits its use for low-speed airflow measurement. Further, the lack of flow direction
information leads to some missing flow characteristics. More importantly, the point-by-point HWA measuring
approach is labor intensive and time consuming. For non-intrusive measurement instruments, particle image
velocimetry could be the most commercially successful image-based velocimetry for airflow measurement [20].
However, its measurement space is limited; in a two-dimensional plane model, it hardly reaches 1 m2.

Particle streak velocimetry (PSV) which takes image with a long exposure time to record the path line segments
for tracking is more promising for room scale measurement [21]. However, the biggest challenge of PSV is the
direction ambiguity of streak. Towards this issue, pulsed laser with continuous light at different position was
introduced to coded streak patterns [22], while the light system is so complicated that only capable for thin layer
and the algorithm could fail when the seeding density is high. Different exposure time was set for two cameras
and let them start at the same time and stop at different time [23]. As the airflow is turbulent, the speed of
seeding particle changes dramatically making the time-based middle point does not always match the position-
based middle point, which causes problem in stereo correspondence and affects the results. Machacek [24] used
high speed camera to minimize the gap between streaks of the same seeding particle and improved algorithm
for tracking, which proved to be suitable for wind tunnel test. Since the frame rate and resolution are trade-off
parameters for cameras, the low resolution of high-speed cameras normally limits test space. Rosenstiel and
Grigat [25] improved the light system and streak segmentation method. The system conducted 2D2C
measurement in a cabin mock-up, whereas the measurement zone is limited on the light sheet and the recognition
of head and torso is also difficult very the particles are gathered.

Beside these attempts to improve PSV, colour sequence particle streak velocimetry (CSPSV) changes the
information-gathering method for image-based velocimetry and proved to be more suitable for room-scale
airflow pattern measurement [26]. The accuracy of CSPSV has been proven by verification with different targets
[26-27]. It extends the three-dimensional (3D) measurement zone from several cubic centimeters to several
cubic meters and is more feasible in performing real-site large-room airflow tests. However, owing to the
influence of over-exposed background and light source, a normal stereo CSPSV exhibits blind zones near the
light sources and walls, thus limiting the flow measurement in these regions. Moreover, the measurement space
of a normal stereo CSPSV is still limited by the finite camera resolutions.

By reviewing the literature above, it can be concluded that the existing airflow measure methods failed to satisfy
the demand of complex and large-scale airflow measurements such as the flow field induced by a ceiling fan.
In this study, a novel quad-view CSPSV technology was developed for ceiling fan airflow measurement in room

        Building and Environment, April 2019, 152, 122-134   3         https://doi.org/10.1016/j.buildenv.2019.02.015
                                                                           https://escholarship.org/uc/item/2v88v264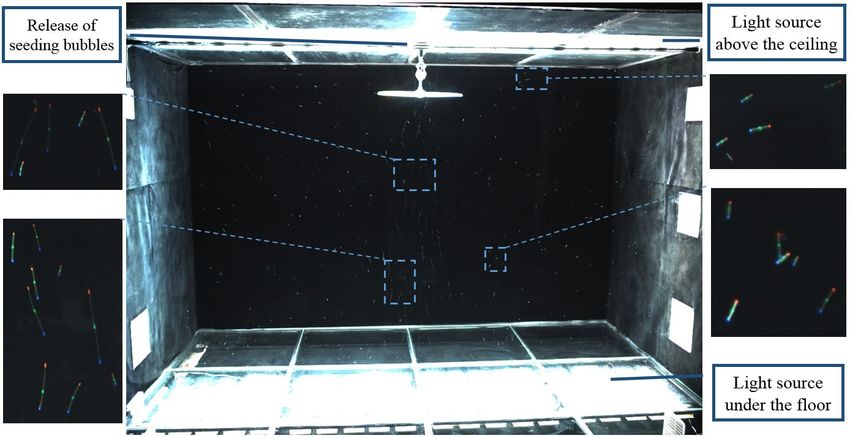
scale using two pairs of high-resolution cameras. The system contains four cameras and can arithmetically
merge the data captured by two or more pairs of cameras. To the best of our knowledge, the current indoor
airflow measurement zone size (4 m × 2.5 m × 0.8 m in width × height × depth) is the largest size that has been
built. Its successful experience can be used easily for even larger measuring zones and for complex and large-
scale airflow measurements. Based on this technology progress, the room-size airflow patterns of a ceiling fan
were tested and analyzed to fill the missing gap in capturing the detailed characteristics of ceiling fan airflows.

2 Quad-view CSPSV

2.1 Principle of CSPSV

The basic idea of CSPSV [26] is to capture more information of the seeding bubbles’ trajectory by a novel
imaging method for image-based velocimetry with a colour sequence illumination system (CSIS). Synchronized
with cameras, the CSIS changes the bubbles’ appearance according to the time sequence and helps to record the
bubbles’ entire trajectories during exposure time with a start spot marked in red, a middle spot marked in green,
and an end spot marked in blue, all of which contain substantial time sequence information, as shown in Fig. 1.
Such colour-coded airflow movement information can be extracted by a digital image processing algorithm and
bring in advantages in two aspects: firstly, with the known movement direction and displacement of individual
seeding particle, the extrapolation tracking is not required; secondly, three colour spots with strict time sequence
can further help the reconstruction of the 3D trajectory with improved streak pair match algorithm [27].
                                                   Red
                                                   Green

                                       Color
                                      Sequence
                                    Illumination
                                       system
                                                   Blue
                                                   White
                                                   Shutter

                                                             Time

                                        Bubble's
                                         instant
                                       apperance

                                         Camera
                                         Sensor

                           Fig. 1 Operating model of high performance CSPSV [27]
The whole operation process is illustrated in Fig. 2. A commercially available bubble generator [28] seeds the
test space with helium-filled soap bubbles (HFSB) and visualizes the airflow. Synchronized with the CSIS,
stereo colour cameras operate at a long exposure time to record the bubbles’ path and provide raw images for
        Building and Environment, April 2019, 152, 122-134      4      https://doi.org/10.1016/j.buildenv.2019.02.015
                                                                           https://escholarship.org/uc/item/2v88v264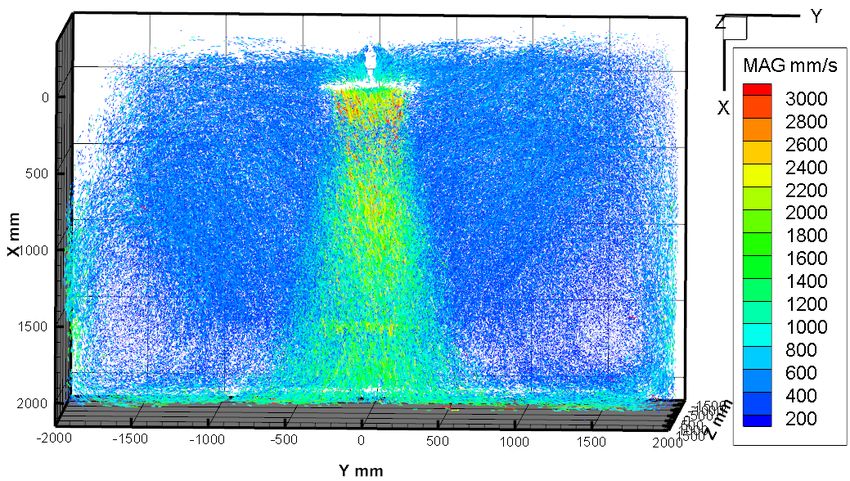
further processing. As the raw images in Fig. 2, the streaks have different length due to different speed and each
streak has a red start spot, a green middle spot and a blue end spot. The time sequence information of the image
is extracted with an image processing algorithm and represented with two linking vectors on the raw image.
Subsequently, a rectification-based 3D reconstruction algorithm with the calibration data calculates the 3D
position of the bubbles’ path in a 3D space within a certain time period. Thus, the 3D velocity is captured [27].
                                       Synchronizer      RAW image                      2D Vectors

                      CSIS
                                                                        Image
                                                                     information                                                 3D Vectors
Test                                                                  extraction
                                         Cameras
Zone
                                                                                                             3D
                                                                                                        reconstruction

                                                                        Image
                      Seeding                                        information
 Bubble                                                               extraction
                      Bubbles
Generator

                                                                     Calibration data

                                            Fig.2 Flow chart of CSPSV
The verification of CSPSV with a regular principal instrument, e.g., the HWA [27], and known moving objects
have confirmed its accuracy [26]. For moving objects verification, which is adopted by most visual based
velocimetry, the relative error in most cases was less than 5% with the magnitude velocity ranges from 0.12~2.45
m/s. The test of the vortex flow has proven its capability at measuring complex flows and real-site large-room
airflows [27].

2.2 Quad-view CSPSV

The primary drawback of CSPSV with two cameras or a stereo CSPSV is the blind zone as shown in Fig. 3. To
illuminate the whole room with little effect, a light source is placed both on the top of the ceiling and under the
transparent glass floor, projecting toward each other. This type of setup causes two bright zones on the ceiling
and the floor marked in purple. When looking out of the chamber, these regions are over-exposed and can hardly
record any bubbles’ trajectory, thus causing a blind zone for each camera set. The blind zone varies with the
direction of the camera set. As in Fig. 3, the blind zone of upper camera set is marked blue; that of the lower
camera set, orange; and the zone that can be captured by both camera sets, green. The view angles are presented
with a dashed line that can facilitate the understanding of the effects of area overexposure caused by a light
source.

As mentioned above, the measurement zone of a stereo CSPSV is always affected by over-exposed regions.
While the flow could be crucial near light sources, one method to obtain a wider measurement space is to use
more cameras to capture the movement from different angles and merge the measurement data together. In this
study, a new quad-view CSPSV is proposed with four cameras that are set into two groups and operated
synchronously. The upper cameras are primarily used to capture the air movements near the ceiling while the
lower cameras primarily target the air movements near the floor.

            Building and Environment, April 2019, 152, 122-134        5                      https://doi.org/10.1016/j.buildenv.2019.02.015
                                                                                                 https://escholarship.org/uc/item/2v88v264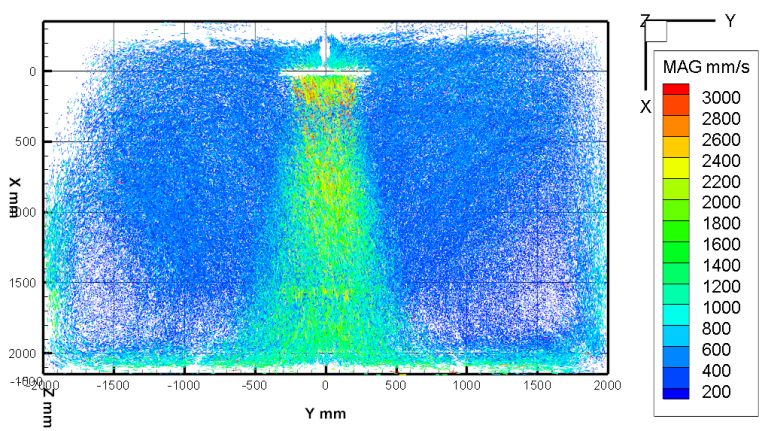
Light source           Ceiling

                                                                                                                         Upper cameras

                            Light source                                                                                 Lower cameras
                                                     Floor

                    Blind zone of                     Blind zone of                      Measurement zone
                  Upper camera set                  Lower camera set                   captured by both sets

                        Fig. 3 Comparison for blind zone captured by two pair of cameras
With these settings, both camera sets can capture the airflow in the middle of the room. If the results are simply
added together, some vectors will become duplicated. To solve this problem, a data merge algorithm is designed
as in Fig. 4. The streaks information from each camera set is reconstructed separately. Subsequently, the distance
between each pair of 3D vectors in 3D spaces was calculated, which consists of two vectors from the same
frame but in different sets, as in equation 1.

    D=     ( X 1s − X 2 s ) 2 + ( X 1e − X 2 e ) 2 + (Y 1s − Y 2 s ) 2 + (Y 1e − Y 2 e ) 2 + ( Z 1s − Z 2 s ) 2 + ( Z 1e − Z 2 e ) 2     (1)

where X, Y, Z is the position of the vector in a 3D space; the subscripts s and e represent the start and end points
of the vector; subscripts 1 and 2 are for the vectors from the upper camera set and lower camera set, respectively.
When the distance between two streaks are extremely close, the streak with a larger epipolar error is rejected.
The distance threshold here is set to 20mm in this study. With this algorithm, the vectors captured by two camera
sets can be merged together for a wider measurement space.
                       Camera 1                    Camera 2                    Camera 3                      Camera 4
                        Frame i                    Frame i                      Frame i                       Frame i

                   C1 Streaks 2D               C2 Streaks 2D                C3 Streaks 2D                C4 Streaks 2D

      Caliberation               3D streak                                                  3D streak                   Caliberation
       Data C1,C2              reconstruction                                             reconstruction                 Data C3,C4

                                   3D Streaks captured                  3D Streaks captured
                                      By C1, and C2                        By C3, and C4
                                                          Delete duplicate
                                                             3D streaks

                                                   3D Streaks captured by C1,
                                                         C2, C3, and C4
                                          Fig. 4 Results algorithm from four cameras

         Building and Environment, April 2019, 152, 122-134          6                  https://doi.org/10.1016/j.buildenv.2019.02.015
                                                                                            https://escholarship.org/uc/item/2v88v264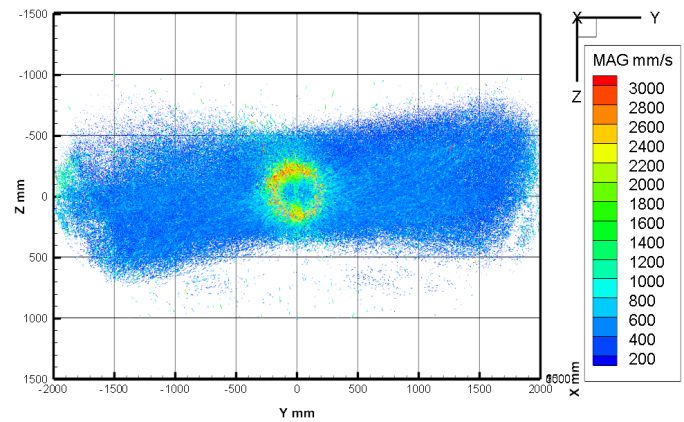
The new quad-view CSPSV combined the measurement results of two normal stereo CSPSVs. Therefore, the
measurement region is expanded, blind zone is minimized, and high accuracy of each stereo CSPSV is preserved.
Compared with regular stereo PSV, CSPSV system modified the information gathering method by adding a
CSIS. By this way, CSPSV can overcome the streak mismatching problem of regular stereo PSV [23] which is
also the main reason for the large errors. CSPSV can achieve a large measurement zone of several cubic meter
with just two cameras. More cameras can help to solve the correspondence ambiguities, however, the common
view of two cameras is larger than that of three cameras [30], due to the over exposure area caused by light
source and background, especially when the measurement zone is nearly the boundary. Although PTV with at
least three cameras [31] can provide higher accuracy compared with CSPSV (1% vs 5%), the accuracy of
CSPSV is comparable and enough for indoor airflow pattern study. In addition, the arrangement of CSPSV is
much easier than that of PTV in real experiments. As mentioned above, the accuracy of CSPSV is good enough
for the measurement of indoor airflow. Although CSPSV can achieve a large measurement zone of several cubic
meter with two cameras, there are a lot of buildings with even larger space which cannot be covered by a pair
of cameras. Therefore, the expansion of more cameras mainly aims to enlarge measurement space. This system
can further accommodate more cameras to make up multiple-view CSPSV and conduct 3D3C measurements
for flow pattern in large space like stadium.

3 Experimental Design

3.1 Chamber setup

The experiment was conducted in the airflow visualization and measurement platform located at Tsinghua
University. The platform consists of a sealed chamber, four cameras, and illumination systems. The chamber is
4 m × 2.5 m × 3 m in width, height, and depth. Three surfaces (e.g., the ceiling, roof, and front-side wall) of the
chamber are made of high-transparency glass. To avoid the airflow field in the chamber from being blocked,
the cameras and lighting system were placed outside the chamber. In total, 40 lighting modules are located
above the ceiling and under the floor. They are placed on the length direction of the chamber from left to right,
creating an illumination zone that is also the airflow measurement zone sizes: 4 m × 2.5 m × 0.8 m in the middle
of the room. As the lighting modules are isolated from the chamber, the heat produced from them affects little
on the airflow field.

A normal fan with three plastic blades of diameter 60 cm was selected in our tests. It rotates at a constant speed
of 330 rounds per min (rpm). The power supply is 220-V AC, with a constant power consumption of 6.34 W.
The fan is fixed at 2.15 m above the floor, 0.35 m away from the ceiling, and in the middle of the room.

The seeding particles used were HFSBs produced by a commercially available bubble generator SAI Model 5
[28]. The diameter of the HFSB ranged from 1 to 3 mm and filled with helium, thus rendering the Stokes’
number less than 0.1. These bubbles were released from the top center of the ceiling over the fan, and a
complement diffuser was utilized to decelerate the bubble speed to 0.15 m/s, such that its effect on disturbing
the primary airflow field can be ignored.

The typical image with 50 ms exposure time during experiment is shown in Fig. 5. Some regions are partially
enlarged in the image for a better illustration. From Fig. 5, the streaks with different length and direction can
        Building and Environment, April 2019, 152, 122-134   7         https://doi.org/10.1016/j.buildenv.2019.02.015
                                                                           https://escholarship.org/uc/item/2v88v264
demonstrate the dramatic changes of airflow pattern between these regions and also indicate the effectiveness
of colour coded imaging.
Fig.5 Experimental setup and typical image of fan test.
3.2 Camera settings
To capture the flow character near the ceiling and floor, four high-resolution cameras (sp-20000c, Jai) with 35-
mm lens (F1.4, Zeiss) were utilized for different view angles, as shown in Fig. 6a. The cameras were located on
the transparent side out of the chamber. This setup was created primarily for two reasons: First, as the cameras
and data acquisition system produce heat, the influence of this equipment is negligible if they are placed out of
the chamber; second, with a longer distance between the target and camera, each camera can obtain an entire
view of the test chamber with a considerable depth of view. Hence, the bubbles in the illumination zone can be
captured and recorded clearly and undisturbed.
a) Setup of four cameras b) Location of cameras and chamber
Building and Environment, April 2019, 152, 122-134 8 https://doi.org/10.1016/j.buildenv.2019.02.015
https://escholarship.org/uc/item/2v88v264Fig. 6 Camera setup and relation with the chamber
As mentioned in a previous study [13], a fan-induced airflow demonstrates a large gradient between the jet core
and surrounding entrainment flow. In this study, two types of cases were set for different exposure times, as
shown in Table 1. A long-exposure-time case aims at the low-speed entrainment flow, while a short-exposure-
time case aims at the high-speed jet core region. In total, each camera captures 6000 frames of the bubble’s time
sequence image. During experiments CSIS was synchronized with camera and operate during the shutter period.
Table 1 Case setting
Exposure Sample Sample Time interval between
Cases Target
time Frames Frequency two colour flashes
Short exposure 50 ms Core jet 2700 10Hz 25ms
Long exposure 200 ms Entrainment 3300 4Hz 50ms
3.3 Data processing
After the images were captured, the time sequence information on the images was processed with the algorithms
mentioned in reference [27], and the 3D vectors were reconstructed and merged with the algorithm illustrated
in Section 2.2.
As the vectors are the 3D3Cs distributed in the space, they are interpolated into different grid sizes for further
calculation and analysis. In this study, uniform 20 mm grids was used to investigate the detailed airflow
characteristics and uniform 100 mm grids was used to investigate the turbulence intensity, since calculation of
turbulence intensity needs more vectors. To evaluate the turbulence level, the turbulent velocity fluctuation is
calculated using equation 2.
v ' = v2 (2)
where, v ' is the root-mean-square of the turbulent velocity fluctuations. Subsequently, the turbulence
intensity can be calculated using equation 3.
v'
TI = (3)
V
where V is the mean velocity.
As the airflow induced by the ceiling fan are swirling, the vorticity on different directions is also calculated for
a better understanding of this flow pattern. The equation is as follows:
∂v ∂u
ω=
z − (4)
∂x ∂y
∂w ∂v
ω=
x − (5)
∂y ∂z
where u is the velocity component in the X direction, v is the velocity component in the Y direction, and w is
Building and Environment, April 2019, 152, 122-134 9 https://doi.org/10.1016/j.buildenv.2019.02.015
https://escholarship.org/uc/item/2v88v264the velocity component in the Z direction. ω z can illustrate the swirling direction of flow in the XY plane, and
ω x can illustrate the swirling direction of flow in the horizontal plane. The raw data were reconstructed and
prepared with algorithm [27] written in C++ for the large calculation load, and a GUI was created with Qt 5.7
for a better interface. The result figures were plotted in Tecplot 360.
4 Results and Discussion
Quad-view CSPSV can provide detailed 3D velocity vectors field within the test space and can be illustrated as
air velocity vectors similar to the CFD simulation results. In this study, 417,671 vectors were reconstructed and
are presented in Fig. 7. These are raw results simply with the gross errors removed. For the convenience of
calibration and image processing, in this paper, the height of the chamber is presented as X axis, the width of
chamber is presented as Y axis and the depth of chamber is presented as Z axis. To interpret these figures, the
vectors demonstrate the airflow directions and the colour gradients represent the velocity magnitudes. Because
many vectors exist in the test zone and overlap with each other, the results were interpolated and sections were
used for better illustration and further analysis.
As shown by the marked orange and blue regions in Fig. 8, both the upper and lower cameras contributed to the
whole section measurement because they facilitated in capturing the airflow field near the ceiling and the floor
in each blind zone. This result proves the effectiveness of the proposed quad-view CSPSV.
The vectors disperse throughout in the space, except for the left upper corner. The primary reason could be the
door on the left side wall of the chamber, which changes the inner surface and causes the airflow in the chamber
to be twisted counter-clockwise. As shown in Fig. 9, this phenomenon is stronger on the left side but weaker on
the right side of the chamber.
Building and Environment, April 2019, 152, 122-134 10 https://doi.org/10.1016/j.buildenv.2019.02.015
https://escholarship.org/uc/item/2v88v264Fig. 7 Vectors induced by ceiling fan
Results of upper cameras
Chamber door
Results of lower cameras
Fig. 8 Front view of vectors Fig. 9 Top view of vectors
4.1 Flow pattern zones
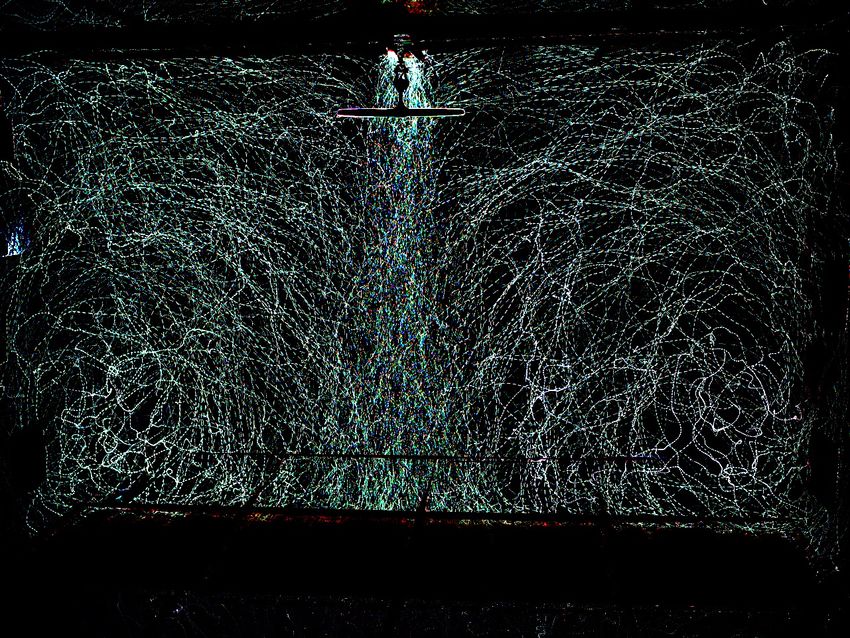
Besides the vector field, the raw images can also provide a lot of information about the flow pattern. Fig. 10
demonstrates the accumulated colour streaks of 200 images in the measurement zone under short exposure cases.
It is obtained by subtracting the raw image with the background to get the streaks in each image and then adding
them together. Fig. 10 can show the continuous trajectory of seeding bubbles during 20 seconds and from the
movements, two big vortex can be found located at lower part of the room and the main part of the room is
influenced by the fan jet.
Building and Environment, April 2019, 152, 122-134 11 https://doi.org/10.1016/j.buildenv.2019.02.015
https://escholarship.org/uc/item/2v88v264Fig.10 Accumulated colour streaks of 200 images in the measurement zone
To streamline the vector data interpretation, the results were interpolated with 20 mm grids with Inverse-
Distance Interpolation method [32] to investigate the detailed airflow characteristics in different regions. Fig.
11 shows the middle section from the front view of the chamber. As shown, the airflow induced by the ceiling
fan can be divided into six zones based on their flow patterns.
The jet core zone is located immediately under the fan blades, and the airflow has the highest speed and is the
primary momentum of room circulation. The jet has the highest speed at its boundary and expand slowly along
its path. The suction zone is located above the fan blades. As the speed of the convergent flow decays rapidly
and the fan is fixed sufficiently far from the ceiling, the suction zone is not large and appears symmetrical. The
spreading zone is near the floor where the jet impinges the floor; this layer is relatively thin while the speed is
higher than 1 m/s. When the spreading airflow reaches the wall, the direction changes to vertical and decelerates
gradually. Between the spreading zone and wall zone, the recirculation zones are marked with triangular frames
on both sides. The recirculation flow zones are surrounded by the entrainment flow, recirculation flow, and wall
flow, while the vortex flow follows the change in direction of these flows. The entrainment zone is primarily
induced by the jet core. The entrainment zone occupies the largest space in the chamber with an evenly low air
speed, and the boundary between the jet core and entrainment flow is sharp and clear. These characters convey
the complexity of the flow pattern induced by the ceiling fan and can facilitate in the better understanding and
utilization of ceiling fans in an indoor environment.
Suction Zone Entrainment Zone
Spreading Zone Jet Core Zone Recirculation Zone Wall Zone
Fig. 11 Velocity distribution on the middle section of fan-induced airflow
4.2 Turbulence Intensity and Vorticity
The raw data can be further mapped into a grid of size 100 mm × 100 mm × 100 mm to calculate the turbulence
Building and Environment, April 2019, 152, 122-134 12 https://doi.org/10.1016/j.buildenv.2019.02.015
https://escholarship.org/uc/item/2v88v264intensity (TI) level. As shown in Fig. 12, the zone under the fan blade tip has a much higher TI level while the
center of the fan has relatively lower TI values. The edge of the jet core zone has TI levels of 50–75% but the
TI values in the center part of the core zone are between 15–35%. From the view of the entire space, the TI
levels are higher in the bottom part but lower the in upper part especially when close to the ceiling and walls.
The overall averaged TI is approximately 40% and is much larger than regular airflow turbulence in regular
rooms [33].
Fig. 12 Turbulence intensity distribution in the middle section of fan-induced airflow
Because the vector field is of high density and 3D3C, the vorticity can be calculated for the better understanding
of the swirling direction of airflows, which can hardly be conducted with regular measurement instruments in
this scale. Fig. 13 demonstrates the vorticity ω z in the middle section, which is calculated with equation 4,
and illustrates the swirling direction of flow on the XY plane. The colour legend on the right side represents the
swirling direction of the airflow on the XY plane. Red means the airflow swirls in the clock-wise direction while
blue means the airflow swirls in the anticlockwise direction. It can be found the airflow under the fan blades
swirl to different directions. The two edges of the jet core zone exhibit higher but opposite directions of ω z
vorticity, thus demonstrating the highest speed flow caused by the fan blade on each side swirl to opposite
directions. Meanwhile, in the center region of the fan, counter direction swirling flows exist that may be caused
by the difference in rotation speed along the radius of the fan blades.
Building and Environment, April 2019, 152, 122-134 13 https://doi.org/10.1016/j.buildenv.2019.02.015
https://escholarship.org/uc/item/2v88v264(1/s)
Fig. 13 Vorticity ω z in the middle section of the fan-induced airflow
Fig. 14 demonstrates the vorticity ω x , which is calculated with equation 5, to better illustrate the swirling
direction of the airflow in the horizontal plane. The almost continuous blue region means the airflow swirl with
the same direction of the fan blade, and this phenomenon becomes gradually inconspicuous beyond a three
diameter length from the fan blade. However, in other regions, the swirling phenomenon is not evident.
(1/s)
Fig. 14 Vorticity ω x in the middle section of the fan-induced airflow
Building and Environment, April 2019, 152, 122-134 14 https://doi.org/10.1016/j.buildenv.2019.02.015
https://escholarship.org/uc/item/2v88v2644.3 Jet core zone
Unlike the normal jet promoted by pressure difference, fan jet is propelled by the rotation of fan blades, which
produces its own characteristics. The detailed velocity field is further illustrated and studied below. As shown
in Fig. 15, the peak airspeed immediately below the fan occurs at 1/3 of the fan blade radius. The highest speed
regions only constitute a small portion of the jet core and the gradient of the speed difference is large and
becomes diluted with its path. The diameter of the jet flow narrowed slightly at first and subsequently expands
gradually. The jet flow also swirls at the same rotation direction with the fan blades, as shown in Fig. 16. The
vertical planes are at 5 cm, 30 cm, 60 cm, 90 cm, 120 cm, 150 cm, and 180 cm from the fan’s blades. From the
vectors’ direction, it can be found that the rotation speed along the jet path decreases while the jet expands in a
larger space.
Fig. 15 Velocity contour through fan’s center Fig. 16 Vectors on different horizontal planes
To better illustrate the changes in the jet flow induced by the jet, slices of a velocity vector field were plotted at
different heights, as shown in Fig. 17 and discussed below. Fig. 17(a) demonstrates the airflow 10 cm above the
fan; it can be found that within the suction zone, when the airflow gathers from the surrounding to the fan blade
while at the center of the fan, the airspeed is low. Fig. 17(b) illustrates the high-speed swirling ring produced by
the fan blades more clearly. A clear high-speed vector ring can be found that has a narrower diameter than the
fan blades and rotates in the same direction. Around the jet core, the surrounding air is drawn towards the center.
Unlike a normal circular jet with the highest speed jet core located in the center of the flow, a fan jet exhibits
the highest speed region near the outer boundary of the jet. As shown in Figs. 17(b), (c), (d), and (e), within a
30 cm distance (semi-diameter of the fan blade) from the fan blades, the flow character does not change
significantly, thus proving the stability of this unique jet flow pattern.
When comparing Figs. 17(e) and (f), the high-speed region becomes diluted and the core region expands when
the distance goes further downward. With an even longer distance from the fan blades, the highest speed
decreases. The diameter of the jet core extends to the same diameter of the fan blade below 60 cm, as shown in
Building and Environment, April 2019, 152, 122-134 15 https://doi.org/10.1016/j.buildenv.2019.02.015
https://escholarship.org/uc/item/2v88v264Fig. 17(h).
The high-speed ring becomes even diluted with a longer distance, as shown in Figs. 17(i), (j), (k), and (l). When
the fan jet reaches two times its diameter, as shown in Fig. 17(m), the high-speed ring almost disappeared. The
jet center also has the largest speed and the entire jet region is swirling, as shown in Fig. 17(n). When the jet
travels even further as shown in Fig. 17(o), the jet velocity becomes uniform. However, swirling still exists even
when it is three-times-diameter away from the fan blades and the speed is lower than 1.5 m/s, as shown in Fig.
17(p).
(a) 10 cm above the fan blades (b) 5 cm below the fan blades
(c) 10 cm below the fan blades (d) 20 cm below the fan blades
(e) 30 cm below the fan blades (f) 40 cm below the fan blades
(g) 50 cm below the fan blades (h) 60 cm below the fan blades
Building and Environment, April 2019, 152, 122-134 16 https://doi.org/10.1016/j.buildenv.2019.02.015
https://escholarship.org/uc/item/2v88v264(i) 70 cm below the fan blades (j) 80 cm below the fan blades
(k) 90 cm below the fan blades (l) 100 cm below the fan blades
(m) 120 cm below the fan blades (n) 140 cm below the fan blades
(o) 160 cm below the fan blades (p) 180 cm below the fan blades
Fig. 17 Vector field at different heights
Based on the information provided by quad-view CSPSV, the latter can be a more promising method for ceiling-
fan-induced airflow measurements.
4.4 Discussion
Compared with other jet flows, a ceiling-fan-induced jet has its unique characteristics as follows: 1) A ceiling
fan jet swirls along its path in the same direction as the fan blades; the swirling speed is faster at the beginning
Building and Environment, April 2019, 152, 122-134 17 https://doi.org/10.1016/j.buildenv.2019.02.015
https://escholarship.org/uc/item/2v88v264and this phenomenon lasts for three diameters away downward the fan blades. 2) The highest speed of the
airflow is located at the surrounding area of the core jet and the velocity difference is diluted within the core jet
after three diameters away downward the fan blades. 3) The jet induced by the ceiling fan will slightly shrink
immediately after the blades and expand at a low speed. As normal ceiling fans have large diameters, the jet is
always at early stage and expands little in the room, implying that the entrainment zone is the primary factor for
room circulation.
Based on the characteristics mentioned above, a ceiling fan is more suitable for creating a uniform indoor
environment, and can increase the total turbulence and reduce the sensible temperature. Its advantages can be
summarized in three aspects. First, ceiling fans are primarily installed on the roof and their high-speed jet region
expands slowly, with little disturbance to the indoor occupied zone. Next, the diameter of the ceiling fan blade
can reach approximately 7 m; ceiling fans exhibit unique advantages in large spaces such as shopping malls,
factories, and breeding grounds. Richard Aynsley’s research [34] shows that the larger the ceiling fan and the
slower the rotating speed, the higher is the energy efficiency with the same airflow cooling effect in the same
room area. Subsequently, in the heating season, the ceiling fan can also significantly reduce the indoor vertical
temperature difference, which can yield a 30% energy reduction effect. Further, it is noteworthy that a ceiling
fan increases the air velocity near the floor in the spreading zone, and may cause drafts near the ankles. Therefore,
when utilizing a ceiling fan, the air velocity in the spreading zone should also be considered.
5 Conclusion
In this study, a novel quad-view CSPSV feasible for a large-space full zone test was developed according to the
problem in ceiling fan measurement. The system comprised two pairs of camera settings near the roof and near
the floor respective. After reconstructing the vectors from each camera pair, the airflow vectors were merged to
fill the blind zone near the ceiling and floor and capture the room-scale flow field. With this equipment, the
room-scale airflow induced by the ceiling fan was tested and studied with the enrich data. Some conclusions
drawn from this study are as follows.
Quad-view CSPSV could be used in a large measurement zone of 4 m × 2.5 m × 0.8 m in width, height, and
depth, as well as a detailed 3D3C vector field. In this study, 417,671 vectors were captured and the vorticity
requiring rich vectors of high space resolution were calculated in addition to the regular averaged velocity vector
and TI. The airflow patterns of the ceiling fan were analyzed based on the data. This system enabled the
comprehensive airflow pattern measurement of complex flows, such as ceiling fans.
According to the averaged flow velocity and TI, the ceiling-fan-induced airflow field can be divided into six
zones, i.e., a jet core zone, suction zone, spreading zone, wall zone, recirculation zone, and entrainment zone.
The fan blade tips produced the highest TI. Based on the vorticity, the flow under the ceiling fan swirled along
its path with the same rotation direction of the fan blades and decelerated gradually. The peak speed of the
airflow under the fan blades occurred at 1/3 of the fan blade radius. The highest speed airflow was located
outside the core jet, and the velocity difference diluted within the core jet after two diameters away from the fan
blade. The entrainment zone of the fan jet was small, and the flow pattern of the room was primarily dominated
by the circulation flow with a higher TI. The ceiling fan increased the air velocity near the floor in the spreading
zone; this may cause drafts near the ankle and should be considered carefully.
Building and Environment, April 2019, 152, 122-134 18 https://doi.org/10.1016/j.buildenv.2019.02.015
https://escholarship.org/uc/item/2v88v2646 Acknowledgments
The authors gratefully acknowledge the support from the China National Key R&D Program (Grant No.
2018YFC0705201), National Natural Science Foundation of China (Grant No. 51521005), Initiative Postdocs
Supporting Program, and the help of Prof. Hui Zhang from the University of California, Berkeley, USA and
Foreign Professor Shinsuke Kato from Tsinghua University.
7 Reference
[1] L. Pérez-Lombard, J. Ortiz, C. Pout, A review on buildings energy consumption information, Energy Build. 40 (2008)
394–398. doi:10.1016/j.enbuild.2007.03.007.
[2] K. Voss, T. Voß, J. Otto, Investigation of ceiling fans for improving summer thermal comfort., in: 2nd Cent. Eur. Symp.,
Vienna, 2013.
[3] P Hope, Energy efficiency ratings: Implications for the building industry in the humid tropics, Master in Tropical
Architecture dissertation, Australian Institute of Tropical Architecture, James Cook University, Townsville, Australia.
(2003) 359 pp.
[4] E. Arens, S. Turner, H. Zhang, G. Paliaga, Moving air for comfort, ASHRAE J. 51 (2009) 8–18.
[5] S. Schiavon, A.K. Melikov, Energy saving and improved comfort by increased air movement, Energy Build. 40 (2008)
1954–1960. doi:10.1016/j.enbuild.2008.05.001.
[6] Y. Zhu, M. Luo, Q. Ouyang, L. Huang, B. Cao, Dynamic characteristics and comfort assessment of airflows in indoor
environments: A review, Build. Environ. 91 (2015) 5–14. doi:10.1016/j.buildenv.2015.03.032.
[7] J. Han, G. Zhang, Q. Zhang, J. Zhang, J. Liu, L. Tian, C. Zheng, J. Hao, J. Lin, Y. Liu,D.J. Moschandreasa, Field study
on occupants’ thermal comfort and residential thermal environment in a hot-humid climate of China, Journal of Building
and Environment 42 (2007) 4043–4050.
[8] W. Yang, G. Zhang, Thermal comfort in naturally ventilated and air-conditioned buildings in humid subtropical climate
zone in China, International Journal of Biometeorology 52 (5) (2008) 385–398.
[9] R.L. Hwang, K.H. Yang, P.C. Chen, S.T. Wang, Subjective responses and comfort reception in transitional spaces for
guests versus staff, Journal of Building and Environment 43 (12) (2008) 2013–2021.
[10] S. Wijesuriya, M. Brandt, P.C. Tabares-Velasco, Parametric analysis of a residential building with phase change
material (PCM)-enhanced drywall, precooling, and variable electric rates in a hot and dry climate, Appl. Energy. 222 (2018)
497–514. doi:10.1016/j.apenergy.2018.03.119.
[11] S. Zhu, J. Srebric, S.N. Rudnick, R.L. Vincent, E.A. Nardell, Numerical modeling of indoor environment with a ceiling
fan and an upper-room ultraviolet germicidal irradiation system, Build. Environ. 72 (2014) 116–124.
doi:10.1016/j.buildenv.2013.10.019.
[12] N. Wakamatsu, Y. Momoi, T. Yamanaka, K. Sagara, H. Kotani, Improvement of Temperatures Stratification caused by
Air-conditioner by means of Ceiling Fan in Classroom, in: Proc. 31st AIVC Conf. 2010, A-2, 2010.
[13] S. Liu, A. Lipczynska, S. Schiavon, E. Arens, Detailed experimental investigation of air speed field induced by ceiling
fans, Build. Environ. 142 (2018) 342–360, https://doi.org/10.1016/j.buildenv.2018.06.037.
[14] H. Chiang, C. Pan, H. Wu, B. Yang, Measurement of flow characteristics of a ceiling fan with varying rotational speed,
in: Proc. Clima 2007 WellBeing Indoors, 2007.
[15] Y. Gao, H. Zhang, E. Arens, E. Present, B. Ning, Y. Zhai, J. Pantelic, M. Luo, L. Zhao, P. Raftery, S. Liu, Ceiling fan
air speeds around desks and office partitions, Build. Environ. 124 (2017) 412–440. doi:10.1016/j.buildenv.2017.08.029.
[16] F. Babich, M. Cook, D. Loveday, R. Rawal, Y. Shukla, Transient three-dimensional CFD modelling of ceiling fans,
Building and Environment, April 2019, 152, 122-134 19 https://doi.org/10.1016/j.buildenv.2019.02.015
https://escholarship.org/uc/item/2v88v264Build. Environ. 123 (2017) 37–49. doi:10.1016/j.buildenv.2017.06.039.
[17] W. Chen, S. Liu, Y. Gao, H. Zhang, E. Arens, L. Zhao, J. Liu, Experimental and numerical investigations of indoor air
movement distribution with an office ceiling fan, Build. Environ. 130 (2018) 14–26. doi:10.1016/j.buildenv.2017.12.016.
[18] R. Bassiouny, N.S. Korah, Studying the features of air flow induced by a room ceiling-fan, Energy Build. 43 (2011)
1913–1918. doi:10.1016/j.enbuild.2011.03.034.
[19] A. Jain, R.R. Upadhyay, S. Chandra, M. Saini, S. Kale, Experimental Investigation of the Flow Field of a Ceiling Fan,
2004, pp. 93–99 Charlotte, North Carolina USA https://doi.org/10.1115/HT-FED2004-56226.
[20] R.J. Adrian, Twenty years of particle image velocimetry, Exp. Fluids. 39 (2005) 159–169. doi:10.1007/s00348-005-
0991-7.
[21] F. Scholzen, A. Moser, Three-dimensional particle streak velocimetry for room air flows with automatic stereo-
photogrammetric image processing, in: ROOMVENT Int. Conf., Yokohama, Japan, 1996: pp. 555–562.
[22] D. Müller, B. Müller, U. Renz, Three-dimensional particle-streak tracking (PST) velocity measurements of a heat
exchanger inlet flow, Exp. Fluids. 30 (2001) 645–656. doi:10.1007/s003480000242.
[23] Y. Sun, Volumetric Particle Streak-tracking Velocimetry and its Application in Indoor Airflow Measurements,
University of Illinois at Urbana-Champaign, 2007.
[24] M. Machacek, A Quantitative Visualization Tool for Large Wind Tunnel Experiments, ETH zürich, 2002.
[25] M. Rosenstiel, R.-R. Grigat, Segmentation and classification of streaks in a large-scale particle streak tracking system,
Flow Meas. Instrum. 21 (2010) 1–7. doi:10.1016/j.flowmeasinst.2009.10.001.
[26] H. Wang, X. Li, X. Shao, B. Wang, Y. Lin, A colour-sequence enhanced particle streak velocimetry method for air
flow measurement in a ventilated space, Build. Environ. 112 (2017) 77–87. doi:10.1016/j.buildenv.2016.11.015.
[27] H. Wang, G. Wang, X. Li, High-performance colour sequence particle streak velocimetry for 3D airflow measurement,
Appl. Opt. 57 (2018) 1518–1523. doi:10.1364/AO.57.001518.
[28] Anonymous, SAI Bubble Generator: Description and Operating Instructions, New York: Sage, 1988.
[29] P.H. Biwole, Large Scale Particle Tracking Velocimetry for 3-Dimensional Indoor Airflow Study, National Institute
of Applied Sciences of Lyon, 2009.
[30] W. Yan, Development of Hybrid Particle Tracking Algorithms and Their Applications in Airflow Measurement Within
an Aircraft Cabin Mock-Up, University of Illinois at Urbana-Champaign, 2010.
[31] D.X. Li, Q.S. Lin, Q. Zhong, X.K. Wang, Bias errors induced by concentration gradient in sediment-laden flow
measurement with PTV, J. Hydrodyn. 24 (2012) 668–674. doi:10.1016/S1001-6058(11)60290-4.
[32] Tecplot, User’s Manual, (2018) 326–328. http://download.tecplot.com/360/current/360_users_manual.pdf.
[33] M. Sandberg, Whole-Field Measuring Methods in Ventilated Rooms, HVACR Res. 13 (2007) 951–970.
doi:10.1080/10789669.2007.10391464.
[34] R. Aynsley, How much do you need to know to effectively utilize large ceiling fans?, Archit. Sci. Rev. 55 (2012) 15–
25. doi:10.1080/00038628.2011.641737.
Building and Environment, April 2019, 152, 122-134 20 https://doi.org/10.1016/j.buildenv.2019.02.015
https://escholarship.org/uc/item/2v88v264You can also read