Plasma fetal bile acids 7α hydroxy 3 oxochol 4 en 24 oic acid and 3 oxachola 4,6 dien 24 oic acid indicate severity of liver cirrhosis - Nature
←
→
Page content transcription
If your browser does not render page correctly, please read the page content below
www.nature.com/scientificreports
OPEN Plasma fetal bile acids
7α‑hydroxy‑3‑oxochol‑4‑en‑24‑oic
acid and 3‑oxachola‑4,6‑dien‑24‑oic
acid indicate severity of liver
cirrhosis
Tudor Mocan1,6, Dong Wook Kang2,6, Billy J. Molloy3,6, Hyeonho Jeon2, Zeno A. Spârchez1,
Diren Beyoğlu4 & Jeffrey R. Idle4,5*
Two 3-oxo-Δ4 fetal bile acids, 3-oxachola-4,6-dien-24-oic acid (1) and 7α-hydroxy-3-oxochol-4-en-
24-oic acid (2), occur normally in the human fetus but remain elevated in neonates and children with
severe cholestatic liver disease due to an autosomal recessive inborn error of metabolism affecting
Δ4-3-oxo-steroid 5β-reductase (AKR1D1). Relatively little is known about 1 and 2 in adult patients
with liver disease. The chemical synthesis of 1 and 2 is therefore described and their quantitation in
plasma by ultrarapid chromatography-triple quadrupole mass spectrometry. Plasma concentrations of
1 and 2 were investigated in 25 adult patients with varying degrees of liver cirrhosis with and without
hepatocellular carcinoma (HCC). Highly statistically significant correlations (P < 0.0001) were found
between severity of liver cirrhosis, determined by the Child–Pugh and MELD scores, with plasma 1 and
2 concentrations, both alone and combined. The presence of HCC did not influence these correlations.
Plasma cholic, chenodeoxycholic, deoxycholic, lithocholic or ursodeoxycholic acids, free and as their
glycine or taurine conjugates, did not correlate with Child–Pugh or MELD score when corrected for
multiple comparisons. These findings demonstrate that plasma levels of fetal bile acids 3-oxachola-
4,6-dien-24-oic acid and 7α-hydroxy-3-oxochol-4-en-24-oic acid and likely deteriorating AKR1D1
activity indicate the severity of liver cirrhosis measured by the Child–Pugh and MELD scores.
Over recent decades, the global prevalence of liver disease has continuously risen until it is now one of the leading
causes of morbidity and mortality, with liver fibrosis, liver cirrhosis and progression to hepatocellular carcinoma
(HCC) on the rise1. In 2017, cirrhosis caused 440,000 deaths in females and 883,000 in males2. Despite the use of
vaccines and therapeutic agents to reduce hepatitis B and C virus infection that contribute to the burden of liver
disease, over-nutrition, obesity, metabolic syndrome and alcohol consumption have become principal causes of
liver disease2, 3. Hepatic fat overload (steatosis) occurs commonly and can progress to nonalcoholic steatohepa-
titis (NASH)4 and alcoholic steatohepatitis (ASH)5, in the case of excessive alcohol consumption. Liver disease
advances from stage to stage and therefore procedures have arisen for monitoring this progression with the aim of
reducing the incidence of end-stage liver disease and H CC4. One such strategy involves the search for biomarkers
indicative of disease stage. Mass spectrometry-based metabolomics has proven to be an excellent tool with which
to examine premalignant liver disease and its progression to H CC6. It had been reported that the two fetal bile
acids 3-oxachola-4,6-dien-24-oic acid (1) and 7α-hydroxy-3-oxochol-4-en-24-oic acid (2), known collectively
as 3-oxo-Δ4 bile acids, were elevated in p lasma7, 8 and u
rine8 of HCC patients relative to various control groups,
including patients with liver cirrhosis.
1
3rd Medical Clinic, Iuliu Hatieganu University of Medicine and Pharmacy, Cluj‑Napoca, Romania. 2Department
of Pharmaceutical Science and Technology, College of Health and Medical Science, Catholic University
of Daegu, Gyeongsan‑si, Gyeongsangbuk‑do 38430, Republic of Korea. 3Wilmslow SK9 4AX, Waters UK,
UK. 4Division of Systems Pharmacology and Pharmacogenomics, Samuel J. and Joan B. Williamson Institute,
Arnold and Marie Schwartz College of Pharmacy and Health Sciences, Long Island University, Brooklyn, NY 11201,
USA. 5Department of BioMedical Research, University of Bern, 3008 Bern, Switzerland. 6These authors contributed
equally: Tudor Mocan, Dong Wook Kang and Billy J. Molloy. *email: jeff.idle@liu.edu
Scientific Reports | (2021) 11:8298 | https://doi.org/10.1038/s41598-021-87921-5 1
Vol.:(0123456789)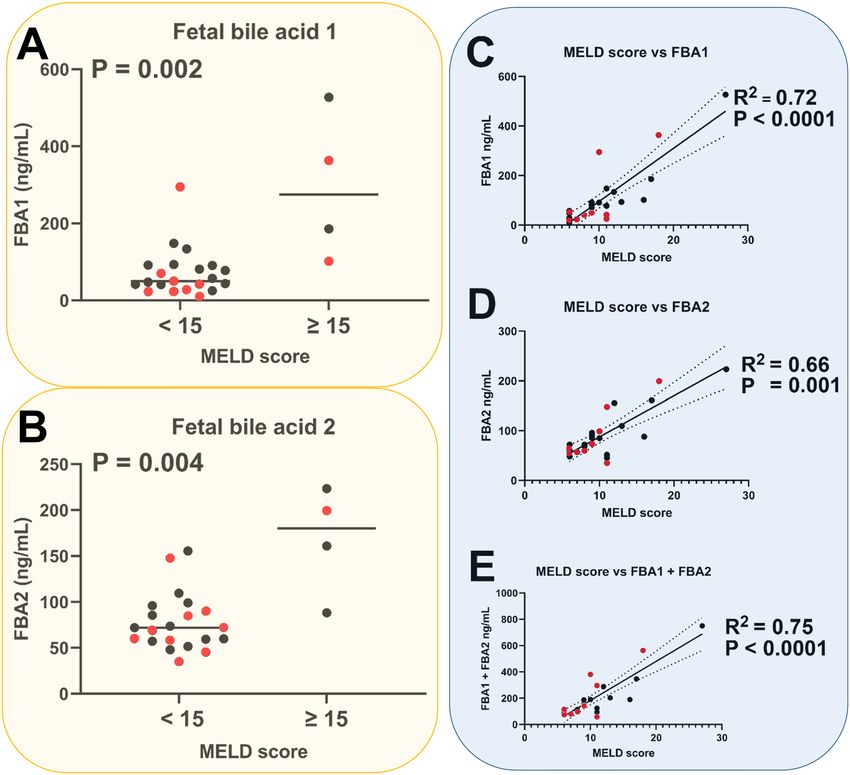
www.nature.com/scientificreports/
Figure 1. 7α-Hydroxy-cholest-4-en-3-one formed from 7α-hydroxycholesterol in the neutral bile acid synthesis
pathway and 7α-hydroxy-3-oxochol-4-en-24-oic acid (2) formed in the acidic bile acid synthesis pathway.
The excretion of 3-oxo-Δ4 bile acids normally attenuates within the first few days after birth9. Elevated 3-oxo-
Δ4 bile acids in neonates and children with severe cholestatic liver disease was at first interpreted as being due
to an autosomal recessive inborn error of metabolism that affected Δ4-3-oxo-steroid 5β-reductase10, 11 (now
known as AKR1D1). The augmentation of fetal bile acids 1 and 2 in urine of infants with hepatobiliary disease
was considered to indicate a poor prognosis12. It was also proposed that 3-oxo-Δ4-steroid-5β-reductase reduced
activity could have non-genetic origins, such as altered hepatocyte redox state or unusual sensitivity of the
enzyme to liver damage. Therefore, it was anticipated that 3-oxo-Δ4 bile acids could be expected to be found in
iseases10. This proposition has implications for the observation of 3-oxo-Δ4 bile acids in adult
other severe liver d
patients with liver disease.
The synthesis of bile acids from cholesterol proceeds via two alternative pathways, the first of which is the
classical “neutral” pathway involving cholesterol 7α-hydroxylation by CYP7A1 with only the final steps entail-
ing creation of the acidic side-chain and leading to cholic acid (CA) and chenodeoxycholic acid (CDCA). In
the alternative “acidic” pathway, formation of the acidic side-chain is the first step involving CYP27A1 that
finally leads to the synthesis of C DCA13. Figure 1 shows 7α-hydroxy-cholest-4-en-3-one that is formed from
7α-hydroxycholesterol in the neutral pathway and the fetal bile acid 7α-hydroxy-3-oxochol-4-en-24-oic acid
(2) that is formed in the acidic pathway. It is noteworthy that both these species are metabolized by AKR1D1
(Δ4-3-oxosteroid 5β-reductase)11, 13.
It has been reported that AKR1D1 hepatic expression in adults decreased with progression of steatosis, fibrosis
and inflammation and in type 2 diabetic patients14. Defective AKR1D1 activity results in elevated 3-oxo-Δ4 bile
acids in n eonates11. Whether or not this occurs in adults with liver disease is not known.
We wished to understand if plasma concentrations of 3-oxo-Δ4 bile acids could inform regarding the progres-
sion of liver cirrhosis to HCC. Because authentic standards of 1 and 2 are not readily available, we describe here
their chemical synthesis from chenodeoxycholic acid. Moreover, quantitation of 1 and 2 has hitherto be achieved
using gas chromatography-mass spectrometry (GC–MS) methodologies with complex sample preparation and
derivatization. We therefore describe a simple and rapid ultraperformance liquid chromatography-tandem mass
spectrometry (UPLC-TQMS) assay for these two fetal bile acids in order to promote further research in this
area. Importantly, we investigated 15 liver cirrhosis patients with severity measured by Child–Pugh scores15 of
5–15 (A-C) together with ten cirrhotic patients with HCC and Child–Pugh scores of 5–11. Using the UPLC-
TQMS assay based upon authentic standards for 1 and 2, the concentration of these fetal bile acids together
with 15 conjugated and free primary and secondary bile acids was determined in plasma from these 25 patients.
The findings indicate that plasma fetal bile acids 1 and 2, but not the common bile acids, increase statistically
significantly with mounting severity of cirrhosis.
Results
Twenty-five patients with LC, comprising 10 with HCC and 15 without, were investigated. The severity of cirrho-
sis was represented across the full range of Child–Pugh s cores16 from 5 to 15 in these patients. Clinical details of
the ten HCC and 15 LC patients are given in Tables 1 and 2, respectively. Table 3 shows a comparison of clinical
data between LC and HCC patients. No confounders were apparent from these data. Of note is the observation
that both fetal bile acids 1 and 2 were detected and quantitated in plasma from all 25 cirrhotic patients. In the
current investigation, all 25 patients investigated had varying degrees of LC. Examination of their plasma by
UPLC-QTOFMS yielded concentrations of fetal bile acids 1 and 2 and we analyzed the findings in relation to
both Child–Pugh classes A, B and C together with the Child–Pugh scores from 5 to 15, which represent the
severity of the cirrhosis16. Figure 2 displays the relationships between Child–Pugh class and score with plasma
concentrations of fetal bile acids 1 and 2. Comparison between Child–Pugh A and Child–Pugh B/C for all cir-
rhotic patients with and without HCC revealed statistically significant differences for the plasma concentrations
Scientific Reports | (2021) 11:8298 | https://doi.org/10.1038/s41598-021-87921-5 2
Vol:.(1234567890)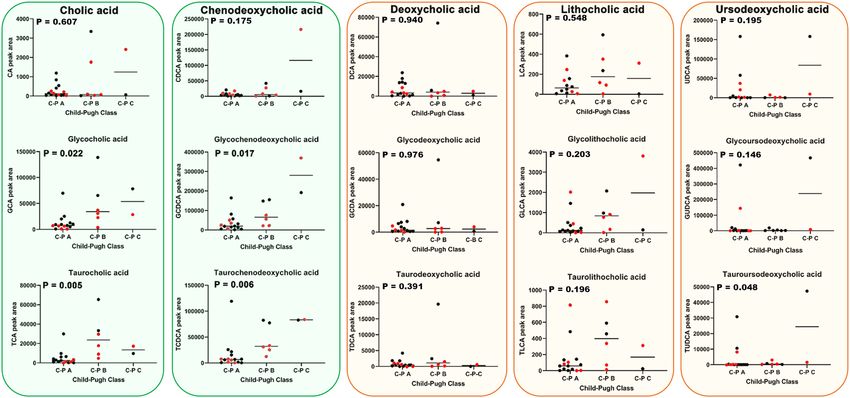
www.nature.com/scientificreports/
Patient Sex Age (years) Etiology CT/MRI Tumor number Tumor size (mm) EV Asc Enc BCLC C-P AFP Bili Alb
HBV/
1 M 67 HCC/CAC 1 56 No No No C 5 5.5 1.3 3.9
Eth
2 M 68 Eth HCC 3 50, 26, 12 No Grade I Yes B 8 8.0 3.8 3.0
3 M 66 Eth HCC 7 – No Grade I No B 7 3.7 2 3.5
HBV/
4 M 47 HCC 2 32/27, 12 No No No A 5 42 1.1 4.4
HDV
5 F 79 HCV HCC 2 36, 15 Grade II No No A 7 33 2.1 3.4
6 F 73 HCV HCC 1 45 No No No A 5 > 400 0.8 4.2
7 M 66 HBV HCC/Mets 2 25, 15 No No No A 5 9.3 1.4 2.5
HBV/
8 M 60 HCC 2 18, 17 Grade II Grade II Yes A 11 381 3.8 2.3
HDV
9 F 81 HCV HCC 1 81 No Grade I No B 9 8.6 3.7 3.0
10 M 47 HC HCC 1 57 No No No B 5 5.6 0.6 4.3
Table 1. Hepatocellular carcinoma patient details. HBV hepatitis B virus, Eth ethanol,, HDV hepatitis D virus,
HCV hepatitis C virus, HC hemochromatosis, HCC hepatocellular carcinoma, CACcholangiocarcinoma; Mets,
metastases, EV esophageal varices, Asc ascites, Enc encephalopathy, BCLC Barcelona clinic liver cancer staging,
C-P Child–Pugh score, AFP alpha-fetoprotein (ng/mL), Bili total bilirubin (mg/dL), Alb albumin (g/dL), UK
unknown, Dysp Nod dysplastic nodules.
Patient Sex Age (year) Etiology CT/MRI Tumor number EV Asc Enc C-P AFP Bili Alb
11 M 57 Eth No 0 Grade I Grade I No 6 4.2 1.8 4.4
12 M 63 HBV No 0 Grade I with bleeding Grade I Yes 9 9.8 4.0 3.7
13 M 46 HCV No 0 No No No 5 6.4 1.1 5.3
14 M 69 UK No 0 Grade I Grade I No 6 ? 1.1 3.6
15 F 60 Eth No 0 No No No 5 ? 1.2 3.9
16 M 73 Eth No 0 No No No 5 2.4 2.2 4.0
17 M 50 HCV Dysp Nod 2 Grade I No Yes 6 42.6 0.8 4.4
18 M 59 Eth + HBV Dysp Nod Multiple Grade II with bleeding Grade III Yes 15 1.5 5.3 2.0
19 M 50 HCV No 0 Grade I No Yes 6 ? 1.4 4.5
20 F 59 Eth + HCV No 0 No No No 5 2.7 1.1 5.3
21 M 56 HBV Yes 0 Grade I No Yes 7 4.5 2.3 4.1
22 M 46 HCV No 0 No No No 5 ? 0.8 4.8
23 M 77 HCV Yes 0 Grade I No Yes 6 ? 1.0 4.2
24 F 53 HCV No 0 Grade I No Yes 6 23.1 1.5 3.8
25 M 80 Eth No 0 No No No 5 ? 0.6 4.1
Table 2. Cirrhosis patient details. For abbreviations, see Table 1.
Variable LC HCC P value
Males/females 12/3 7/3 0.57
Age (years) 59.9 ± 10.7 65.4 ± 11.6 0.19
Albumin 4.14 ± 0.79 3.45 ± 0.75 0.04
AFP 10.8 ± 13.6 89.7 ± 159 0.11*
Total bilirubin 1.75 ± 1.30 2.06 ± 1.27 0.55
Thrombocytes 131,867 ± 54,014 122,900 ± 41,983 0.66
Glucose 113 ± 45 103 ± 21 0.49
AST 51.9 ± 34.9 104 ± 63 0.003*
ALT 50.3 ± 58.9 99.3 ± 89.5 0.003*
INR 1.32 ± 0.54 1.26 ± 0.20 0.74
Table 3. Comparison of clinical variables for liver cirrhosis (LC) and hepatocellular carcinoma (HCC)
patients. For continuous variables, mean ± standard deviation is given with comparisons made using
unpaired t tests. For categorical variables, comparisons were made using the chi-squared test. *Analyzed by
nonparametric Mann Whitney U test due to non-Gaussian distribution of data.
Scientific Reports | (2021) 11:8298 | https://doi.org/10.1038/s41598-021-87921-5 3
Vol.:(0123456789)www.nature.com/scientificreports/
Figure 2. Statistically significant relationship (nonparametric Kruskal–Wallis test) between Child–Pugh
class and (A) fetal bile acid 1 (FBA1) plasma concentration (ng/mL), (B) fetal bile acid 2 (FBA2) plasma
concentration (ng/mL) and statistically significant correlations (simple linear regression) between Child–Pugh
score and (C) FBA1 plasma concentration, (D) FBA2 plasma concentration and (E) the sum of FBA1 and FBA2
plasma concentrations. C-P mean Child–Pugh. Black symbols represent LC patients without HCC and red
symbols represent LC patients with HCC. Dotted lines represent 95% confidence intervals.
of both fetal bile acid 1 (median values 49 and 249, respectively; P < 0.0001) and fetal bile acid 2 (median values
70 and 161, respectively; P = 0.002).
As can be seen from these findings, plasma concentrations of both fetal bile acids correlated increased sig-
nificantly with severity of cirrhosis as measured by Child–Pugh class (Fig. 2A,B) and correlated highly statisti-
cally significantly (P < 0.0001) with severity of cirrhosis as determined by the Child–Pugh score (Fig. 2C,D).
Moreover, the total fetal bile acid plasma concentration (FBA1 + FBA2) correlated highly statistically signifi-
cantly (P < 0.0001) with Child–Pugh score (Fig. 2E). When nonparametric correlation was used for the data in
Fig. 2C–E, Spearman rank correlation coefficients of 0.87, 0.74 and 0.87, respectively, were found, which were
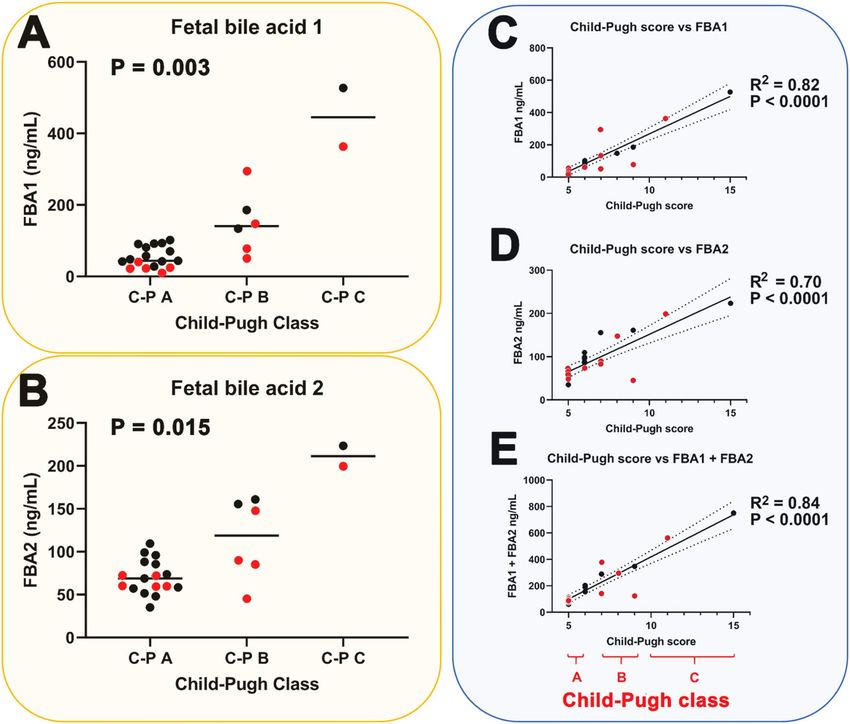
highly statistically significant (P < 0.0001). In contrast to the Child–Pugh score, the MELD score (Model for End-
stage Liver Disease) ranges from 6 to 40 and is a validated predictor of survival in end-stage liver disease, such
as decompensated cirrhosis. Plasma concentrations of 1 and 2 were statistically significantly higher in patients
with MELD scores ≥ 15 than those with valueswww.nature.com/scientificreports/
Figure 3. Statistically significant relationship (nonparametric Kruskal–Wallis test) between MELD score and
(A) fetal bile acid 1 (FBA1) plasma concentration (ng/mL), (B) fetal bile acid 2 (FBA2) plasma concentration
(ng/mL) and statistically significant correlations (simple linear regression) between MELD score and (C)
FBA1 plasma concentration, (D) FBA2 plasma concentration and (E) the sum of FBA1 and FBA2 plasma
concentrations. Black symbols represent LC patients without HCC and red symbols represent LC patients with
HCC. Dotted lines represent 95% confidence intervals.
concentrations of alpha-fetoprotein (AFP; Tables 1,2), a protein made by fetal liver and used as a diagnostic aid
for HCC18, did not correlate with plasma FBA1 and FBA2 concentrations, either alone or combined (data not
shown). AFP values, as expected were statistically significantly higher for patients with HCC (P = 0.007).
In addition to the determination of plasma fetal bile acids, 15 primary and secondary bile acids (free and
glycine and taurine conjugated) were determined in patient plasma by UPLC-QTOFMS. Figure 4 depicts area
responses for each of these plasma bile acids in relation to the Child–Pugh classes A, B and C.
Moreover, correlations for the 15 free and conjugated primary and secondary bile acids were also sought using
the Spearman rank correlation due to the non-Gaussian distribution of the bile acid and MELD score data. After
Bonferroni correction for multiple comparisons, only the taurine conjugated primary bile acids TCA (Spear-
man r = 0.669; adjusted P = 0.008) and TCDCA (Spearman r = 0.602; adjusted P = 0.03) correlated statistically
significantly. These were stronger correlations than those with the Child–Pugh score). The other 13 bile acids did
not correlate with the MELD score with Spearman r values from 0.029 to 0.469 (adjusted P values from 0.08 to
1.0). In addition, an analysis of the 15 bile acids was undertaken in relation to the presence or absence of each of
ascites, encephalopathy and esophageal varices. None of these 45 analyses conducted using the nonparametric
Mann–Whitney U test produced statistically significantly differences after Bonferroni correction for multiple
comparisons.
As for the fetal bile acids in Figs. 2 and 3, the presence of HCC did not influence the relationship between
plasma bile acids and Child–Pugh class. Although the conjugated primary bile acids appeared to increase with
increasing cirrhosis severity, when P-values were adjusted for multiple comparisons using the Bonferroni cor-
rection, no statistically significant relationships remained for these primary bile acid conjugates. In addition,
Scientific Reports | (2021) 11:8298 | https://doi.org/10.1038/s41598-021-87921-5 5
Vol.:(0123456789)www.nature.com/scientificreports/
Figure 4. Relationships (Kruskal–Wallis test) between plasma area responses of 15 bile acids and severity of
cirrhosis determined by Child–Pugh classes A, B and C. Green boxes represent the primary bile acids cholic
acid and chenodeoxycholic acid. Brown boxes represent the secondary bile acids deoxycholic acid, lithocholic
acid and ursodeoxycholic acid. Each free bile acid is grouped together with its glycine and taurine conjugates.
C-P mean Child–Pugh. Black symbols represent LC patients without HCC and red symbols represent LC
patients with HCC.
Bile acid LC with HCC LC without HCC P value
Free and conjugated primary bile acids (median values)
Cholic acid 80 215 0.56
Glycocholic acid 8350 12,698 0.28
Taurocholic acid 4743 6071 0.78
Chenodeoxycholic acid 5208 5564 0.69
Glycochenodeoxycholic acid 27,001 33,628 0.61
Taurochenodeoxycholic acid 9771 15,457 0.74
Free and conjugated secondary bile acids (median values)
Deoxycholic acid 3003 5874 0.19
Glycodeoxycholic acid 1444 4787 0.12
Taurodeoxycholic acid 276 863 0.12
Lithocholic acid 116 75 0.88
Glycolithocholic acid 334 140 0.69
Taurolithocholic acid 119 59 0.52
Ursodeoxycholic acid 3928 1249 0.83
Glycoursodeoxycholic acid 1575 1395 0.74
Tauroursodeoxycholic acid 210 77 0.88
Table 4. Lack of effect of the presence of HCC on 15 primary and secondary bile acids in patients with liver
cirrhosis (LC). Analyzed by nonparametric Mann–Whitney U test due to non-Gaussian distribution of data.
when these 15 primary and secondary bile acids were compared between liver cirrhosis patients with and without
HCC, there were no statistically significant differences found (Table 4).
In summary, plasma concentrations of fetal bile acids 1 and 2 alone and combined were highly correlated
with cirrhosis severity (Figs. 2, 3). This was not so for the 15 primary and secondary bile acids also determined
in patient plasma (Fig. 4). It is therefore probable that the metabolic activity of AKR1D1 declines with increasing
severity of cirrhosis in a manner that is unaffected by the presence of hepatic tumors.
Scientific Reports | (2021) 11:8298 | https://doi.org/10.1038/s41598-021-87921-5 6
Vol:.(1234567890)www.nature.com/scientificreports/
Discussion
As their name suggests, fetal bile acids occur predominantly in the fetus and are known to decline significantly in
the first few days after birth9. However, elevated concentrations of these 3-oxo-Δ4 bile acids have been detected
in neonates and children with congenital Δ4-3-oxosteroid 5β-reductase (AKR1D1) d eficiency10, 11, 19, 20. Tenta-
tive identification of fetal bile acids 1 and 2 in adults was made in a plasma metabolomics and lipid profiling
investigation of HCC patients that used age-matched AML cases as controls. This identification was made on
the basis of mass spectroscopic characteristics without authentic chemical standards for 1 and 27. Apart from
this report of 20 HCC patients vs. 22 acute myeloid leukemia (AML) controls7, these fetal bile acids had only
previously been reported in n eonates11, 20.
Because these authentic standards are not commercially available, a detailed account of their chemical synthe-
sis is provided here, together with characterization of the intermediates by 1H NMR and of the two final products
1 and 2 by 1H NMR and high-resolution mass spectrometry. Determination of 1 and 2 in children and neonates
with Δ4-3-oxosteroid 5β-reductase (AKR1D1) deficiency10, 11, 19, 20 has typically been performed using urinary
analysis by negative ion fast atom bombardment mass spectrometry (FAB-MS) and gas chromatography-mass
spectrometry (GC–MS) in a complex assay that involved hydrolysis of bile acid conjugates in urine after over-
night incubation with bile salt hydrolase and double derivatization by methylation and t rimethylsilylation10, 11.
We describe here for the first time a rapid and simple quantitative UPLC-TQMS assay for the fetal bile acids 1
and 2, which has been utilized to investigate plasma from patients with various degrees of liver cirrhosis, both
with and without HCC. This investigation established several unique conclusions. First, plasma concentration
of the two fetal bile acids was not related to the presence of hepatic tumors. This could be due to small patient
numbers, requiring a larger study to solve this issue. In a previous metabolomic study7, plasma levels of 1 and 2
were upregulated relative to AML but it was unclear if this was due to HCC or LC. Second, plasma concentra-
tions of the fetal bile acids correlated strongly with increasing both Child–Pugh and MELD scores, indicating a
relationship between these bile acids and severity of cirrhosis. Third, a further 15 both primary and secondary
bile acids and their glycine and taurine conjugates were neither correlated with Child–Pugh classes A, B and C
nor with the MELD score, once allowance for multiple comparisons was made. These findings were also unre-
lated to the presence of HCC. These results point to plasma fetal bile acids as the only indication of severity of
cirrhosis known so far among the bile acid family.
The highlights of this study were that we describe a step-by-step chemical synthesis of these two fetal bile
acids, which are not commercially available. In addition, we have described a simple, rapid and quantitative liq-
uid chromatography-tandem mass spectrometry assay for their quantitation in human plasma. We have applied
these novel methodologies to the investigation of hepatic cirrhosis. The limitations of our study concern this last
component. First, we recruited relatively few patients (n = 25) with HCC (n = 10) and without HCC (n = 15). This
group of patients was highly heterogeneous in relation to their complications arising from decompensation, with
encephalopathy (n = 7), ascites (n = 8) and esophageal varices (n = 9). Notwithstanding this heterogeneity, clear
correlations between each fetal bile acid and both the Child–Pugh score and the MELD score were obtained. A
further limitation of this investigation is that liver tissue was not available from the patients and therefore it was
not possible to determine AKR1D1 expression by qPCR or AKR1D1 protein by western blotting. This would
have permitted us to confirm the role of AKR1D1 in fetal bile acid disposition, which we posited is compromised
with increasing severity of cirrhosis.
Because of the large volume of research on fetal bile acids and inborn Δ4-3-oxosteroid 5β-reductase (AKR1D1)
deficiency, it is tempting to propose that deteriorating liver function may also affect the activity of this hepatic
enzyme leading to elevated fetal bile acids as a phenocopy of the inborn error of metabolism. It has been
postulated10 that excessive amounts of Δ4-3-oxo bile acids might also be expected to occur in children with
severe liver diseases such as hepatitis B and autoimmune chronic active hepatitis but not in more benign chronic
cholestatic syndromes such as biliary atresia. In this report, a single patient aged 15 months with a deficiency in
fumarylacetoacetase (FAH), known as hereditary tyrosinemia type I that is associated with liver cirrhosis and
fatal HCC at a young age21, had the highest ratio of 7α,12α-dihydroxy-3-oxo-4-cholenoic acid (a fetal bile acid)
to cholic acid in a series of 25 children and neonates with various liver d iseases10. These authors suggested that
4
an altered redox state in hepatocytes or an unusual sensitivity of Δ -3-oxosteroid 5β-reductase to liver damage
might explain their findings. Elevated plasma bile acids, in particular, both free and conjugated CDCA, have
been reported to be elevated in cirrhotic patients relative to healthy volunteers22. Total bile acids and total bile
acids/cholesterol ratio were found to be elevated in 451 cirrhotic patients compared with 216 non-cirrhotic
patients with non-cholestatic chronic HBV infection in China23. An investigation of 32 cirrhotic patients and 27
healthy volunteers examined 12 serum bile acids using UPLC-TQMS and reported that serum concentrations of
the conjugated primary bile acids, taurocholic acid (TCA), glycocholic acid (GCA) and taurochenodeoxycholic
acid (TCDCA) were positively associated with Child–Pugh classification24. Our own data would appear to cor-
roborate these observations, with uncorrected P-values for nonparametric analyses of variance (Kruskal–Wallis)
of the relationships between plasma TCA, GCA and TCDCA with Child–Pugh class. However, when corrected
for false discovery, these relationships ceased to remain statistically significant, as did any relationship between
non-fetal bile acids and the MELD score.
In a study of alcoholic cirrhosis in heavy alcohol drinkers, striking increases in taurine conjugated bile acids
in serum were observed (50- to 130-fold) with more moderate increases in glycine conjugated bile acids (10- to
20-fold). Increased levels of glycochenodeoxycholic acid (GCDCA), TCDCA, GCA, and TCA were positively
correlated with disease progression from Child–Pugh A to C25. These dramatic findings were of a much higher
order than those in our study. It would be of great interest to know how fetal bile acids concentrations were
modified in such patients.
Scientific Reports | (2021) 11:8298 | https://doi.org/10.1038/s41598-021-87921-5 7
Vol.:(0123456789)www.nature.com/scientificreports/
Plasma or serum AFP concentrations are generally regarded as a useful addition to surveillance by ultrasound,
CT or MRI imaging for the detection of early HCC and this has been established by a meta-analysis of 32 studies
involving 13,367 patients26. Perusal of the raw data establishes that the AFP values for our patients are not diag-
nostic for the presence of HCC. AFP was detected in 9/15 cirrhotic patients without HCC with a median value of
2.6 ng/mL compared with 9.0 ng/mL for those with HCC. AFP is well known to vary in HCC from normal values
(< 10 ng/mL) to extremely high values (> 100,000 ng/mL). When used diagnostically, an AFP of 20 ng/mL shows
good sensitivity but low specificity and in contrast a value of 200 ng/mL has a high specificity but a sensitivity
of only 22%27. It is interesting to propose that deteriorating liver function in the direction of HCC represents
an evolving fetal phenotype, particularly when considering the fetal bile acid changes reported here. However,
there was a lack of correlation between AFP and fetal bile acid concentrations. In addition, the inborn error of
metabolism involving Δ4-3-oxosteroid 5β-reductase (AKR1D1) deficiency that leads to the accumulation and
urinary excretion of fetal bile acids 1 and 211, 19, has not been investigated in relation to increased postnatal serum
AFP concentrations. The role of an evolving fetal phenotype in LC that may lead to HCC is an open question.
The issue remains how does severity of liver cirrhosis influence the plasma concentration of fetal bile acids
1 and 2? A generalized increased bile acid synthesis, as eluded to above, may result in elevated plasma con-
centrations of the intermediates 1 and 2. Alternatively, as is the case with the inborn error of metabolism with
genetically impaired Δ4-3-oxosteroid 5β-reductase deficiency, AKR1D1 activity may be impaired by an as yet
undefined mechanism, leading to worsening cirrhosis. In human liver biopsies taken from 34 obese patients,
AKR1D1 mRNA expression was reported to decrease with advancing steatosis, fibrosis and inflammation14.
Glucocorticoids, including endogenous cortisol, both downregulate AKR1D1 and are metabolized by it28. A
reduced plasma clearance of cortisol in cirrhosis has long been o bserved29, congruent with a slower metabolic
turnover of cortisol in cirrhotic p atients30. Taken together, these and other reports may provide an biochemical
basis for the association of increased fetal bile acids in patients with advancing cirrhosis.
Materials and methods
Reagents. All reagents for the chemical syntheses that were conducted in South Korea were purchased from
Sigma-Aldrich Korea Ltd. and Tokyo Chemical Industry Co., Ltd.
General methods for chemical purification and analysis. Product purification was conducted
by preparative flash column chromatography using ZEOprep 60 unbonded silica (230–400 mesh). All NMR
experiments were carried out using a Bruker Avance III 400 MHz NMR spectrometer equipped with a 5-mm
broadband-observed probe head. Chemical shifts were measured relative to residual solvent peaks as an inter-
nal standard set to δ 7.26 (CDCl3). Multiplicities in the 1H NMR spectra as described as s = singlet, d = doublet,
t = triplet, q = quartet, m = multiplet, br. s = broad singlet. Liquid chromatography-mass spectra (LCMS) were
measured in positive electrospray ionization (ESI) mode on a Waters Xevo G2-XS instrument.
Synthesis of fetal bile acids. Figure 5 shows the scheme for the synthesis of fetal bile acids 1 and 2.
Procedures a and b for the synthesis of 4 from 3 (chenodeoxycholic acid) were conducted as follows: a. Com-
pound 3 (2.80 g, 7.13 mmol), formic acid (11 mL) and 70% perchloric acid (0.4 mL, 4.93 mmol) were mixed and
the reaction stirred at 55 °C for 1.5 h. To the reaction mixture was slowly added acetic anhydride (9 mL) at 40 °C
and then stirred at 55 °C until bubbling ceased. The mixture was then cooled to RT and slowly added to water and
extracted with ethyl acetate. The separated organic phase was washed with brine, dried over anhydrous M gSO4,
filtered and concentrated under reduced pressure. The resulting residue was purified using flash column chro-
matography (SiO2, 5% methanol in dichloromethane) to afford the 3,7-diformyl intermediate (0.57 g, 48%). b. To
the 3,7-diformyl intermediate (0.22 g, 0.49 mmol) in acetone (4 mL) was slowly added 0.2 M sodium hydroxide
(5 mL, 1.0 mmol) and the reaction mixture stirred at RT for I h, neutralized to pH 7 with acetic acid, diluted
with water and extracted with dichloromethane. The separated organic phase was washed with brine, dried
over anhydrous M gSO4, filtered and concentrated under reduced pressure. The resulting residue was purified
using flash column chromatography ( SiO2, 30% ethyl acetate in n-hexane) to afford compound 4 (0.11 g, 53%).
Procedure c for compound 5 was conducted as follows: To compound 4 (0.11 g; 0.26 mmol) in acetone
(11 mL) was slowly added Jones’ reagent (0.3 mL) at 4 °C and the reaction stirred at this temperature for 2 h,
then at RT for 1 h, whereupon methanol (0.6 mL) was slowly added to the reaction mixture to form a suspension,
which was filtered and washed with acetone. The combined filtrate was concentrated under reduced pressure
and the resulting residue purified using flash column chromatography ( SiO2, 30% ethyl acetate in n-hexane) to
afford compound 5 (0.05 g, 46%).
Procedure d for compound 6 was conducted as follows: To compound 5 (0.55 g, 1.31 mmol) and p-toluene-
sulfonic acid (PTSA; 0.04 g, 0.22 mmol) in DMF (5 mL) was slowly added bromine (0.24 g, 1.50 mmol) in DMF
(1 mL) at RT and stirred for 20 h. The mixture was then slowly added to water and extracted with ethyl acetate.
The separated organic phase was washed with brine, dried over anhydrous MgSO4, filtered and concentrated
under reduced pressure. The resulting residue was purified using flash column chromatography (SiO2, 40% ethyl
acetate in n-hexane) to afford compound 6 (0.57 g, 87%).
Procedure e for compounds 1 and 7 was conducted as follows: A solution of semicarbazide.HCl (0.25 g,
2.24 mmol) and sodium acetate (0.18 g, 2.19 mmol) in water (1 mL) was added dropwise to compound 6 (0.41 g,
0.82 mmol) in acetic acid (8 mL) and the mixture stirred at 60 °C for 0.5 h, then stirred at RT for 1 h to form
a precipitate. This solid was filtered, washed with pure water and used without further purification. This solid,
acetic acid (9 mL), pyruvic acid (0.9 mL) and water (2.1 mL) were stirred at RT for 20 h. Precipitated solid was
filtered off and the filtrate extracted with ethyl acetate, which was washed with brine and dried over anhydrous
MgSO4, filtered and evaporated under reduced pressure. The resulting residue was purified using flash column
Scientific Reports | (2021) 11:8298 | https://doi.org/10.1038/s41598-021-87921-5 8
Vol:.(1234567890)www.nature.com/scientificreports/
Figure 5. Chemical synthesis of fetal bile acids. Reagents and conditions: a. HCOOH, 70% H ClO4, 40–60 °C,
2 h; b. 0.2 M NaOH, acetone, RT, 1 h; c. Jones’ reagent, acetone, 0 °C, 2 h; d. PTSA, B
r2, DMF, RT, 12 h; e.
semicarbazide, NaOAc in H 2O, AcOH, 60 °C, 1 h; f. 0.2 M NaOH, H2O, RT, 0.25 h. The reactions were modified
from the procedures of Leppik for cholic and deoxycholic acids31.
chromatography (SiO2, 50% ethyl acetate in n-hexane) to afford compound 1 (0.025 g, 8%) and compound 7
(0.085 g, 26%).
Procedure f for compound 2 was conducted as follows: Compound 7 (0.085 g, 0.21 mmol) was dissolved
in 0.5 M sodium hydroxide (10 mL) and stirred at RT for 1.5 h. The reaction mixture was acidified to pH 1–2
with 1 M HCl and extracted with ethyl acetate. The combined organic phase was washed with brine, dried over
anhydrous MgSO4 and evaporated under reduced pressure. The resulting residue was lyophilized without further
purification to afford compound 2 (0.075 g, 90%).
Spectral data for synthetic fetal bile acids 1 and 2 were as follows:
(R)-4-((8S,9S,10R,13R,14S,17R)-10,13-dimethyl-3-oxo-2,3,8,9,10,11,12,13,14,15,16,17-dodecahydro-
1H-cyclopenta[a]phenanthren-17-yl)pentanoic acid (1). m.p. 198–200 °C. 1H NMR (400 MHz, CD3OD)
δ 6.15 (dd, J = 9.7, 2.0 Hz, 1H), 6.07 (dd, J = 9.8, 2.7 Hz, 1H), 5.55 (s, 1H), 2.60–2.47 (m, 1H), 2.32–2.08
(m, 4H), 2.03–1.92 (m, 3H), 1.90–1.82 (m, 1H), 1.80–1.68 (m, 2H), 1.66–1.57 (m, 1H), 1.54–1.44 (m, 1H),
1.43–1.28 (m, 4H), 1.26–1.10 (m, 5H), 1.06 (s, 2H), 1.00 (d, J = 16.3 Hz, 1H), 0.91–0.83 (m, 3H), 0.71 (s, 1H),
0.68–0.61 (m, 1H).; LCMS (ESI): Exact mass calculated for C 24H34O3 [M + H]+ 371.2586, found 371.2603
(Δm/z = 4.6 ppm).
(4R)-4-((8S,9S,10R,13R,14S,17R)-7-hydroxy-10,13-dimethyl-3-oxo-2,3,6,7,8,9,10,11,12,13,14,15,16,17-
tetradecahydro-1H-cyclopenta[a]phenanthren-17-yl)pentanoic acid (2). m.p. 228–230 °C ( literature32 227–
229 °C). 1H NMR (400 MHz, CD3OD) δ 5.64 (s, 1H), 3.83 (d, J = 2.5 Hz, 1H), 2.62–2.53 (m, 1H), 2.46–2.05
(m, 5H), 2.02–1.91 (m, 2H), 1.91–1.78 (m, 1H), 1.75–1.61 (m, 3H), 1.59–1.18 (m, 9H), 1.16–1.03 (m, 6H),
0.87 (d, J = 6.5 Hz, 3H), 0.67 (s, 2H); LCMS (ESI): Exact mass calculated for C 24H36O4 [M + H]+ 389.2692,
found 389.2706 (Δm/z = 3.6 ppm).
Spectral data for the intermediates 4, 5, 6 and 7 are given in the Supplementary Files.
Quantitation of fetal bile acids 1 and 2 in plasma by ultraperformance liquid chromatogra‑
phy‑triple quadrupole mass spectrometry (UPLC‑TQMS). Human plasma (25 μL) was protein pre-
cipitated with methanol (475 μL) and centrifuged for 3 min at 25,000 g. Resultant supernatant (100 μL) was
Scientific Reports | (2021) 11:8298 | https://doi.org/10.1038/s41598-021-87921-5 9
Vol.:(0123456789)www.nature.com/scientificreports/
diluted with deionized water (100 μL) and 10μL injected into the UPLC-TQMS system, which comprised an
Acquity I-Class UPLC and a Xevo-TQ-S Micro mass spectrometer (Waters). UPLC separation was achieved on
a CORTECS T3 2.7 μm (2.1 × 30 mm) analytical column with a flow rate of 1.3 mL/min. Mobile phases A and B
were 0.01% aqueous formic acid and isopropanol/acetonitrile (50:50 v/v) containing 0.01% formic acid, respec-
tively. After an initial 0.1 min at 30% B, the bile acids were eluted with a gradient of 30–65% B over 0.7 min, fol-
lowed by a 0.9 min column wash with 98% B and re-equilibrated to initial conditions. The analytical column was
maintained at 60 °C. Multiple Reaction Monitoring (MRM) analyses were performed in negative electrospray
ionization mode. Ion source temperature and capillary voltage were held constant at 150 °C and 2.0 kV, respec-
tively. The cone gas flow was 50 L/h and desolvation temperature was 650 °C. Fetal bile acids 1 and 2 eluted at
1.08 and 0.82 min, respectively. For fetal bile acid 1, the MRM used was 369.3 > 325.4 with a dwell time of 0.069 s,
a cone voltage of 100 V and a collision energy of 23 eV. For fetal bile acid 2, the MRM used was 387.3 > 369.4
with a dwell time of 0.069 s, a cone voltage of 100 V and a collision energy of 19 eV. The internal standard (IS)
employed was 3β,7α-dihydroxy-5-cholesten-26-oic acid (DHCA) added at a concentration of 500 ng/mL, which
eluted at 0.43 min. The MRM for the IS used was 401 > 331 with a cone voltage of 60 V and a collision energy
of 20 eV. Peak area ratios to the internal standard were used for construction of calibration curves. For fetal
bile acid 1 (FBA1), the calibration curve was linear (R2 = 0.998; P < 0.0001). For fetal bile acid 2 (FBA2), the
calibration curve was also linear (R2 = 0.999; P < 0.0001). Precursor and product ions were similar to a published
method but with lower collision energies33. The advantage of this assay is the short retention times (< 1.2 min)
for 1 and 2, compared with 33.2 and 29.0 min, respectively, as reported earlier33.
Quantitation of primary and secondary bile acids in plasma by ultraperformance liquid chro‑
matography‑triple quadrupole mass spectrometry (UPLC‑TQMS). Human plasma (100 μL) was
protein precipitated with methanol (400 μL) and centrifuged at 25,000×g for 3 min. Resultant supernatant (100
μL) was diluted with deionized water (100 μL) and 10 μL injected into the UPLC-TQMS system (see above).
UPLC separation was achieved on a CORTECS T3 2.7 μm (2.1 × 30 mm) analytical column with a flow rate of
1.3 mL/min. Mobile phases A and B were 0.01% aqueous formic acid containing 0.2 mM ammonium formate
and isopropanol/acetonitrile (50:50 v/v) containing 0.01% formic acid and 0.2 mM ammonium formate, respec-
tively. After 0.1 min at 20% B, the bile acids were eluted with a gradient of 20–55% B over 0.7 min, followed by
a 0.9 min column wash with 98% B and re-equilibrated to initial conditions. The analytical column was main-
tained at 60 °C. MRM analyses were performed as above. Retention times together with MRM transitions, cone
voltages and collision energies are shown in Supplementary Table S1. Comparison of patients for these 15 bile
acids was made from the peak area responses in plasma without calculation of formal concentration using cali-
bration curves34. However, in the case of CDCA, the primary bile acid most closely related to FBA1 and FBA2,
a calibration curve was constructed as for the fetal bile acids above. For CDCA, the calibration curve was linear
(R2 = 0.998; P < 0.0001).
Patient investigations. Patients were recruited from the Octavian Fodor Institute for Gastroenterology
and Hepatology Hospital, Cluj-Napoca, Romania. All patients gave their written informed consent prior to study
inclusion. The study was performed in accordance with the 1975 Declaration of Helsinki and approved by the
institutional review board of the Regional Institute of Gastroenterology and Hepatology “Prof. Dr. Octavian
Fodor”, Cluj-Napoca, Romania (approval no. 2445/12.02.2016). All patients included in this study were hos-
pitalized, having been admitted for liver cancer screening, because of a first decompensation event (ascites,
encephalopathy, jaundice or variceal bleeding), because of newly diagnosed focal liver lesions on a background
of liver cirrhosis or because of referral for treatment (e.g. ablation, surgery or TACE). HCC patients (n = 10) were
consecutively enrolled into the study. During the same period, consecutive patients with liver cirrhosis (LC) but
no HCC (n = 15) were included. The diagnosis of HCC was made according to non-invasive criteria or based on
histology in patients with atypical lesions on a background of liver cirrhosis. LC patients included those on the
first diagnosis of cirrhosis based on ultrasound, laboratory data, Fibroscan, CT/MRI and/or hepatic venous pres-
sure measurement with liver biopsy or patients who were known with a history of liver cirrhosis and presented
with cirrhosis decompensation (hepatic encephalopathy, ascites, variceal bleeding). The exclusion criteria were:
(1) previous or concurrent cancer; (2) active infections other than chronic hepatitis B or hepatitis C virus; (3)
history of organ allograft; (4) pregnancy or breastfeeding; and (5) refusal to sign for informed consent. Clinical
details of HCC patients and LC patients are given in Tables 1 and 2 respectively. For the HCC patients, 3/10 were
female and for the LC patients, 3/15 were female. Child–Pugh c lass16 for the HCC patients (number/total) were
A (5/10), B (4/10) and C (1/10) and for the LC patients were A (12/15), B (2/15) and C (1/15), corresponding to
Child–Pugh scores16 of 5–11 for HCC and 5–15 for LC. MELD scores for the HCC patients ranged from 6 to 18
and for the LC patients ranged from 6 to 27. Peripheral venous blood was drawn into heparinized tubes for each
patient and spun at 1300 g to prepare plasma, which was aliquoted and frozen at − 80 °C prior to shipment to
Switzerland by courier on dry-ice. Plasmas were stored at − 80 °C in Bern before forwarding of aliquots by cou-
rier on dry-ice to Wilmslow, UK where they were analyzed by UPLC-TQMS for fetal bile acids 1 and 2, together
with 15 free and conjugated primary and secondary bile acids as described above.
Data analysis. Statistical analysis was performed using GraphPad Prism 9.1.0 (San Diego, CA, USA) by
nonparametric statistics because of the general non-Gaussian distribution of the data. Comparisons between
two groups of data were analyzed using the Mann–Whitney U test and between three or more groups using the
Kruskal–Wallis test. Correlations between variables were made by Spearman’s rank correlation. All values are
expressed as medians. P < 0.05 was considered statistically significant. The Bonferroni correction was used when
multiple comparisons were made.
Scientific Reports | (2021) 11:8298 | https://doi.org/10.1038/s41598-021-87921-5 10
Vol:.(1234567890)www.nature.com/scientificreports/
Data availability
Requests for raw data or authentic compounds should be made to the corresponding author (jeff.idle@liu.edu).
Received: 22 January 2021; Accepted: 6 April 2021
References
1. Xiao, J. et al. Global liver disease burdens and research trends: Analysis from a Chinese perspective. J. Hepatol. 71, 212–221. https://
doi.org/10.1016/j.jhep.2019.03.004 (2019).
2. Collaborators, G. B. D. C. The global, regional, and national burden of cirrhosis by cause in 195 countries and territories, 1990–2017:
A systematic analysis for the Global Burden of Disease Study 2017. Lancet Gastroenterol. Hepatol. 5, 245–266. https://doi.org/10.
1016/S2468-1253(19)30349-8 (2020).
3. Perumpail, B. J. et al. Clinical epidemiology and disease burden of nonalcoholic fatty liver disease. World J. Gastroenterol. 23,
8263–8276. https://doi.org/10.3748/wjg.v23.i47.8263 (2017).
4. Schulz, M. & Tacke, F. Identifying high-risk NASH patients: What we know so far. Hepatol. Med. 12, 125–138. https://doi.org/10.
2147/HMER.S265473 (2020).
5. Sakamaki, A. et al. Obesity and accumulation of subcutaneous adipose tissue are poor prognostic factors in patients with alcoholic
liver cirrhosis. PLoS ONE 15, e0242582. https://doi.org/10.1371/journal.pone.0242582 (2020).
6. Beyoglu, D. & Idle, J. R. Metabolomic and lipidomic biomarkers for premalignant liver disease diagnosis and therapy. Metabolites
https://doi.org/10.3390/metabo10020050 (2020).
7. Patterson, A. D. et al. Aberrant lipid metabolism in hepatocellular carcinoma revealed by plasma metabolomics and lipid profiling.
Cancer Res. 71, 6590–6600. https://doi.org/10.1158/0008-5472.CAN-11-0885 (2011).
8. El-Mir, M. Y., Badia, M. D., Luengo, N., Monte, M. J. & Marin, J. J. Increased levels of typically fetal bile acid species in patients
with hepatocellular carcinoma. Clin. Sci. (Lond.) 100, 499–508 (2001).
9. Inoue, T., Kimura, A., Aoki, K., Tohma, M. & Kato, H. Developmental pattern of 3-oxo-delta 4 bile acids in neonatal bile acid
metabolism. Arch. Dis. Child Fetal Neonatal Ed. 77, F52-56 (1997).
10. Clayton, P. T. et al. 3-Oxo-delta 4 bile acids in liver disease. Lancet 1, 1283–1284 (1988).
11. Setchell, K. D. et al. Delta 4–3-oxosteroid 5 beta-reductase deficiency described in identical twins with neonatal hepatitis. A new
inborn error in bile acid synthesis. J. Clin. Investig. 82, 2148–2157. https://doi.org/10.1172/JCI113837 (1988).
12. Kimura, A. et al. Urinary 7alpha-hydroxy-3-oxochol-4-en-24-oic and 3-oxochola-4,6-dien-24-oic acids in infants with cholestasis.
J. Hepatol. 28, 270–279 (1998).
13. Pandak, W. M. & Kakiyama, G. The acidic pathway of bile acid synthesis: Not just an alternative pathway. Liver Res. 3, 88–98.
https://doi.org/10.1016/j.livres.2019.05.001 (2019).
14. Nikolaou, N. et al. AKR1D1 is a novel regulator of metabolic phenotype in human hepatocytes and is dysregulated in non-alcoholic
fatty liver disease. Metabolism 99, 67–80. https://doi.org/10.1016/j.metabol.2019.153947 (2019).
15. Albers, I., Hartmann, H., Bircher, J. & Creutzfeldt, W. Superiority of the Child–Pugh classification to quantitative liver function
tests for assessing prognosis of liver cirrhosis. Scand. J. Gastroenterol. 24, 269–276. https://doi.org/10.3109/00365528909093045
(1989).
16. Durand, F. & Valla, D. Assessment of the prognosis of cirrhosis: Child–Pugh versus MELD. J. Hepatol. 42, S100–S107. https://doi.
org/10.1016/j.jhep.2004.11.015 (2005).
17. D’Amico, G. Developing concepts on MELD: Delta and cutoffs. J Hepatol. 42, 790–792. https://doi.org/10.1016/j.jhep.2005.03.009
(2005).
18. Tomasi, T. B. Jr. Structure and function of alpha-fetoprotein. Annu. Rev. Med. 28, 453–465. https://doi.org/10.1146/annurev.me.
28.020177.002321 (1977).
19. Clayton, P. T., Mills, K. A., Johnson, A. W., Barabino, A. & Marazzi, M. G. Delta 4-3-oxosteroid 5 beta-reductase deficiency: Failure
of ursodeoxycholic acid treatment and response to chenodeoxycholic acid plus cholic acid. Gut 38, 623–628 (1996).
20. Lemonde, H. A. et al. Mutations in SRD5B1 (AKR1D1), the gene encoding delta(4)-3-oxosteroid 5beta-reductase, in hepatitis and
liver failure in infancy. Gut 52, 1494–1499. https://doi.org/10.1136/gut.52.10.1494 (2003).
21. Bliksrud, Y. T., Brodtkorb, E., Andresen, P. A., van den Berg, I. E. & Kvittingen, E. A. Tyrosinaemia type I–de novo mutation in
liver tissue suppressing an inborn splicing defect. J. Mol. Med. (Berl.) 83, 406–410. https://doi.org/10.1007/s00109-005-0648-2
(2005).
22. Sarafian, M. H. et al. Bile acid profiling and quantification in biofluids using ultra-performance liquid chromatography tandem
mass spectrometry. Anal. Chem. 87, 9662–9670. https://doi.org/10.1021/acs.analchem.5b01556 (2015).
23. Yan, L. T. et al. Total bile acid-to-cholesterol ratio as a novel noninvasive marker for significant liver fibrosis and cirrhosis in patients
with non-cholestatic chronic hepatitis B virus infection. Medicine (Baltimore) 99, e19248. https://d oi.o rg/1 0.1 097/M D.0 00000 0000
019248 (2020).
24. Liu, Z. et al. Taurocholic acid is an active promoting factor, not just a biomarker of progression of liver cirrhosis: Evidence from
a human metabolomic study and in vitro experiments. BMC Gastroenterol. 18, 112. https://doi.org/10.1186/s12876-018-0842-7
(2018).
25. Yang, Z. et al. Serum metabolomic profiling identifies key metabolic signatures associated with pathogenesis of alcoholic liver
disease in humans. Hepatol. Commun. 3, 542–557. https://doi.org/10.1002/hep4.1322 (2019).
26. Tzartzeva, K. et al. Surveillance imaging and alpha fetoprotein for early detection of hepatocellular carcinoma in patients with
cirrhosis: A meta-analysis. Gastroenterology 154, 1706–1718. https://doi.org/10.1053/j.gastro.2018.01.064 (2018).
27. Trevisani, F. et al. Serum alpha-fetoprotein for diagnosis of hepatocellular carcinoma in patients with chronic liver disease: Influ-
ence of HBsAg and anti-HCV status. J. Hepatol. 34, 570–575. https://doi.org/10.1016/s0168-8278(00)00053-2 (2001).
28. Nikolaou, N. et al. Glucocorticoids regulate AKR1D1 activity in human liver in vitro and in vivo. J. Endocrinol. 245, 207–218.
https://doi.org/10.1530/JOE-19-0473 (2020).
29. Deck, K. A., Baur, P. & Hillen, H. Plasma clearance of cortisol as a function of plasma cortisol levels in normal and obese persons
and in patients with uraemia or cirrhosis of the liver. Acta Endocrinol. (Copenh.) 91, 122–133. https://d oi.o rg/1 0.1 530/a cta.0.0 9101
22 (1979).
30. Zumoff, B., Bradlow, H. L., Gallagher, T. F. & Hellman, L. Cortisol metabolism in cirrhosis. J. Clin. Investig. 46, 1735–1743. https://
doi.org/10.1172/JCI105664 (1967).
31. Leppik, R. A. Improved synthesis of 3-keto, 4-ene-3-keto, and 4,6-diene-3-keto bile acids. Steroids 41, 475–484 (1983).
32. Iida, T., Momose, T., Nambara, T. & Chang, F. C. Potential bile acid metabolites. X. Synthesis of stereoisomeric 3,7-dihydroxy-
5a-cholanic acids. Chem. Pharm. Bull. 34, 1929–1933 (1986).
33. Muto, A. et al. Detection of Delta4-3-oxo-steroid 5beta-reductase deficiency by LC-ESI-MS/MS measurement of urinary bile acids.
J. Chromatogr. B Anal. Technol. Biomed. Life Sci. 900, 24–31. https://doi.org/10.1016/j.jchromb.2012.05.023 (2012).
34. Molloy, B. J. MetaboQuan-R for Bile Acids in Human Serum: A Rapid, Targeted UPLC-MS/MS Method for Metabolomic Research
Studies (2018). https://w ww.w aters.c om/w
aters/l ibrar y.h
tm?c id=5 11436 &l id=1 34977 277&l ocale=e n_U S Accessed 21 January 2021.
Scientific Reports | (2021) 11:8298 | https://doi.org/10.1038/s41598-021-87921-5 11
Vol.:(0123456789)www.nature.com/scientificreports/
Acknowledgements
We are grateful to Drs. Rob Plumb and James Langridge of Waters Corporation for constructive discussions.
JRI and DB wish to acknowledge that their research was funded by the office of the Senior Vice President for
Academic Affairs at Long Island University.
Author contributions
J.R.I. and T.M. designed the study. T.M. and Z.A.S. investigated the patients and produced the samples. D.W.K.
and H.J. synthesized the authentic fetal bile acids. B.J.M. developed analytical methods and analyzed the samples.
J.R.I., B.J.M., T.M. and D.B. analyzed the data, J.R.I., T.M., D.W.K. and B.J.M. wrote the manuscript. All authors
reviewed the manuscript.
Competing interests
The authors declare no competing interests.
Additional information
Supplementary Information The online version contains supplementary material available at https://doi.org/
10.1038/s41598-021-87921-5.
Correspondence and requests for materials should be addressed to J.R.I.
Reprints and permissions information is available at www.nature.com/reprints.
Publisher’s note Springer Nature remains neutral with regard to jurisdictional claims in published maps and
institutional affiliations.
Open Access This article is licensed under a Creative Commons Attribution 4.0 International
License, which permits use, sharing, adaptation, distribution and reproduction in any medium or
format, as long as you give appropriate credit to the original author(s) and the source, provide a link to the
Creative Commons licence, and indicate if changes were made. The images or other third party material in this
article are included in the article’s Creative Commons licence, unless indicated otherwise in a credit line to the
material. If material is not included in the article’s Creative Commons licence and your intended use is not
permitted by statutory regulation or exceeds the permitted use, you will need to obtain permission directly from
the copyright holder. To view a copy of this licence, visit http://creativecommons.org/licenses/by/4.0/.
© The Author(s) 2021
Scientific Reports | (2021) 11:8298 | https://doi.org/10.1038/s41598-021-87921-5 12
Vol:.(1234567890)You can also read