INFERRING THE ECOLOGICAL NICHE OF BAT VIRUSES CLOSELY RELATED TO SARS COV 2 USING PHYLOGEOGRAPHIC ANALYSES OF RHINOLOPHUS SPECIES
←
→
Page content transcription
If your browser does not render page correctly, please read the page content below
www.nature.com/scientificreports
OPEN Inferring the ecological
niche of bat viruses closely
related to SARS‑CoV‑2 using
phylogeographic analyses
of Rhinolophus species
Alexandre Hassanin1,4*, Vuong Tan Tu2,4, Manon Curaudeau1 & Gabor Csorba3
The Severe Acute Respiratory Syndrome coronavirus 2 (SARS-CoV-2) is the causal agent of the
coronavirus disease 2019 (COVID-19) pandemic. To date, viruses closely related to SARS-CoV-2
have been reported in four bat species: Rhinolophus acuminatus, Rhinolophus affinis, Rhinolophus
malayanus, and Rhinolophus shameli. Here, we analysed 343 sequences of the mitochondrial
cytochrome c oxidase subunit 1 gene (CO1) from georeferenced bats of the four Rhinolophus
species identified as reservoirs of viruses closely related to SARS-CoV-2. Haplotype networks were
constructed in order to investigate patterns of genetic diversity among bat populations of Southeast
Asia and China. No strong geographic structure was found for the four Rhinolophus species, suggesting
high dispersal capacity. The ecological niche of bat viruses closely related to SARS-CoV-2 was
predicted using the four localities in which bat viruses were recently discovered and the localities
where bats showed the same CO1 haplotypes than virus-positive bats. The ecological niche of bat
viruses related to SARS-CoV was deduced from the localities where bat viruses were previously
detected. The results show that the ecological niche of bat viruses related to SARS-CoV2 includes
several regions of mainland Southeast Asia whereas the ecological niche of bat viruses related to
SARS-CoV is mainly restricted to China. In agreement with these results, human populations in
Laos, Vietnam, Cambodia, and Thailand appear to be much less affected by the COVID-19 pandemic
than other countries of Southeast Asia. In the climatic transitional zone between the two ecological
niches (southern Yunnan, northern Laos, northern Vietnam), genomic recombination between highly
divergent viruses is more likely to occur. Considering the limited data and the risk of recombinant
bat-CoVs emergence as the source of new pandemics in humans, the bat populations in these regions
should be under surveillance.
The Severe Acute Respiratory Syndrome coronavirus 2 (SARS-CoV-2) emerged in December 2019 in Wuhan
(China)1. After 17 months, the coronavirus disease 2019 (COVID-19) pandemic has affected more than 174 mil-
lion of people around the world, claiming over 3.74 million lives2. The origin of SARS-CoV-2 remains enigmatic
and many hypotheses have been advanced to explain the first animal-to-human t ransmission3.
Within the family Coronaviridae, the subgenus Sarbecovirus includes two human viruses, SARS-CoV-2 and
SARS-CoV (which was responsible for the SARS epidemic in 2002–2004)4. The genomes of these two viruses
share only 80% of nucleotide identity, and whole-genome phylogenies have shown that they belong to two
divergent lineages1,5–7, which we refer to herein as SARS-CoV related coronaviruses (SCoVrCs) and SARS-
CoV-2 related coronaviruses (SCoV2rCs). Most SCoVrCs were discovered in bats collected in China after the
SARS epidemic, and the great majority were found in horseshoe bat species of the genus Rhinolophus (family
Rhinolophidae), suggesting that this taxon is the natural reservoir host of sarbecoviruses8. More recently, several
1
Institut de Systématique, Évolution, Biodiversité (ISYEB), SU, MNHN, CNRS, EPHE, UA, Sorbonne Université,
Paris, France. 2Institute of Ecology and Biological Resources, Vietnam Academy of Science and Technology, No. 18,
Hoang Quoc Viet Road, Cau Giay District, Hanoi, Vietnam. 3Department of Zoology, Hungarian Natural History
Museum, Baross u. 13, Budapest H‑1088, Hungary. 4These authors contributed equally: Alexandre Hassanin and
Vuong Tan Tu. *email: alexandre.hassanin@mnhn.fr
Scientific Reports | (2021) 11:14276 | https://doi.org/10.1038/s41598-021-93738-z 1
Vol.:(0123456789)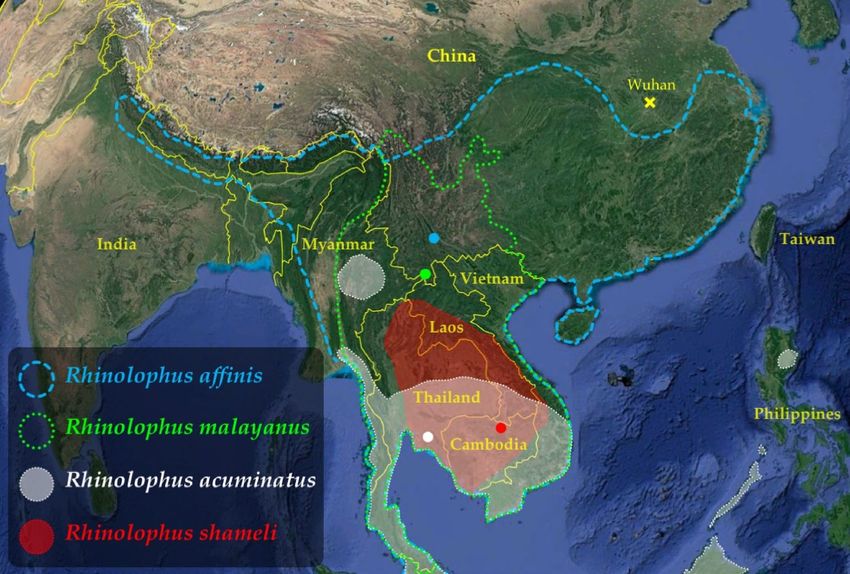
www.nature.com/scientificreports/
Figure 1. Geographic distribution of the four Rhinolophus species found positive for viruses closely related to
SARS-CoV-2 in southern China and Southeast Asia. Map from Google Earth Pro (version 7.3.3.7786) US Dept
of State Geographer © 2020 Google—Image Landsat/Copernicus—Data SIO, NOAA, U.S. Navy, NGA, GEBCO.
For each of the four Rhinolophus species, the geographic distribution was extracted from the IUCN w ebsite11.
The figure was drawn in Adobe Photoshop CS5 (version 12.0) and Microsoft PowerPoint (version 16.16.27). The
coloured dots show the four geographic locations where bats found positive for SCoV2rCs were collected.
viruses showing between 96.2 and 91.8% of genome identity with SARS-CoV-2 were identified from fecal samples
of four horseshoe bat species: the RaTG13 virus (96.2%) was isolated from a R. affinis bat collected in Yunnan
in 20131; the RmYN02 virus (93.7%) was found in a R. malayanus bat sampled in Yunnan in 20195; two variants
of the same virus RshSTT200 (93.1%; other variant: RshSTT182) were detected in two R. shameli bats caught in
northern Cambodia in 2 0106; and five variants of the same virus RacCS203 (91.8%; other variants: RacCS224,
RacCS253, RacCS264, and RacCS271) were sequenced from five R. acuminatus bats collected in eastern Thailand
in 20207. The bat species R. acuminatus and R. shameli are endemic to Southeast Asia whereas the two other bat
species, R. affinis and R. malayanus, are distributed in both Southeast Asia and China (Fig. 1), suggesting that
Southeast Asia is the main region where bat SCoV2rCs diversified. In addition, these recent data confirmed that
the genus Rhinolophus is the natural reservoir host of all sarbecoviruses3,8. Note that this hypothesis was already
corroborated by the discovery of two divergent sarbecovirus genomes (< 80% of genomic identity with SARS-
CoV and SARS-CoV-2) in horseshoe bat species collected out of Asia: one in Rhinolophus blasii from Bulgaria
(BM48-31)9 and another in an unidentified Rhinolophus species from Kenya (BtKY72)10.
Since SCoV2rCs have been circulating in horseshoe bats for many d ecades12, it is important to study popula-
tion genetic structure of bats found positive for these sarbecoviruses in order to evidence their dispersal capacity
in China and Southeast Asia. In this report, the phylogeography of the four species R. acuminatus, R. affinis,
R. malayanus and R. shameli was therefore examined using the mitochondrial cytochrome c oxidase subunit 1
gene (CO1) from 343 georeferenced bats collected in 62 localities of Southeast Asia and China (Fig. 2). For each
of the four species, haplotype networks were constructed to investigate geographic patterns of genetic diversity
among bat populations. The results of these analyses were used to select specific location coordinates to predict
the ecological niche of bat SCoV2rCs.
Results and discussion
Genetic analyses of Rhinolophus species identified as reservoirs of viruses closely related to
SARS‑CoV‑2. Until now, SCoV2rCs have been found in four bat species of the genus Rhinolophus: R. acumi-
natus, R. affinis, R. malayanus, and R. shameli. The haplotype networks constructed using CO1 sequences of
these four species are shown in Fig. 3. A star-like genetic pattern, characterized by one dominant haplotype and
several satellite haplotypes was found for the two bat species endemic to Southeast Asia, i.e. R. acuminatus and
R. shameli.
In the network of R. acuminatus, the most common haplotype (named Rac1 in online supplementary
Table S1) was found in northern Cambodia, southern Laos, eastern Thailand and southern Vietnam, indicating
Scientific Reports | (2021) 11:14276 | https://doi.org/10.1038/s41598-021-93738-z 2
Vol:.(1234567890)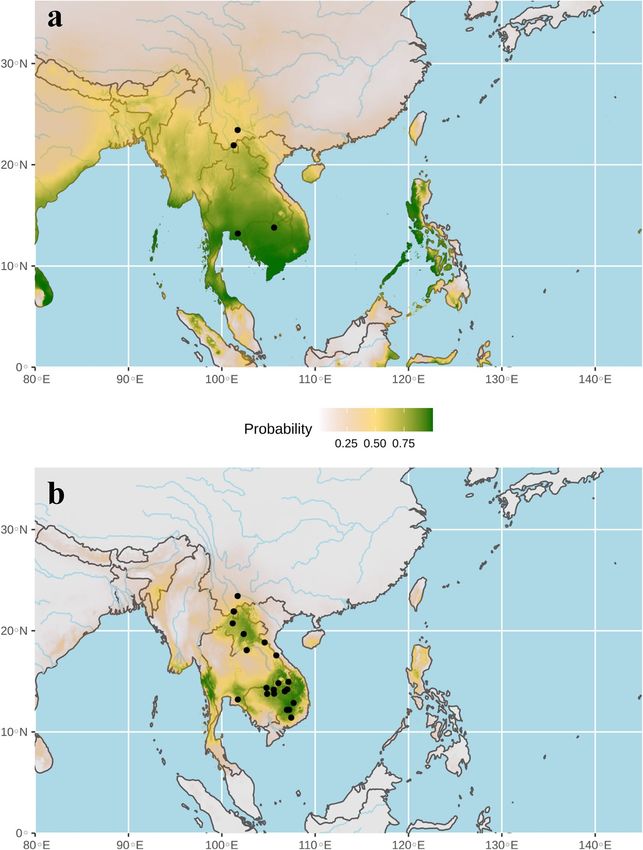
www.nature.com/scientificreports/
Figure 2. Geographic localities analysed in this study. The codes used for the countries are the following: B
(Myanmar), C (Cambodia), Ch (China), I (Indonesia), L (Laos), M (Malaysia), T (Thailand), and V (Vietnam).
Different regions were highlighted using colours. Map from Google Earth Pro (version 7.3.3.7786) US Dept of
State Geographer © 2020 Google—Image Landsat/Copernicus—Data SIO, NOAA, U.S. Navy, NGA, GEBCO.
The locality names and GPS coordinates are provided in online supplementary Table S1. The figure was drawn
in Adobe Illustrator CS6 (version 16.0) and Microsoft PowerPoint (version 16.16.27).
recent gene flow among these populations. Since a virus related to SARS-CoV-2 (91.8% of genome identity),
named RacCS203, was detected in five R. acuminatus bats caught in eastern Thailand in June 2 0206, the genetic
pattern obtained for this species suggests that viruses closely related to RacCS203 may have circulated in most
southern regions of mainland Southeast Asia. In contrast, R. acuminatus bats collected in Borneo (M5) showed
a divergent haplotype (separated by 12 mutations; haplogroup II), suggesting that the South China Sea between
mainland Southeast Asia and Borneo constitutes a barrier to gene flow. Isolated populations of R. acuminatus
described in northern Myanmar, Indonesia (Java and Sumatra) and the Philippines14 should be further studied.
The network of R. shameli shows a typical star-like pattern, the most common haplotype (named Rsh1 in
online supplementary Table S1) being detected in northern Cambodia and Laos. Since a virus related to SARS-
CoV-2 (93.1% of genome identity), named RshSTT200, was recently discovered in two R. shameli bats collected
in northern Cambodia in December 2 0107, the genetic pattern obtained for this species suggests that viruses
closely related to RshSTT200 may have circulated, at least in the zone between northern Cambodia and central
Laos. The bats sampled south to the Tonle Sap lake (n = 4; southern Cambodia and Vietnamese island of Phu
Quoc) were found to be genetically isolated from northern populations (four mutations). However, further sam-
pling in the south is required to confirm this result, as it may reveal CO1 sequences identical to the haplotypes
detected in the north.
For the two species distributed in both China and Southeast Asia, i.e. R. affinis and R. malayanus, the genetic
patterns are more complex with different haplogroups showing more than 1% of nucleotide divergence. In the
network of R. affinis, there are three major haplogroups (named I, II and III in Fig. 3) separated by a minimum of
seven mutations. The results are therefore in agreement with those previously published using CO1 and D-loop
Scientific Reports | (2021) 11:14276 | https://doi.org/10.1038/s41598-021-93738-z 3
Vol.:(0123456789)
www.nature.com/scientificreports/
Rhinolophus affinis Haplogroup I Rhinolophus malayanus Haplogroup I
Ch4 Ch2
(179 sequences) B5 T2 Ch4
Ch1
Ch5
(44 sequences) T3
V1 L9
Ch4 L10 L3 Ch2
C5 L1 B2 L1 Ch3
V4
V9 L5
B2 L5
Ch5 V3 V8 V6 B4
Haplogroup II V5 B2 C8
V2 V4 L2 V10
V11 V16 B2
Ch6 V2 V4 Haplogroup II
L5 L9
V11 V17 V12 V18
C2
B1 V15 C1
B3
L10 C5 C5
V1 T6 V9
M4 C5 C1 V7
V1 V8 T5 V17 V11
B6 V9
M1 V10
V8 M4 T2
T7
T5 V10 L10 L5
T6 M3 M2 L5
T6
Haplogroup III
Haplogroup IV
10 samples L8 L7
L8
I1 I1 Haplogroup III L8
1 sample
X2
Rhinolophus acuminatus Rhinolophus shameli
C2
(37 sequences) (82 sequences)
C3
L10 C1
Haplogroup I C4
L11
C5 C5 L10
C6 L11 L9
C6 Haplogroup II
L8
V13 L4 L6
T4 T4 2 V17 V14
C2 M5
C7
X2 C8 V18
Figure 3. Haplotype networks based on CO1 sequences of the four Rhinolophus species found positive for
viruses closely related to SARS-CoV-2 (SCoV2rCs). The networks were constructed with the median joining
method available in PopART 1.513 and modified under Adobe Illustrator CS6 (version 16.0). The codes used for
the countries are the following: B (Myanmar), C (Cambodia), Ch (China), I (Indonesia), L (Laos), M (Malaysia),
T (Thailand), and V (Vietnam). Colours indicate the geographic origin of haplotypes according to Fig. 2 (see
online supplementary Table S1). The circles indicate haplotypes separated by at least one mutation. The black
lines on the branches show the number of mutations ≥ 2. Black circles represent missing haplotypes. Circle size
is proportional to the number of haplotypes. Haplogroups separated by more than seven mutations (pairwise
nucleotide distances > 1%) are highlighted by dotted lines. The red arrows show the positions of the nine bats
found positive for SCoV2rCs.
mitochondrial sequences15. The CO1 haplotypes detected in the localities sampled in southern China (ch1, ch4,
ch5) are distantly related to the single haplotype available for central China (ch6), but they are also found in Laos,
northern and central Vietnam, northern Thailand and northeastern Myanmar. This result suggests recent gene
flow between populations from southern Yunnan and those from northern mainland Southeast Asia. Since a virus
related to SARS-CoV-2 (96.2% of genome identity), named RaTG13, was detected in one R. affinis bat captured
in southern Yunnan in 20131, the genetic pattern obtained for this species suggests that viruses closely related to
RaTG13 may have circulated in the zone comprising southern Yunnan and northern mainland Southeast Asia.
In the network of R. malayanus, there are four major haplogroups (named I, II, III and IV in Fig. 3) separated
by a minimum of seven mutations. The CO1 haplotypes detected in the localities sampled in southern China
(ch2 and ch3) were also found in northern Laos (L1 and L3), suggesting recent gene flow between populations
from these two countries. Since a virus related to SARS-CoV-2 (93.7% of genome identity), named RmYN02,
was recently isolated from one R. malayanus bat collected in southern Yunnan in June 2 0195, the genetic pattern
obtained for this species suggests that viruses closely related to RmYN02 may have circulated, at least between
southern Yunnan and northern Laos. In contrast, the bats sampled in Myanmar were found to be genetically
isolated from other geographic populations (haplogroup II in Fig. 3).
Two different ecological niches for bat viruses related to either SARS‑CoV or SARS‑CoV‑2. In
the wild, sarbecoviruses were generally detected after examining fecal samples collected on dozens of bats. For
instance, two sarbecoviruses were found7 among the total 59 bats collected at the same cave entrance in northern
Cambodia in 2010 (unpublished data). However, this does not mean necessarily that sarbecoviruses were absent
in negative samples, as degradation of RNA molecules and very low viral concentrations may prevent the detec-
tion of RNA viruses. Despite these difficulties, full genomes of Sarbecovirus have been sequenced from a wide
diversity of horseshoe bat species collected in Asia, Africa and E urope5–10. Therefore, there is no doubt that Rhi-
nolophus species constitute the natural reservoir host of all s arbecoviruses3,8. The genus Rhinolophus currently
includes between 9211 and 10916 insectivorous species that inhabit temperate and tropical regions of the Old
Scientific Reports | (2021) 11:14276 | https://doi.org/10.1038/s41598-021-93738-z 4
Vol:.(1234567890)www.nature.com/scientificreports/
Figure 4. Ecological niche of bat viruses related to SARS-CoV (SCoVrCs). The geographic distribution of
suitable environments was predicted using the Maxent algorithm in ENMTools (see “Methods” section for
details). AUC = 0.81. Black circles indicate localities used to build the distribution model (see geographic
coordinates in online supplementary Table S2).
World, with a higher biodiversity in Asia (63–68 out of the 92–109 described species) than in Africa (34–38 spe-
cies), Europe (5 species) and Oceania (5 species). Although some Rhinolophus species are solitary, most of them
are gregarious and live in large colonies or small groups generally in caves and hollow trees, but also in burrows,
tunnels, abandonned mines, and old buildings11,16. However, they prefer large caves with total darkness, where
temperatures are stable and less affected by diurnal and seasonal climatic variations. Importantly, all Rhinolophus
species in which sarbecoviruses were detected in previous studies1,5–9,17 are cave species that form small groups
or colonies (up to several hundreds)11,18,19.
In China, many SCoVrCs were previously detected in several horseshoe bat species, including Rhinolophus
sinicus, Rhinolophus ferrumequinum (currently R. nippon)16, Rhinolophus macrotis (currently R. episcopus)16,
Rhinolophus pearsoni, and Rhinolophus pusillus, and it has been shown that they circulate not only among con-
specific bats from the same colony, but also between bat species inhabiting the same c aves17,20,21. The ecological
niche predicted for bat SCoVrCs using a data set of 19 points (see online supplementary Table S2) is shown in
Fig. 4. The AUC was 0.81. The value was > 95% CI null-model’s AUCs (0.68), indicating that the model performs
significantly better than a random model (see online supplementary Fig. S1). The highest probabilities of occur-
rence (highlighted in green in Fig. 4) were found in Nepal, Bhutan, Bangladesh, northeastern India, northern
Myanmar, northern Vietnam, most regions of China south of the Yellow River, Taiwan, North and South Korea,
and southern Japan.
In Southeast Asia and southern China, SCoV2rCs have currently been found in four Rhinolophus species (R.
acuminatus, R. affinis, R. malayanus and R. shameli)1,6–8, but the greatest diversity of horseshoe bat species in
mainland Southeast Asia (between 28 and 36 species)11,16 suggests that many sarbecoviruses will be discovered
soon. Despite the limited data currently available on SCoV2rCs, several arguments support that bat intraspecific
and interspecific transmissions also occur with SCoV2rCs. Firslty, recent genomic studies have revealed that
SCoV2rCs circulate and evolve among horseshoe bats of the same colony, as five very similar genomes (nucleo-
tide distances between 0.03% and 0.10%) were sequenced from five R. acuminatus bats collected from the same
colony in eastern Thailand6, and as two genomes differing at only three nucleotide positions (distance = 0.01%)
were sequenced from two R. shameli bats collected at the same cave entrance on the same night7. Secondly, the
discovery of four viruses closely related to SARS-CoV-2 (between 96.2 and 91.8% of genome identity) in four
different species of Rhinolophus is a strong evidence that interspecific transmission occurred several times in
the past. As detailed in online supplementary Table S1, these species were collected together in several localities
of Cambodia (three species in C1, C2, and C5; two species in C8), Laos (four species in L10; three species in
L9; two species in L1, L5, L8, L11), and Vietnam (two speciess in V10, V9, V17, V18). These data corroborate
Scientific Reports | (2021) 11:14276 | https://doi.org/10.1038/s41598-021-93738-z 5
Vol.:(0123456789)www.nature.com/scientificreports/
Figure 5. Ecological niches of bat viruses closely related to SARS-CoV-2 (SCoV2rCs) predicted using 4 points
(a) (AUC = 0.58) and 21 points (b) (AUC = 0.96). The geographic distributions of suitable environments were
predicted using the Maxent algorithm in ENMTools (see “Methods” section for details). Black circles indicate
localities used to build the distribution model (see geographic coordinates in online supplementary Table S1).
previous studies suggesting that sarbecoviruses can be transmitted, at least occasionally, between Rhinolophus
species sharing the same caves.
The ecological niche of bat SCoV2rCs was firstly predicted using the four localities where bat viruses were
previously detected1,6–8 (Fig. 5a). The highest probabilities of occurrence (highlighted in green in Fig. 5a) were
found in Southeast Asia rather than in China. However, the AUC was only 0.58, and the value was < 95% CI null-
model’s AUCs (0.74), indicating that the model was not statically supported at a significance level of 0.05 (see
on line supplementary Fig. S2). As expected, these preliminary results confirmed that more than four records
are needed to increase the accuracy of the distribution m odel22. For that reason, we used a genetic approach
to determine geographic localities where bat SCoV2rCs are more likely to be found. The CO1 sequences of the
nine bats in which a SCoV2rC was detected are shown by red arrows in Fig. 3. For R. affinis, the CO1 haplotype
sequenced for the bat found positive for a SCoV2rC in southern Yunnan (site named Ch1 in Figs. 2, 3) was not
found in other sampled localities. For the three other bat species found positive for SCoV2rCs, identical CO1
sequences were detected in bats from 17 other geographic localities (see online supplementary Table S1). For R.
acuminatus, the four CO1 haplotypes sequenced for the bats found positive for SCoV2rCs in eastern Thailand
Scientific Reports | (2021) 11:14276 | https://doi.org/10.1038/s41598-021-93738-z 6
Vol:.(1234567890)www.nature.com/scientificreports/
(site named T4 in Figs. 2, 3) were also found in four localities in Cambodia (C2, C4, C5, and C6), two localities
in southern Laos (L10 and L11), and three localities in southern Vietnam (V13, V14, and V17). The results indi-
cate high connectivity among R. acuminatus populations from eastern Thailand, Cambodia, southern Laos and
southern Vietnam. For R. malayanus, the CO1 haplotype sequenced for the bat found positive for a SCoV2rC
in southern Yunnan (site named Ch3 in Figs. 2, 3) was also found in another locality in southern Yunnan (Ch2)
and two localities in northern Laos (L1 and L3). The results indicate high connectivity among R. malayanus
populations from southern China and northern Laos. For R. shameli, the single CO1 haplotype sequenced for
the two bats found positive for SCoV2rCs in northern Cambodia (site named C3 in Figs. 2, 3) was also found
in three other localities in Cambodia (C1, C2, and C5) and five localities in Laos (L4, L6, L8, L9, and L10). The
results indicate high connectivity among R. shameli populations from Cambodia and Laos. Based on these genetic
data, the ecological niche of bat SCoV2rCs was predicted using 21 records corresponding to the four localities
where bat viruses were previously d etected1,6–8 and the 17 localities where bats showed the same CO1 haplotype
than virus-positive bats (data set B: 21 points; see online supplemntary Table S1 for details). The AUC was 0.96.
The value was > 95% CI null-model’s AUCs (0.81), indicating that the model performs significantly better than
a random model (see online supplementary Fig. S3). The areas showing the highest probabilities of occurrence
(highlighted in green in Fig. 5b) include four main geographic areas: (i) southern Yunnan, northern Laos and
bordering regions in northern Thailand and northwestern Vietnam; (ii) southern Laos, southwestern Vietnam,
and northeastern Cambodia; (iii) the Cardamom Mountains in southwestern Cambodia and the East region of
Thailand; and (iv) the Dawna Range in central Thailand and southeastern Myanmar.
Our results show that bat SCoVrCs and SCoV2rCs have different ecological niches: that of SCoVrCs covers
mainly China and several adjacent countries and extends to latitudes between 18° and 43°N, whereas that of
SCoV2rCs covers northern mainland Southeast Asia and extends to latitudes between 10° and 24°N. Most Rhi-
nolophus species involved in the ecological niche of SCoVrCs have to hibernate in winter when insect populations
become significantly less abundant. This may be different for most Rhinolophus species involved in the ecological
niche of SCoVrC2s. Since this ecological difference may be crucial for the dynamics of viral transmission among
bat populations, it needs to be further studied through comparative field surveys in different regions of China
and Southeast Asia. The ecological niches of SCoVrCs and SCoV2rCs slightly overlap in the zone including
southern Yunnan, northern Laos, and northern Vietnam (Figs. 4, 5b). This zone corresponds to the northern
edge of tropical monsoon c limate23. Highly divergent sarbecoviruses of the two main lineages SCoVrCs and
SCoV2rCs are expected to be found in sympatry in this area. This is confirmed by the discovery of both SCoVrCs
and SCoV2rCs in horseshoe bats collected in southern Yunnan1,6,21. Collectively, these data suggest that genomic
recombination between viruses of the two divergent lineages are more likely to occur in bats roosting, at least
seasonally, in the caves of these regions. Since highly recombinant viruses can threaten the benefit of vaccination
campaigns, southern Yunnan, northern Laos, and northern Vietnam should be the targets of closer surveillance.
Mainland Southeast Asia is the cradle of diversification of bat SCoV2rCs. Chinese researchers
have actively sought sarbecoviruses in all Chinese provinces after the 2002–2004 SARS outbreak. They found
many bat S CoVrCs16,20,21 but only two SCoV2rCs1,5 and both of them were discovered in southern Yunnan, the
Chinese province bordering Southeast Asia. The ecological niches predicted herein for bat sarbecoviruses sug-
gest that SCoVrCs are dominant in China (Fig. 4) while SCoV2rCs are present mostly in Southeast Asia (Fig. 5).
This means that viruses similar to SARS-CoV-2 have been circulating for several decades throughout Southeast
Asia, and that different species of bats have exchanged these viruses in the caves they inhabit. The data avail-
able on human cases and deaths caused by the COVID-19 p andemic2 indirectly support the hypothesis that the
cradle of diversification of bat SCoV2rCs is mainland Southeast Asia, and in particular the areas highlighted in
green in Fig. 5b. Indeed, human populations in Cambodia, Laos, Thailand, and Vietnam appear to be much less
affected by the COVID-19 pandemic than other countries of the region, such as Indonesia, Malaysia, Myanmar,
and the Philippines (Fig. 6). This suggests that some human populations of Cambodia, Laos, Thailand, and Viet-
nam, in particular rural populations living in contact with wild animals for several generations, have a better
immunity against SCoV2rCs because they have been regularly contaminated by bats and/or infected secondary
hosts such as pangolins.
Pangolins contaminated by bats in Southeast Asia. Apart from bats, the Sunda pangolin (Manis
javanica) and Chinese pangolin (Manis pentadactyla) are the only wild animals in which viruses related to
SARS-CoV-2 have been found so far. However, these discoveries were made in a rather special context, that of
pangolin trafficking. Several sick pangolins were seized by Chinese customs in Yunnan province in 2017 (unpub-
lished data), in Guangxi province in 2017–201824 and in Guangdong province in 2 01925. Even if the viruses
sequenced in pangolins are not that close to SARS-CoV-2 (one was 85% identical and the other 90%), they indi-
cate that at least two sarbecoviruses could have been imported into China well before the emergence of COVID-
19 epidemic. Indeed, it has been shown that Sunda pangolins collected from different Southeast Asian regions
have contaminated each other while in captivity on Chinese territory3. It has been estimated that 43% of seized
pangolins were infected by at least one SARS-CoV-2-like virus3. Such a high level of viral prevalence and the
symptoms of acute interstitial pneumonia detected in most dead p angolins24 indicate that captive pangolins are
highly permissive to infection by SARS-CoV-2-like viruses. The question remained on how the Sunda pangolins
became infected initially. Could it have been in their natural Southeast Asian environment, before being cap-
tured? The discovery of two new viruses close to SARS-CoV-2 in bats from Cambodia and Thailand7,8 supports
this hypothesis, as Rhinolophus bats and pangolins can meet, at least occasionally, in forests of Southeast Asia,
possibly in caves, tree hollows or burrows. Further substantiating this hypothesis, the geographic distribution of
Manis javanica26 overlaps the ecological niche here predicted for bat SCoV2rCs (Fig. 5), and SARS-CoV-2 neu-
Scientific Reports | (2021) 11:14276 | https://doi.org/10.1038/s41598-021-93738-z 7
Vol.:(0123456789)www.nature.com/scientificreports/
Cases / million
20000 19164
18000
16000
14000
12000 11545
Countries partially included in the
10000 ecological niche of bat SCoV2rCs
8000
6768
6000
4000
2097 2609 2638
2000
267 93
0
Laos Cambodia Myanmar Philippines
Vietnam Thailand Indonesia Malaysia
0
0.4 0.7
-20
16 19
-40
-60
59
-80
-100
-120 108
-140
-160
-180
-200 188
199
Deaths / million
Figure 6. Number of COVID-19 patients per million inhabitants (in blue) and deaths per million inhabitants
ebsite2 on June 08,
(in red) for the different countries of Southeast Asia. Data extracted from the Worldometers w
2021. The figure was drawn in Microsoft Excel and PowerPoint (version 16.16.27).
tralizing antibodies have been recently detected in one of the ten pangolin sera sampled from February to July
2020 from three wildlife checkpoint stations in Thailand6. Collectively, these data strengthen the hypothesis that
pangolin trafficking is responsible for multiple exports of viruses related to SARS-CoV-2 to C hina3.
Methods
DNA extraction and sequencing. Tissue samples (n = 144) of morphologically identified bats of R.
acuminatus (n = 10), R. affinis (n = 57), R. malayanus (n = 14), and R. shameli (n = 63) were analysed for this
study. These bats were captured with mist nets and harp-traps during several field surveys in Cambodia (2010),
Laos (2007) and Vietnam (2011) to promote bat conservation. In 2007, the Muséum national d’Histoire naturelle
(MNHN, Paris, France) was mandated by UNESCO and the World Heritage House of Luang Prabang to con-
duct a mammal survey in northern Laos. In 2010, the MNHN was mandated by UNESCO and the National
Authority of Preah Vihear to conduct a mammal survey in northern Cambodia. Field surveys in Vietnam were
authorized by the Forest Protection Department of the Ministry of Agriculture and Rural Development, the local
manager boards of different protected areas (see online supplementary Table S1), and the Institute of Ecology
and Biological Resources (IEBR, Hanoi, Vietnam). The animals were handled according to guidelines and rec-
ommendations of the American Society of M ammologists27. They were measured, photographed and identified
by the authors (AH, GS and VTT). Tissue samples were taken from the chest muscles of voucher specimens or
from the patagium (biopsy punches; 2 mm diameter) of released bats. Samples were preserved in 95% ethanol.
Total DNA was extracted using QIAGEN DNeasy Tissue Kit (Qiagen, Germany) in accordance with the
manufacturer’s instructions. The barcode fragment of the CO1 gene (657 bp) was amplified and sequenced using
the primers UTyr and C1L70528. PCR amplifications of the CO1 gene were performed as previously published29.
PCR products were purified using ExoSAP Kit (GE Healthcare, UK) and sequenced using the Sanger method on
an ABI 3730 automatic sequencer at the Centre National de Séquençage (Genoscope) in Evry (France). Haplo-
types were assembled with forward and reverse eletcropherograms using Sequencher 5.1 (Gene Codes Corpora-
tion, Ann Arbor, MI, USA). No gaps and stop codons were found in the CO1 sequences after translation into
Scientific Reports | (2021) 11:14276 | https://doi.org/10.1038/s41598-021-93738-z 8
Vol:.(1234567890)www.nature.com/scientificreports/
amino-acids. Sequences generated for this study were deposited in the GenBank database (accession numbers
MW712891-MW713034) (see online supplementary Table S1).
Analyses of CO1 sequences. Our sequences were aligned with 199 additional CO1 sequences down-
loaded from GenBank. Note that the CO1 sequences of seven bats found positive for viruses closely related to
SARS-CoV-21,5,6 were assembled on Geneious Prime 2020.0.3 (Biomatters Ltd., Auckland, New Zealand) by
mapping available SRA data to a CO1 reference. Sequences were aligned using AliView 1.2230. Our final CO1
alignments contain 37 sequences for R. acuminatus, 44 sequences for R. malayanus, 82 sequences for R. shameli,
and 180 sequences for R. affinis. These four alignments were analysed in PopART 1.513 to construct haplotype
networks using the median joining method with equal weights for all mutations. The 62 localities where bats
were sampled are shown in the map of Fig. 2 and their geographic coordinates are detailed in online supplemen-
tary Table S1.
Prediction of ecological niches. For bat SCoVrCs, the ecological niche was inferred using GPS data col-
lected for viruses published during the last two decades. The list of the 19 available geographic records is pro-
vided in online supplementary Table S2. For bat SCoV2rCs, the ecological niche was initially predicted using
the four geographic localities where viruses were previously d etected1,5–7: two in Yunnan, one in northern Cam-
bodia, and one in eastern Thailand (data set A). However, the use of only four records is questionable since Van
Proosdij et al.22 have estimated that a minimum of 13 records is required to develop accurate distribution models
for widespread taxa. For that reason, we used a genetic approach to increase the number of geographic records.
Since the detection of identical CO1 sequences in different bat populations is indicative of recent dispersal events
of females, we also selected the 17 geographic records where bats showed the same CO1 haplotypes than virus-
positive bats (data set B: 21 points; see online supplementary Table S1).
For each of the three data sets (bat SCoVrCs; data sets A and B for bat SCoV2rCs), the 19 bioclimatic variables
available in the WorldClim d atabase31 were studied for an area corresponding to the minimum and maximum
latitudes and longitudes of the selected points (19 points for bat SCoVrCs; 4 and 21 points, respectively for the
SCoV2rCs data sets A and B) and the caret R p ackage32 was used to determine the least correlated variables
(|r|< 0.7)33. For bat SCoVrCs, the following five predictor bioclimatic variables were retained: Bio3 (isothermal-
ity), Bio4 (temperature seasonality), Bio5 (maximum temperature of the warmest month), Bio15 (precipitation
seasonality), and Bio18 (precipitation of the warmest quarter). For data set A, the following seven predictor
bioclimatic variables were retained: Bio3, Bio7 (temperature annual range), Bio10 (mean temperature of the
warmest quarter), Bio13 (precipitation of the wettest month), Bio14 (precipitation of driest month), Bio15,
and Bio18. For data set B, the following seven predictor bioclimatic variables were selected: Bio2 (mean diur-
nal range), Bio3, Bio7, Bio10, Bio13, Bio15, Bio17 (precipitation of the driest quarter), and Bio18. Ecological
niche modelling was performed with the MaxEnt algorithm using ENMTools in R 34. The MaxEnt approach was
chosen for its ability to work with presence-only data sets and to produce results with a low sample size35. The
area under the curve (AUC) of the receiver operating characteristic plot was used as a first measure of model
accuracy, a value of 0.5 indicating model accuracy not better than random, and a value of 1 indicating perfect
model fit36,37. To test for sampling bias, the distribution model using all selected localities was tested against a
null model developed by 1000 times drawing an equal number of random points from the entire study area37.
The position of the AUC value was tested against the 95% confidence interval (CI) of the 1000 AUC values of the
null-models. If the AUC value is ≥ 95% CI null-model’s AUCs, the model is considered performing significantly
better than a random m odel37.
Ethical statement. Ethical review and approval were not available for our study because the field missions
were carried out between 2004 and 2011, i.e., before the creation of the ethical committee at the Muséum national
d’Histoire naturelle. However, the field studies were carried out in compliance with the ARRIVE guidelines.
Data availability
DNA sequences generated for this study were deposited in the GenBank database (Accession Numbers
MW712891-MW713034).
Received: 13 April 2021; Accepted: 29 June 2021
References
1. Zhou, P. et al. A pneumonia outbreak associated with a new coronavirus of probable bat origin. Nature 579, 270–273. https://doi.
org/10.1038/s41586-020-2012-7 (2020).
2. COVID-19 Coronavirus pandemic. https://www.worldometers.info/coronavirus/. downloaded on June 08, 2021.
3. Hassanin, A., Grandcolas, P. & Veron, G. Covid-19: natural or anthropic origin?. Mammalia 85, 1–7. https://doi.org/10.1515/
mammalia-2020-0044 (2021).
4. Walker, P. J. et al. Changes to virus taxonomy and the statutes ratified by the international committee on taxonomy of viruses.
Arch. Virol. 165, 2737–2748. https://doi.org/10.1007/s00705-020-04752-x (2020).
5. Zhou, H. et al. A novel bat coronavirus closely related to SARS-CoV-2 contains natural insertions at the S1/S2 cleavage site of the
spike protein. Curr. Biol. 30, 3896. https://doi.org/10.1016/j.cub.2020.09.030 (2020).
6. Wacharapluesadee, S. et al. Evidence for SARS-CoV-2 related coronaviruses circulating in bats and pangolins in Southeast Asia.
Nat. Commun. 12, 972. https://doi.org/10.1038/s41467-021-21240-1 (2021).
7. Hul, V. et al. A novel SARS-CoV-2 related coronavirus in bats from Cambodia. https://doi.org/10.1101/2021.01.26.428212
(submitted).
Scientific Reports | (2021) 11:14276 | https://doi.org/10.1038/s41598-021-93738-z 9
Vol.:(0123456789)www.nature.com/scientificreports/
8. Li, W. et al. Bats are natural reservoirs of SARS-like coronaviruses. Science 310, 676–679. https://doi.org/10.1126/science.11183
91 (2005).
9. Drexler, J. F. et al. Genomic characterization of severe acute respiratory syndrome-related coronavirus in European bats and clas-
sification of coronaviruses based on partial RNA-dependent RNA polymerase gene sequences. J. Virol. 84, 11336–11349. https://
doi.org/10.1128/JVI.00650-10 (2010).
10. Tao, Y. & Tong, S. Complete genome sequence of a severe acute respiratory syndrome-related coronavirus from Kenyan bats.
Microbiol. Resour. Announc. 8, e00548-19. https://doi.org/10.1128/MRA.00548-19 (2019).
11. The IUCN Red List of Threatened Species. Version 2020-3. https://www.iucnredlist.org. Downloaded on 23 February 2021.
12. Boni, M. F. et al. Evolutionary origins of the SARS-CoV-2 sarbecovirus lineage responsible for the COVID-19 pandemic. Nat.
Microbiol. 5, 1408–1417. https://doi.org/10.1038/s41564-020-0771-4 (2020).
13. Leigh, J. W. & Bryant, D. PopART: Full-feature software for haplotype network construction. Methods Ecol. Evol. 6, 1110–1116.
https://doi.org/10.1111/2041-210X.12410 (2015).
14. Thong, V.D., Thanh, H.T., Soisook, P. & Csorba, G. Rhinolophus acuminatus. The IUCN Red List of Threatened Species
e.T19520A21974227. https://doi.org/10.2305/IUCN.UK.2019-3.RLTS.T19520A21974227.en. (2019).
15. Ith, S. et al. Taxonomic implications of geographical variation in Rhinolophus affinis (Chiroptera: Rhinolophidae) in mainland
Southeast Asia. Zool. Stud. 54, e31. https://doi.org/10.1186/s40555-015-0109-8 (2015).
16. Burgin, C. J. et al. Illustrated Checklist of the Mammals of the World Vol. 2 (Lynx Edicions, 2020).
17. Fan, Y., Zhao, K., Shi, Z. L. & Zhou, P. Bat coronaviruses in China. Viruses 11, 210. https://doi.org/10.3390/v11030210 (2019).
18. Francis, C. Field Guide to the Mammals of South-East Asia (Bloomsbury, 2019).
19. Smith, A. T. & Xie, Y. A Guide to the Mammals of China (Princeton University Press, 2008).
20. Han, Y. et al. Identification of diverse bat alphacoronaviruses and betacoronaviruses in China provides new insights into the evolu-
tion and origin of coronavirus-related diseases. Front. Microbiol. 10, 1900. https://doi.org/10.3389/fmicb.2019.01900 (2019).
21. Hu, D. et al. Genomic characterization and infectivity of a novel SARS-like coronavirus in Chinese bats. Emerg. Microbes Infect.
7, 154. https://doi.org/10.1038/s41426-018-0155-5 (2018).
22. van Proosdij, A. S. J., Sosef, M. S. M., Wieringa, J. J. & Raes, N. Minimum required number of specimen records to develop accurate
species distribution models. Ecography 39, 542–552. https://doi.org/10.5061/dryad.8sb8v (2016).
23. Song, Y., Achberger, C. & Linderholm, H. W. Rain-season trends in precipitation and their effect in different climate regions of
China during 1961–2008. Environ. Res. Lett. 6, 034025. https://doi.org/10.1088/1748-9326/6/3/034025 (2011).
24. Lam, T. T. et al. Identifying SARS-CoV-2-related coronaviruses in Malayan pangolins. Nature 583, 282–285. https://doi.org/10.
1038/s41586-020-2169-0 (2020).
25. Liu, P., Chen, W. & Chen, J. P. Viral metagenomics revealed Sendai virus and coronavirus infection of Malayan pangolins (Manis
javanica). Viruses 11, 979. https://doi.org/10.3390/v11110979 (2019).
26. Challender, D. et al. Manis javanica. The IUCN Red List of Threatened Species 2019: e.T12763A123584856. https://doi.org/10.
2305/IUCN.UK.2019-3.RLTS.T12763A123584856.en. (2019).
27. Sikes, R.S., Gannon W.L., and The Animal Care and Use Committee of the American Society of Mammalogists. Guidelines of the
American Society of Mammalogists for the use of wild mammals in research. J. Mammal. 92, 235–253. https://doi.org/10.1644/
10-MAMM-F-355.1 (2011).
28. Hassanin, A. et al. Pattern and timing of diversification of Cetartiodactyla (Mammalia, Laurasiatheria), as revealed by a compre-
hensive analysis of mitochondrial genomes. C. R. Biol. 335, 32–50. https://doi.org/10.1016/j.crvi.2011.11.002 (2012).
29. Tu, V. T. et al. Integrative taxonomy of the Rhinolophus macrotis complex (Chiroptera, Rhinolophidae) in Vietnam and nearby
regions. J. Zool. Syst. Evol. Res. 55, 177–198. https://doi.org/10.1111/jzs.12169 (2017).
30. Larsson, A. AliView: A fast and lightweight alignment viewer and editor for large data sets. Bioinformatics 30, 3276–3278. https://
doi.org/10.1093/bioinformatics/btu531 (2014).
31. Hijmans, R. J., Cameron, S. E., Parra, J. L., Jones, P. G. & Jarvis, A. Very high resolution interpolated climate surfaces for global
land areas. Int. J. Climatol. 25, 1965–1978. https://doi.org/10.1002/joc.1276 (2005).
32. Kuhn, M. Building predictive models in R using the caret package. J. Stat. Softw. 28, 1–26. https://doi.org/10.18637/jss.v028.i05
(2008).
33. Dormann, C. F. et al. Collinearity: A review of methods to deal with it and a simulation study evaluating their performance.
Ecography 36, 27–46. https://doi.org/10.1111/j.1600-0587.2012.07348.x (2013).
34. Warren, D. L. et al. ENMTools 1.0: An R package for comparative ecological biogeography. Ecography 44, 504–511. https://doi.
org/10.1111/ecog.05485 (2021).
35. Wisz, M. S. et al. Effects of sample size on the performance of species distribution models. Divers. Distrib. 14, 763–773. https://
doi.org/10.1111/j.1472-4642.2008.00482.x (2008).
36. Fielding, A. H. & Bell, J. F. A review of methods for the assessment of prediction errors in conservation presence/absence models.
Environ. Conserv. 24, 38–49. https://doi.org/10.1017/S0376892997000088 (1997).
37. Raes, N. & ter Steege, H. A null-model for significance testing of presence-only species distribution models. Ecography 30, 727–736.
https://doi.org/10.1111/j.2007.0906-7590.05041.x (2007).
Acknowledgements
In Cambodia, we would like to acknowledge T.D. Vong, V. Hul and S. In for their support during the field surveys,
and C. Garnero-Morena, G. Diffloth, B. Kilian, A. Beschaouch and N. Hayashi-Denis for their assistance. The
field mission was organized by UNESCO under the permissions of the National Authority for Preah Vihear, the
President, His Excellency Mr. Chuch Phoeurn and the Director of the Preah Vihear temple, Prof. Hang Soth.
In Laos, we would like to thank N. Beevang, J. Fuchs, E. Ifticene, and S. Xaythany for their support during the
field surveys, and C. Bear Khue, F. Bouvier, C. Hatten, R. Humphrey, A.M. Ohler, P. Rousseau, Mr. Tipavanh, M.
Thoummabouth, K. Valakone, Y. Varelides, and A.G. Verdier for their assistance. The fieldwork was supported
and organized by the UNESCO and « La Maison du Patrimoine » (World Heritage House) of Luang Prabang,
and the Phongsaly Forest Conservation and Rural Development Project, a Lao-European cooperation. Survey
permission and authorization for tissue samples collecting were granted by the Ministry of Agriculture and For-
estry, Department of Livestock and Fisheries. In Vietnam, we would like to acknowledge P.D. Tien (IEBR), D.Q.
Thang and N.X. Nghia (Ngoc Linh NR) and N.T. Son (Vu Quang NP) for their support during the field surveys.
We are grateful to L.X. Canh, T.H. Thai, N.V. Sinh and other colleagues of the IEBR, Hanoi for administrative
assistance. The field research was done under the permissions of the People’s Committees of numerous provinces
and the Vietnamese Ministry of Agriculture and Rural Development (Vietnam Administration of Forestry). The
fieldwork was also supported by the “Société des Amis du Muséum et du Jardin des Plantes” and the National
Research, Development and Innovation Fund of Hungary NKFIH KH130360. M.C. is funded by the SCOR
Corporate foundation for Science. We are grateful to C. Bonillo, C. Ferreira, J. Lambourdière, and J. Utge (UMS
Scientific Reports | (2021) 11:14276 | https://doi.org/10.1038/s41598-021-93738-z 10
Vol:.(1234567890)www.nature.com/scientificreports/
2700, MNHN) for their technical assistance. We would like to thank Huw Jones and Anne Ropiquet for helpful
comments on the first version of the manuscript. This research was funded by the AAP RA-COVID-19, Grant
Number ANR-21-CO12-0002, the CNRS, the MNHN, the INRA and the CEA (Genoscope).
Author contributions
A.H. wrote the main manuscript text; V.T.T. and A.H. sequenced the CO1 barcodes; V.T.T. and A.H. prepared
Table S1; A.H. prepared Figs. 1, 2, 3, and 6, and Table S2; M.C. and A.H. prepared Figs. 4, 5, and S1–S3; A.H,
G.C., and V.T.T. collected bats in different localities of Southeast Asia. All authors reviewed the manuscript.
Competing interests
The authors declare no competing interests.
Additional information
Supplementary Information The online version contains supplementary material available at https://doi.org/
10.1038/s41598-021-93738-z.
Correspondence and requests for materials should be addressed to A.H.
Reprints and permissions information is available at www.nature.com/reprints.
Publisher’s note Springer Nature remains neutral with regard to jurisdictional claims in published maps and
institutional affiliations.
Open Access This article is licensed under a Creative Commons Attribution 4.0 International
License, which permits use, sharing, adaptation, distribution and reproduction in any medium or
format, as long as you give appropriate credit to the original author(s) and the source, provide a link to the
Creative Commons licence, and indicate if changes were made. The images or other third party material in this
article are included in the article’s Creative Commons licence, unless indicated otherwise in a credit line to the
material. If material is not included in the article’s Creative Commons licence and your intended use is not
permitted by statutory regulation or exceeds the permitted use, you will need to obtain permission directly from
the copyright holder. To view a copy of this licence, visit http://creativecommons.org/licenses/by/4.0/.
© The Author(s) 2021
Scientific Reports | (2021) 11:14276 | https://doi.org/10.1038/s41598-021-93738-z 11
Vol.:(0123456789)You can also read