No time to rest: seasonal dynamics of non structural carbohydrates in twigs of three Mediterranean tree species suggest year round activity - Nature
←
→
Page content transcription
If your browser does not render page correctly, please read the page content below
www.nature.com/scientificreports
OPEN No time to rest: seasonal dynamics
of non‑structural carbohydrates
in twigs of three Mediterranean
tree species suggest year‑round
activity
Anna M. Davidson1,2*, Sylvia T. Le1, Katelyn B. Cooper1, Eden Lange1 & M. A. Zwieniecki1
Perennial plants in temperate climates evolved short and long-term strategies to store and manage
reserves in the form of non-structural carbohydrates (NSC; soluble sugars (SC) and starch (St)).
NSC storage allows plants to survive seasonal periods of photosynthetic inactivity (dormancy). To
study year-to-year seasonal patterns of trees’ NSC dynamics that control phenology and yields, we
established a large scale, multi-year study called the “Carbohydrate Observatory” using a citizen
science approach with ~ 590 sites throughout the Central Valley of California. Monthly sampling
tracked seasonal trends of starch and sugar levels in both xylem and phloem of twigs in Prunus
dulcis, Pistacia vera and Juglans regia. Presented is the initial technical analysis of the first 3 years.
With no exception, levels of reserves changed continuously throughout the year suggesting that
even during dormancy, the average concentration of NSC, starch and sugars varies seasonally. In
general, carbohydrate reserves are highest entering dormancy. During winter, NSCs slowly decrease
to depletion during bloom time and remain low during summer until recovery near harvest. Starch is
the major reserve compound in the wood of P. dulcis and P. vera while soluble sugars are the major
reserves in J. regia. NSC content fluctuates throughout a season and significantly varies between years
suggesting intrinsic and climatic effects on trees’ energy reserves.
Most basic plant functions, like growth, energy metabolism, maintenance respiration, osmosis and transport,
are dependent on non-structural carbohydrates (NSC). Generally, NSC exist as two pools: chemically active
soluble carbohydrates (SC) present as mono and disaccharide sugars like glucose, fructose, and sucrose and
sometimes sugar alcohols like sorbitol, and inactive, insoluble starch (St)1–3. These two pools of carbohydrates
are under biological control that evolved to meet demands of species-specific internal (physiology) and external
(environmental) properties4. Allocation of NSC to the aforementioned functions must be balanced with storage
in order to buffer asynchronous supply and demand on different temporal and spatial scales5. All plants evolved
the capacity to overcome a daily cycle of discontinuous photosynthate availability by accumulating carbohydrate
ights6–13. It is also known that perennial plants had to evolve long term strategies to acquire
reserves to survive n
energy reserves as they cycle through periods of growth and reproduction (activity) that are associated with
photosynthetic activity and periods of inactivity (dormancy)4,14.
These long-term strategies require that during the times of activity, NSC reserves are accumulated and allo-
cated to processes that require energy or structural input such as growth, reproduction, and defense. To survive
the continuous metabolic requirements during dormancy and later allow for the resumption of post dormancy
growth (spring flowering and leafing), deciduous perennial plants must acquire and store an ample supply of
carbohydrates in their woody t issue1,15,16. During bud break, fast and efficient mobilization of stored carbohy-
drates are needed to sustain bud growth3,17,18. Thus, the amount of NSC reserves ahead of the winter should be
enough to sustain winter respiration and spring demands for bloom and leafing. Species vary in their seasonal
pattern of NSC reserve pools based upon vegetative habit, reproduction, growth, and duration of d ormancy4,14.
These evolved NSC management traits are being challenged now by fast climatic changes such as the rise of global
1
Department of Plant Sciences, University of California Davis, Davis, CA 95616, USA. 2Present address:
Department of Natural Resources and the Environment, Cornell University, Ithaca, NY 14853, USA. *email:
amd355@cornell.edu
Scientific Reports | (2021) 11:5181 | https://doi.org/10.1038/s41598-021-83935-1 1
Vol.:(0123456789)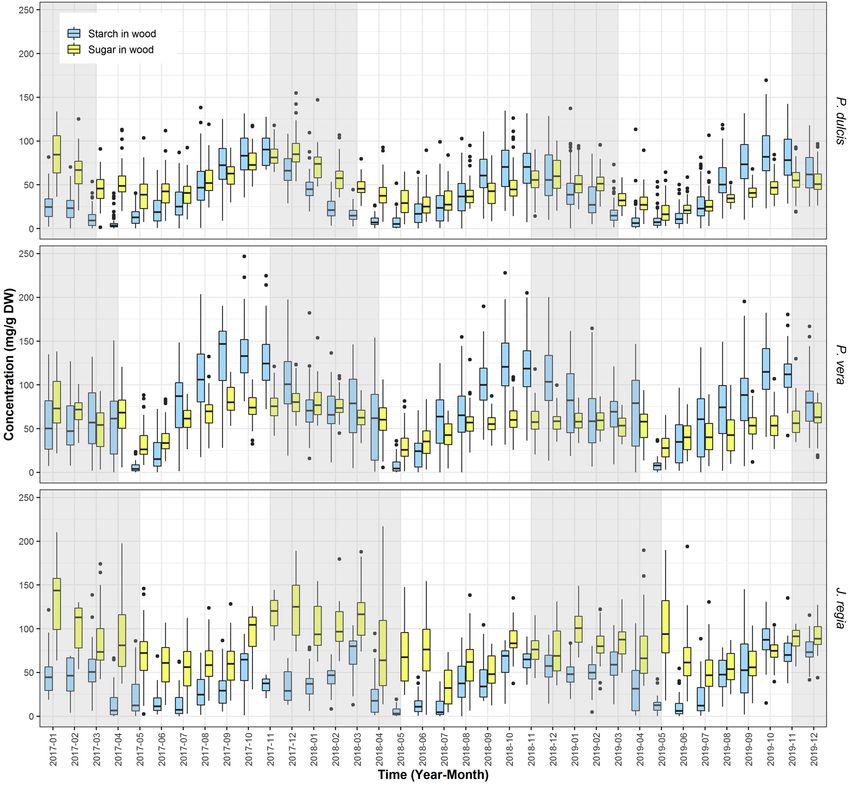
www.nature.com/scientificreports/
temperatures, the increase in the frequency of droughts, and the length and severity of winter with significant,
often detrimental, effects on tree p henology19–21 endangering the future of orchards and natural ecosystems.
Therefore, it is important to study inter-seasonality of NSC patterns, that occur during adverse conditions like
low temperature or prolonged drought10,22,23.
Interestingly, during the active growing period, the pools of NSC are relatively low and constant while the
highest variability of the NSC pools are observed during the time of dormancy and spring bloom24. As orchard
trees were presumably selected for high productivity in expense of energy reserves security, even small changes
to NSC management induced by climate change or management practices can disproportionally affect produc-
tivity and orchard health.
The conventional trend is that NSC reserves increase over the late growing season and decrease over the
dormant season. Furze et al.14 conducted a detailed within-year NSC study at the organ and whole tree level of
five dominant temperate tree species in the Northeast to quantify total NSC storage over the course of a year
and found that in general, whole-tree total NSC pools built up over the growing season and declined over the
dormant season. However, there are no long-term observational studies over multiple years that look at interan-
nual variability. Thus, the questions of how active and variable the pool of carbohydrate reserves in trees are and
when reserves are being used and replenished in respect to trees’ phenology and climatic conditions still remains
open. Therefore, to begin to understand intra and inter-seasonal dynamics and patterns of tree NSC, a large scale,
multi-year, multi-species study called the “Carbohydrate Observatory” was established in 2016, Using a citizen
science approach, samples were obtained from ~ 590 orchard sites throughout the Central Valley of California
(Fig. 1). This large-scale approach and monthly sampling allowed for the tracking of seasonal trends of starch
and sugar levels in both xylem and bark from twigs of three major tree nut species: Prunus dulcis, Pistacia vera
and Juglans regia. An interactive map and available NSC data are accessible via a dedicated website https://zlab-
carb-obser vatory.herokuapp.com/. The objective of this paper is to present a general overview of a multi-year
temporal pattern analysis of sugar, starch and total NSC dynamics between xylem and phloem tissues in three
tree species in respect to their differing phenology and bloom habit over the 3-year period from January 2017 to
December,-2019. P. dulcis is an insect pollinated perfect flower species, J. regia is a monoecious, wind pollinated
species and P. vera is a dioecious wind pollinated species (Table 1). These seasonal trends of multiple species lays
the framework for future phenology, climate, and management studies.
Materials and methods
Using a Citizen Science approach, growers spanning the entire Central Valley of California sent samples of cur-
rent-season wood and bark from twigs of P. dulcis (Mill. D.A Webb), P. vera L. and J. regia L. trees. This analysis
spans a time period from January, 2017 to December 2019. We analysed 590 orchard sites, with a total of 5330
individual observations, split between P. dulcis (2502) P. vera (1781) and J. regia (1047). We encouraged growers
to collect samples once a month, although frequency and participation level varied over time.
A specific unified protocol for sample collection required that one current season twig from three trees per
orchard were cut at the base of the twig where the current season’s wood met last year’s wood. The bark from the
lower 10 cm of the twig was removed using a razor blade. Both the bark and the wood of the three twigs were
put in a paper envelope and mailed to the laboratory for NSC analysis. In total, we performed 31,980 soluble
sugars and 31,980 starch analyses for bark and wood. It is important to note that prior to the project we tested
the integrity of the NSC content over shipping time and found that sugar and starch do not break down within
4 days (the time longer then required for local mail to reach the laboratory from anywhere in California).
Analysis of the NSC integrity was tested for each species on five separate twigs. Each twig was collected using
the standard protocol and separated to four sections. One piece was immediately place in the oven while the
remaining samples were left in the shipping envelopes. On day 2 another piece was removed from the envelope,
similarly another sample was taken on day 3 and 4 (4 days is the maximum time samples are spent in shipping
from anywhere in California before being placed in the drying oven). We used a linear mixed model with twig
as random factor to determine presence of changes in NSC, SC and St content in wood and bark. There was
no missing data. Results of the analysis are presented in Table 2. In no case, did the time spent in the envelope
significantly affect the centration of NSC.
Upon arrival, samples were put in the dryer for 48 h at 75 °C. The bark and wood were chopped into small
< 1 mm pieces separately and ~ 100 mg of each were ground into a fine powder (~ 1 µm) using a ball grinder
(MiniBeadbeater-96, Glen Mills Inc., NJ). To analyse for sugar and starch we used the previously described pro-
tocol from Leyva et al.26; with modifications described in Tixier et al.24. Specifically, 25 mg of powder per sample
was placed in 1.5 ml tubes. Tubes were then treated with 1 ml of sodium acetate buffer (0.2 M, pH 5.5), vortexed,
and incubated in a 70 °C water bath for 15 min and centrifuged (10 min at 21,000g). 50 µl of supernatant was
extracted and diluted in ultra-pure (UP) water (1:20 v:v) and vortexed. SC content was quantified from diluted
supernatant tubes using an anthrone/sulfuric acid colorizing reagent (0.1% (m:v) in 98% sulfuric acid) and read-
ing absorbance at 620 nm in a spectrophotometer. The remaining centrifuged tubes with the pellet and buffer
were used for starch quantification. To extract starch, the tubes were vortexed to suspend the pellet, boiled at
100 °C for 10 min to allow starch gelatinization and let sit for 20 min at room temperature (22 °C). Once cooled,
100 µl of amyglucosidase (7 units/ml−1, Sigma-Aldrich) and 100 µl amylase (0.7 units/ml−1, Sigma-Aldrich)
were added to the tubes and incubated for 4 h at 37 °C in a rotating incubator. Samples were then centrifuged
(10 min at 21,000g). 50 µl of supernatant was extracted and diluted in 1 ml UP water (1:20 v:v) and vortexed.
Total soluble sugar content was analysed using the same method described above. Starch content was determined
by subtracting original SC content from post-digestion SC content. All samples were plated on 96-well plates.
To account for any procedural variability (chemicals, timing, pipetting, temperature etc.), each plate contained
a glucose standard curve and wood/bark standard tissue samples with known SC and St content (four per plate)
Scientific Reports | (2021) 11:5181 | https://doi.org/10.1038/s41598-021-83935-1 2
Vol:.(1234567890)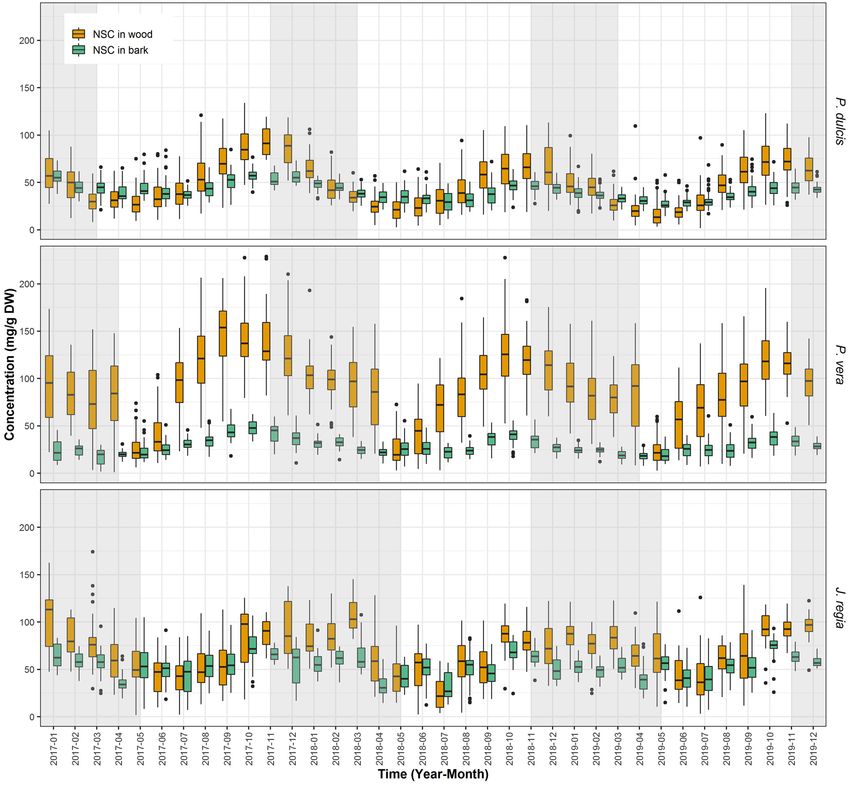
www.nature.com/scientificreports/
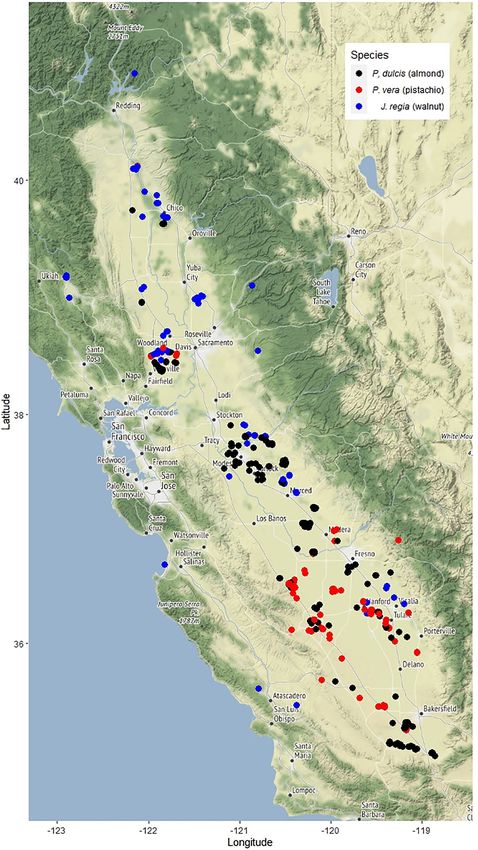
Figure 1. Map of the Central Valley of California depicting the locations of participating orchards of three
species (P. dulcis, J. regia, and P. vera). Each point may represent multiple sites that are close in latitude and
longitude (R version 3.6.3 package “ggplot2”25).
Species J. regia P. dulcis P. vera
Monoecious, male catkins, female terminal flowers in groups
Flowers Perfect on spurs Dioecious
of 2–5
Height 25–30 m 4–10 m 10 m
Bloom/leafing April February March
Harvest October August August
Origin Mountains of Asia Iran, Turkey, Central Asia Middle East, Central Asia
Table 1. Botany, phenology and origin of J. regia, P. dulcis, and P. vera.
Scientific Reports | (2021) 11:5181 | https://doi.org/10.1038/s41598-021-83935-1 3
Vol.:(0123456789)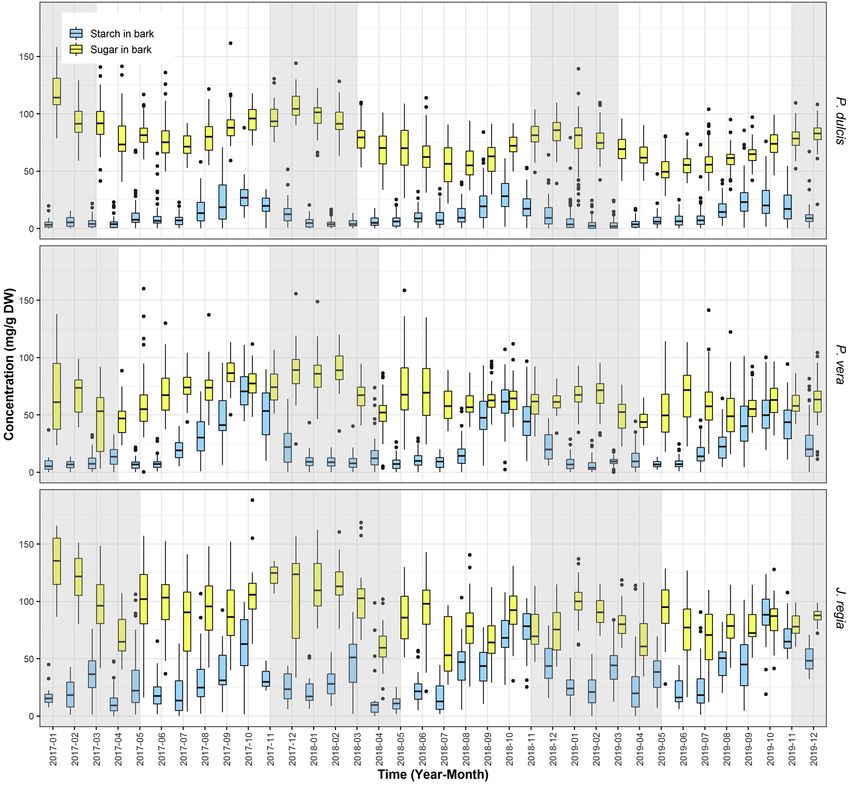
www.nature.com/scientificreports/

                                             Species     NSC form    Test results   Chisq       Df      Pr (> Chi sq.)
                                                                     Issue          273.6452    1       < 2e − 16***
                                                         SC          Days           0.1810      1       0.6705
                                                                     Tissue:days    0.0075      1       0.9312
                                             J. regia
                                                                     Tissue         157.7377    1       < 2e − 16***
                                                         Starch      Days           0.5476      1       0.4593
                                                                     Tissue:days    0.0061      1       0.9379
                                                                     Tissue         157.7377    1       < 2e − 16***
                                                         SC          Days           0.5476      1       0.4593
                                                                     Tissue:days    0.0061      1       0.9379
                                             P. dulcis
                                                                     Tissue         26.7213     1       2.35e − 07***
                                                         Starch      Days           2.1121      1       0.1461
                                                                     Tissue:days    0.8540      1       0.3554
                                                                     Tissue         2.8176      1       0.0033935**
                                                         SC          Days           1.1492      1       0.484893
                                                                     Tissue:days    7.1942      1       0.1302
                                             P. vera
                                                                     Tissue         348.7246    1       < 2e − 16***
                                                         Starch      Days           0.5559      1       0.4559
                                                                     Tissue:days    0.5625      1       0.4532

                                            Table 2.  Results of a linear mixed model analysis for the possible impact of time samples spent in a shipping
                                            envelope prior to drying. No significant impact up to 4 days was found between immediate and delayed drying
                                            in concertation of starch and soluble sugars for any of the three species. Significance codes: 0 ‘***’ 0.001 ‘**’
                                            0.01 ‘*’.

                                                         Total NSC   Wood NSC       Bark NSC        Wood SC      Wood starch   Bark SC     Bark starch
                                             P. dulcis   0.0007207   0.0007065      0.0120546       0.0035869    0.0007535     0.0074689   0.0026537
                                             P. vera     0.0011088   0.0013211      0.0017527       0.013528     0.0008455     0.0160282   0.0007386
                                             J. regia    0.0097848   0.0225551      0.0046629       0.1858203    0.0035793     0.0282376   0.0050683

                                            Table 3.  Kruskall Wallis test for seasonality in a time series with lag time of 12 months. Italics denote
                                            p < 0.05—significant seasonality.

                                            that were concurrently undergoing all steps in the same chemical analysis. The wood/bark standard tissue is a
                                            sample from a homogenous mix of several thousand ground samples leftover from a 2016 preliminary part of
                                            the study. We measured out 25 mg of 96 samples at of the mix and analyzed them for NSC (starch and sugar)
                                            using our protocol.
                                                For statistical analysis we used R. For Kruskal Wallis using ‘kw’ function from R package ‘seastests v0.14.2’
                                            with 12 months lag time. For the augmented Dickey Fuller (ADF) test we used ‘adf.test’ function from R package
                                            ‘tseries v0.10-47’. For ANOVA analysis to compare carbohydrate content between months in consecutive years,
                                            we used the ‘aov’ function from R package ‘stats v3.6.2’.

                                            Results
                                            Analysis of seasonality in carbohydrate content. In all three species, there was a general pattern of
                                            seasonal changes in carbohydrate content. The Kruskall Wallis test for seasonality (presence of seasonal perio-
                                            dicity) suggests that, with the only exception of soluble sugar content in the wood of J. regia, all NSC, St, and
                                            SC in bark and wood in all three species showed significant seasonal trends with a 12-month frequency (annual
                                            cycle) (Table 3). To determine the possibility of the unit root presence (test for stationarity, i.e. presence of
                                            significant interannual variation) in a time series, we used the Augmented Dickey Fuller (ADF) test. Based on
                                            the analysis we cannot reject the null hypothesis that there is a unit root for all three species, and NSC location/
                                            types. In all cases, the ADF test resulted in p > 0.05% (Table 4), thus suggesting that our time series may not be
                                            stationary and that there is a year-to-year variation. This technical analysis suggests the presence of unaccounted
                                            for, stochastic year-to-year variation and indicate need for future study to determine the origin of the variation.
                                            To determine which months were most affected by climatic variability, we used analysis of variance to compare
                                            carbohydrate content for particular months between years (Table 5). Generally, this analysis suggests the pres-
                                            ence of significant differences in P. dulcis and P. vera for both SC and St and to some extent in J. regia in the levels
                                            of sugars but not starch (Table 5).

                                            Total NSC.       In all three species, the average NSC content varies seasonally with species-specific patterns
                                            (Fig. 2). In general, NSC content expressed in mg of NSC per 1 g of twig dry mass (mg/g DW) was highest in

          Scientific Reports |   (2021) 11:5181 |                    https://doi.org/10.1038/s41598-021-83935-1                                                   4

Vol:.(1234567890)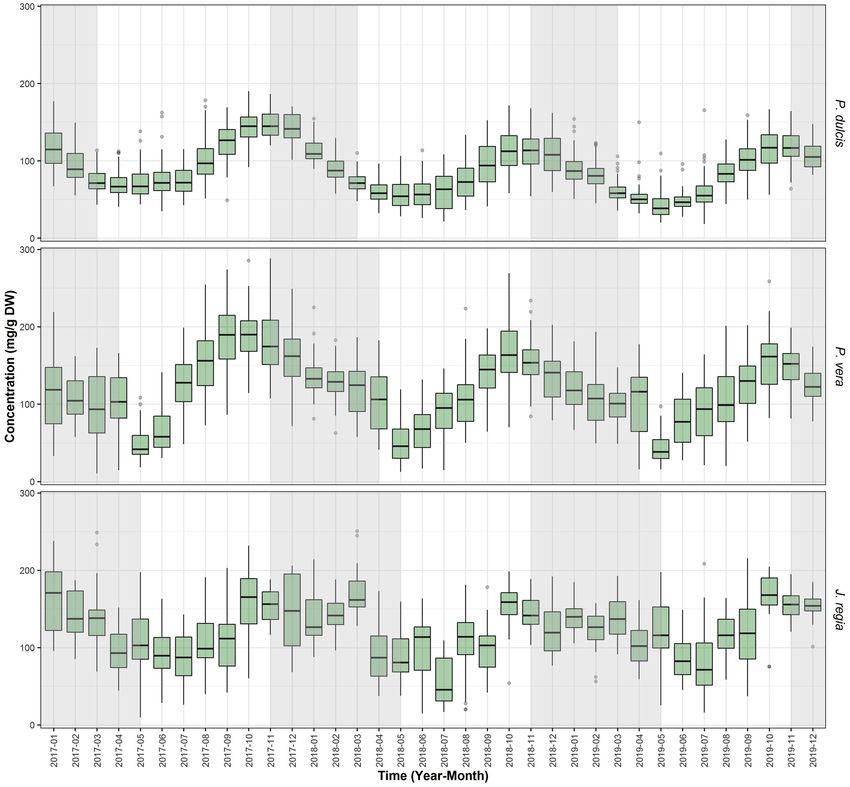
www.nature.com/scientificreports/

                                               Total NSC     Wood NSC     Bark NSC     Wood SC      Wood starch   Bark SC      Bark STARCH
                                   P. dulcis   0.576         0.587        0.962        0.779        0.6517        0.975        0.701
                                   P. vera     0.645         0.627        0.929        0.980        0.573         0.989        0.971
                                   J. regia    0.887         0.729        0.941        0.727        0.920         0.762        0.474

                                  Table 4.  Augmented Dickey Fuller (ADF) test for unit root in time series with lag time of 12 months.

                                   Month       Total NSC     Wood NSC     Bark NSC     Wood SC      Wood starch   Bark SC       Bark starch
                                   P.dulcis
                                   Jan         7.083E − 05   1.17E − 02   1.77E − 11   1.63E − 08   4.94E − 02    4.78E − 16    7.11E − 01
                                   Feb         0.0769662     5.58E − 01   4.00E − 06   2.91E − 04   6.27E − 01    3.69E − 09    1.75E − 01
                                   Mar         0.0007313     2.44E − 02   2.58E − 07   1.74E − 09   9.56E − 01    8.15E − 11    9.64E − 01
                                   Apr         0.0005371     4.29E − 02   9.29E − 10   1.12E − 11   9.13E − 01    4.21E − 11    6.98E − 01
                                   May         0.0492458     6.38E − 01   2.98E − 06   4.94E − 06   2.00E − 01    9.04E − 09    9.26E − 01
                                   Jun         0.1439405     7.55E − 01   1.46E − 07   5.85E − 06   1.29E − 01    5.32E − 10    4.40E − 01
                                   Jul         0.1606736     8.49E − 01   5.23E − 06   2.02E − 07   5.00E − 02    5.36E − 10    8.51E − 01
                                   Aug         0.0164891     4.66E − 01   2.10E − 09   1.82E − 04   8.72E − 01    6.35E − 09    6.73E − 02
                                   Sep         0.0574218     5.36E − 01   1.36E − 05   5.39E − 06   4.95E − 01    3.71E − 09    4.01E − 01
                                   Oct         0.0010045     1.64E − 02   1.25E − 08   5.80E − 05   1.21E − 01    1.70E − 10    7.12E − 01
                                   Nov         0.0180753     5.64E − 02   2.45E − 04   4.17E − 04   3.84E − 01    3.23E − 06    8.08E − 01
                                   Dec         0.0095215     1.82E − 01   3.31E − 07   2.24E − 03   7.24E − 01    4.65E − 08    3.55E − 01
                                   P. Vera
                                   Jan         7.12E − 02    1.35E − 01   6.30E − 03   1.16E − 01   2.08E − 01    4.70E − 03    5.02E − 02
                                   Feb         2.57E − 01    2.85E − 01   2.76E − 01   1.25E − 02   3.26E − 01    3.63E − 01    5.14E − 01
                                   Mar         4.66E − 02    7.18E − 02   8.99E − 03   1.16E − 04   5.05E − 01    4.00E − 04    7.52E − 01
                                   Apr         3.19E − 01    5.83E − 01   2.18E − 02   9.24E − 03   9.46E − 01    1.15E − 01    1.33E − 01
                                   May         4.95E − 02    9.53E − 02   1.73E − 02   9.43E − 04   4.70E − 01    5.97E − 03    5.44E − 01
                                   Jun         9.38E − 02    2.59E − 01   1.30E − 03   2.94E − 02   5.04E − 01    1.20E − 02    6.38E − 02
                                   Jul         6.30E − 02    1.57E − 01   1.45E − 03   1.65E − 03   6.20E − 01    6.00E − 05    1.88E − 01
                                   Aug         2.05E − 02    3.80E − 02   1.24E − 02   2.03E − 04   2.65E − 01    1.62E − 03    6.44E − 01
                                   Sep         1.48E − 02    3.30E − 02   4.26E − 03   3.34E − 03   1.14E − 01    5.58E − 03    3.67E − 02
                                   Oct         6.51E − 01    7.87E − 01   3.97E − 02   3.65E − 01   9.64E − 01    2.63E − 03    7.12E − 01
                                   Nov         1.65E − 01    2.89E − 01   1.33E − 01   1.32E − 02   8.53E − 01    2.95E − 01    6.02E − 01
                                   Dec         1.54E − 02    3.23E − 02   4.23E − 03   1.12E − 03   1.85E − 01    3.33E − 03    4.97E − 02
                                   J. regia
                                   Jan         5.17E − 01    2.09E − 01   9.91E − 01   9.12E − 01   1.93E − 02    3.31E − 02    2.53E − 02
                                   Feb         3.46E − 01    6.88E − 01   4.94E − 02   3.83E − 01   7.55E − 01    1.92E − 02    6.90E − 01
                                   Mar         5.00E − 02    1.38E − 02   1.38E − 01   3.90E − 01   1.50E − 03    8.49E − 01    1.04E − 02
                                   Apr         2.88E − 01    2.89E − 01   8.88E − 02   3.85E − 01   1.39E − 01    1.27E − 04    5.79E − 01
                                   May         2.98E − 01    5.07E − 01   1.55E − 01   1.20E − 01   7.01E − 01    3.04E − 04    2.01E − 01
                                   Jun         4.94E − 01    4.55E − 01   4.75E − 01   2.94E − 01   4.64E − 01    3.44E − 02    4.50E − 01
                                   Jul         2.05E − 01    1.41E − 01   4.56E − 01   3.53E − 01   2.80E − 04    1.43E − 01    9.43E − 03
                                   Aug         1.31E − 01    1.91E − 02   6.81E − 01   5.38E − 01   8.47E − 04    2.68E − 03    3.96E − 02
                                   Sep         3.62E − 01    1.68E − 01   1.59E − 01   3.23E − 01   1.30E − 01    1.60E − 02    4.57E − 01
                                   Oct         6.94E − 01    3.69E − 01   8.40E − 01   7.29E − 01   2.73E − 01    3.03E − 01    5.52E − 01
                                   Nov         9.21E − 01    7.42E − 01   9.32E − 01   9.37E − 01   1.81E − 01    2.13E − 01    4.03E − 01
                                   Dec         5.80E − 01    5.83E − 01   5.13E − 01   1.50E − 01   8.54E − 02    7.29E + 00    8.54E − 01

                                  Table 5.  Results of ANOVA analysis for presence of significant difference in content of carbohydrates between
                                  months in consecutive years. Italics denotes p < 0.05.

                                  P. vera and lowest in P. dulcis. The average maximum NSC content was observed in fall months (September to
                                  October) preceding the typical leaf senescence and ranged from 113 to 148 mg/g DW in P. dulcis, 156–189 mg/g
                                  DW for P. vera, and 154–165 mg/g DW in J. regia. These high levels were followed by the dormancy period dur-
                                  ing which, NSC content in branches is depleted prior to spring bud break. Throughout the bud break period,
                                  NSC depletion was continuous in P. dulcis but in both P. vera and J. regia we observed a characteristic increase
                                  in NSC content in April/May that coincides with leafing. Lowest levels of NSC were observed in April and May

Scientific Reports |   (2021) 11:5181 |                      https://doi.org/10.1038/s41598-021-83935-1                                            5

                                                                                                                                              Vol.:(0123456789)
www.nature.com/scientificreports/
Figure 2. Multiyear seasonal trends of total NSC of three species. Average concentration of total NSC (SC + St)
from all sites in California for P. dulcis, P. vera, and J. regia from January 2017 to December 2019. The lower
and upper hinges correspond to the first and third quartiles (the 25th and 75th percentiles). The upper whisker
extends from the hinge to the largest value no further than 1.5*IQR from the hinge (where IQR is the inter-
quartile range, or distance between the first and third quartiles). The lower whisker extends from the hinge to
the smallest value at most 1.5*IQR of the hinge. Grey shading reflects the dormancy period of each species.
in P. dulcis (45–71 mg/g DW), May in P. vera (45–52 mg/g DW) and July in J. regia (58–84 mg/g DW), which
typically coincides with the most active period of vegetative growth (diameter and height) and initial nut filling.
From June to July we observed a recovery of the NSC content to maximum in the fall (Fig. 2). This pattern was
repeated every year, although levels of carbohydrate reserves for P. dulcis and P. vera were significantly different
in consecutive years (Table 3) especially during winter. There were no significant differences in total NSC content
in J. regia.
NSC in wood and bark. In twigs, bark (cork, phloem and cambium), and xylem are tissues that have the
capacity to store NSC. For all three species, the general pattern of NSC content is similar to each other with
maximum in the fall and minimum in the early summer (Fig. 3). NSC content was expressed in mg per gram of
twig dry weight and adjusted for the contribution of bark and wood to total twig dry mass such that the sum of
the NSC in bark and wood equals the total NSC content provided on Fig. 2. In all three species, seasonal changes
of NSC content is much higher in the wood than in bark, with content in the wood being lower or equal to that
observed in bark during summer and higher to that observed in the fall. This pattern was most pronounced in P.
vera where NSC content in wood was three times higher than in bark during October (~ 120 to ~ 40 mg/g DW).
Scientific Reports | (2021) 11:5181 | https://doi.org/10.1038/s41598-021-83935-1 6
Vol:.(1234567890)www.nature.com/scientificreports/
Figure 3. Total NSC concentration in wood and bark in three species. Average concentration of total NSC
(Sc + ST) in wood (orange) and in bark (green) from all sites for P. dulcis, P. vera and J. regia from January 2017
to December 2019. The upper whisker extends from the hinge to the largest value no further than 1.5*IQR from
the hinge (where IQR is the inter-quartile range, or distance between the first and third quartiles). The lower
whisker extends from the hinge to the smallest value at most 1.5*IQR of the hinge. Grey shading reflects the
dormancy period of each species.
In P. dulcis wood NSC content was 1.5 times higher (~ 77 to 49 mg/g DW) in the fall than in bark and in J. regia
NSC content in the wood was only 1.3 times higher than in bark (~ 89 to 68 mg/g DW). Those differences were
very consistent in consecutive years. Absolute content of NSC in wood was relatively constant for each month
between years in all three species. However, content in the bark varied significantly among the years in P. vera
and P. dulcis but was invariable in J. regia (Table 3).
Starch and soluble sugars in bark. Soluble sugars were the dominant form of NSC reserves in the bark
of all three species (Fig. 4). In P. dulcis SC content varied from 23 to 53 mg/g DW and St content varied from 1.7
to 13 mg/g DW, in P. vera SC content varied from 14 to 29 while St content varied from 2 to 23 mg/g DW, and
in J. regia SC content varied from 26 to 57 with St varying from 4 to 37 mg/g DW. SC content was less variable
than in the wood tissue with variation being only ~ 2 times different between low content in spring and high in
winter. St content was much more variable. During summer, levels of St reserves in the bark were near complete
exhaustion (near < 5 mg/g DW) but recovered by fall (September–October) contributing significantly to the
NSC reserves. Surprisingly, the bark St reserves were depleted before the winter (by December) and remain low
through the rest of the dormancy period. This pattern was highly consistent across the 3 years of observations
Scientific Reports | (2021) 11:5181 | https://doi.org/10.1038/s41598-021-83935-1 7
Vol.:(0123456789)www.nature.com/scientificreports/
Figure 4. Starch and sugar in bark. Average concentration of starch (blue) and sugar (yellow) in bark from all
sites for P. dulcis, P. vera and J. regia from January 2017 to December 2019. The upper whisker extends from
the hinge to the largest value no further than 1.5*IQR from the hinge (where IQR is the inter-quartile range, or
distance between the first and third quartiles). The lower whisker extends from the hinge to the smallest value at
most 1.5*IQR of the hinge. Grey shading reflects the dormancy period of each species.
and similar in all three species. Year-to-year SC content variation in bark was significant in all three species while
starch content only varied in J. regia (Table 3).
Starch and soluble sugars in wood. Both SC and St content in the wood undergo significant seasonal
fluctuation. All three species seemed to follow similar patterns. Highest levels of soluble sugars and starch
occurred in the fall and lasted through the winter, while lowest levels of starch and soluble sugars occurred dur-
ing spring and early summer (Fig. 5). In P. dulcis SC content varied from 10 to 48 mg/g DW and St content varied
from 3.5 to 48 mg/g DW, in P. vera SC content varied from 19 to 57 mg/g DW while St content varied from 4 to
92 mg/g DW, and in J. regia SC content varied from 19 to 76 mg/g DW with St varying from 3 to 50 mg/g DW.
In general, starch provides a much higher contribution to NSC content in wood than in bark and in P. vera and
P. dulcis wood starch is the dominant form of NSC reserves during winter. Year-to-year variation was highly
significant in the wood only for soluble sugars in P. vera and P. dulcis and non-variable in J. regia. Starch content,
on the other hand, remained very invariable between years in P. dulcis and P. vera, but was significantly different
for several months in J. regia (Table 3).
Scientific Reports | (2021) 11:5181 | https://doi.org/10.1038/s41598-021-83935-1 8
Vol:.(1234567890)www.nature.com/scientificreports/
Figure 5. Starch and sugar in wood. Average concentration of starch (blue) and sugar (yellow) in wood from
all sites for P. dulcis, P. vera and J. regia from January 2017 to December 2019. The upper whisker extends from
the hinge to the largest value no further than 1.5*IQR from the hinge (where IQR is the inter-quartile range, or
distance between the first and third quartiles). The lower whisker extends from the hinge to the smallest value at
most 1.5*IQR of the hinge. Grey shading reflects the dormancy period of each species.
Discussion
Here we present unique multi-year pattern analyses of sugar and starch in wood and bark from three major nut
species covering a large geographical scale spanning the Central Valley of California. We focused our analysis
on NSC content in twigs. Compared to other parts of the tree, twig NSC content follows a general pattern of
NSC seasonal variation14,27 and correlates with or even affects major phenological events28 whereas roots remain
fairly stable throughout the year Additionally, despite the stem wood having the biggest biomass, branches are
the largest reservoir of total NSC followed by roots and stem w ood14. Sampling of twigs is also non-invasive for
trees and allows for easy and fast collection of samples by the citizen scientists.
Seasonality. The seasonal patterns of NSC, starch, and sugar show global similarities and some species-
specific differences. One major result of this study is that NSC content in twigs is highly variable throughout
the season with fall content being two-to-three times higher than during the active time of spring growth. The
highest level of NSC reserves occurs between September and October, typically preceding leaf senescence by 1
or 2 months. This peak is followed by a continuous slow decrease of NSC content throughout the winter. These
findings are consistent with other seasonal NSC studies. Matinez-Vilalta4 found that total NSC, starch, and solu-
ble sugars varied seasonally, with a strong depletion of starch during the growing season and a general increase
Scientific Reports | (2021) 11:5181 | https://doi.org/10.1038/s41598-021-83935-1 9
Vol.:(0123456789)www.nature.com/scientificreports/
during winter months particularly in boreal and temperate biomes. Likewise, Furze et al.14 found pools built up
over the growing season and declined over the dormant season. Specifically, they also found that NSC peaked in
October for deciduous species. Variation in NSC content is continuous and significant changes in NSC content
occurs during winter. This continuous reserve of carbohydrate content and form (SC or St) fluctuation suggests
year-round activity, supporting the notion that there is no true dormancy. There is no time to rest for tree car-
bohydrate metabolism.
In all three species in all 3 years, accumulation of NSC reserves in twigs starts in mid-summer, during the nut
filling period and active girth growth27 seemingly during the highest level of overall demand. This suggests that
starch reserve accumulation is not a passive activity occurring in response to an excess of soluble sugars but is
instead a competitive process to other carbon demanding processes like growth and fruit d evelopment29. Starch
content reaches a maximum in bark in late summer (August–September) and in wood (September–October) and
is followed by slow degradation while soluble sugars still accumulate in both tissues over winter. This suggests
that starch degradation (as starch accumulation) is not a passive response to a low soluble sugar content level, but
rather an active process performing biological functions potentially related to chill response and bloom timing28.
The large swings of SC concentration in summer and winter and the counterintuitive response of St content
might also suggest that SC levels are controlled at different concentrations in trees during the active period and
dormancy. Interestingly, we did not observe any spike in NSC accumulation postharvest when one would expect
an excess of photosynthates due to removal of fruits and significant slowdown in growth while maintaining leaf
photosynthetic capacity. However, we only analyzed the twigs, thus it is possible that, at the end of the tree growth
cycle during fall, most of the photosynthetic output is exported to basal parts of the tree–trunk and r oots27.
During winter, a slow loss of total NSC observed in all three species is accompanied by highly dynamic
changes in soluble sugar and starch content. The slow loss could be explained by respiration activity that is
affected by winter t emperatures30 and possibly whole tree redistribution of s ugars1,24. However, the large swings
between NSC forms needs a deeper look. Starch degradation over winter seemed to be associated with an
increase of SC that lasts till bloom/leafing. The increase in SC during winter is often explained as part of the
tree’s response to frost that requires input of osmotica and energy to counter frost, but in the Central Valley in
California, frost is a highly infrequent event and cannot be used to explain the observed trend. It is more likely
that accumulation of SC and degradation of starch reflects underlying biological activity where SC-starch bal-
ance during winter can be associated with time/temperature memory of dormancy28 and could be linked to the
concept of chilling in future studies.
The three species differed in variation between minimum and maximum NSC content: P. vera has the most
yearly variation of ~ 300%, P. dulcis ~ 200%, while J. regia only ~ 150%. It seems that this yearly variation is
not related to maximum pre-winter reserves (as maximum NSC was similar for all three species), but rather
minimum amounts tolerated by each species in the summer. Thus, pre-winter accumulation of NSC that could
reflect climatic constraints related to dormancy length seemed of lesser importance in seasonal patterns of
NSC. However, tolerance to summer risks and yield capacity can be more important in shaping seasonal vari-
ation of NSC content. P. vera and P. dulcis seemed to tolerate very low reserve levels (risk taking) in late spring
but rebuilt the reserves in competition to fruit and vegetative growth enforcing the notion of reserves being a
strong competitive sink during summer in preparation for dormancy. J. regia reached a minimum of NSC in
mid-summer before restoration of reserves is initiated allowing only a short period of time for reserves to build
up. Overall though, J. regia seemed to maintain higher NSC levels in summer, potentially representing a lower
risk strategy to summer stress.
Year to year variation. In general, NSC, SC, and St content in wood and bark show highly significant
seasonality in addition to significant interannual variation that suggests that while a general NSC pattern is most
likely driven by seasonal/phenological e vents29, the year-to-year variation might be related to some stochas-
tic parameters, potentially weather variation, tree breeding patterns (masting) and/or horticultural practices.
However, this study spans only spans 3 years. The determination of the non-stationarity (year-to-year variation)
using climatic (rainfall, temperature, solar time, bee-time etc.), management (changes in applied management
strategies) or tree species-specific intrinsic responses (alternate bearing, phenology etc.) is premature, but pos-
sible in the near future.
While the annual pattern of NSC content in twigs, their distribution between bark and wood, and the dynam-
ics of a starch and soluble sugar fraction showed high levels of seasonality and a similar pattern in three con-
secutive years, the absolute content shows some variability between specific months in a year-to-year analysis
(patterns were non-stationary). This was especially true for P. dulcis and P. vera which show significant variation
between months in the year-to-year analysis. The variations were especially pronounced in SC content. Interest-
ingly, starch content was less variable suggesting that low summer values are persistent in the current climate
under applied management practices, while high winter values potentially reflect physical space limitation for
starch storage in twigs. In addition, year-to-year levels of variation of SC might be a result of not only climatic
variability, but also yield history especially in alternate bearing species. Nevertheless, assuming those levels of
NSC and their composition is physiologically important; the year-to-year variation can provide useful informa-
tion to assess orchard performance, potential yield, and orchard health.
The presented study provides a temporal analysis of NSC reserves in perennial cropping systems and opens
a door for designing NSC-based novel management practices. Specifically, a better understanding of the post-
harvest recovery of NSC content and its redistribution is vital as the tree prepares for dormancy. Perhaps the
timing of irrigation, fertilization and other management practices should be carefully considered for this period
in order to most efficiently recharge carbohydrate storage for the following season. Current practices like chemical
defoliation might result in unexpected side effects related to their effect on fall NSC management. For example,
Scientific Reports | (2021) 11:5181 | https://doi.org/10.1038/s41598-021-83935-1 10
Vol:.(1234567890)www.nature.com/scientificreports/
reduced fall photosynthates supply may not affect NSC content in twigs but significantly reduce their export to
trunk and roots affecting spring growth. Further, knowledge that P. dulcis and P. vera are running early summer
growth and fruit set with almost zero reserves illustrates that this is the most vulnerable period, as even a small
level of stress could result in carbon deficit and affect carbon demanding processes causing fruit drop, reduced
vegetative growth or slowdown in NSC reserves buildup. The fact that there is no time to rest for carbohydrate
management in trees underlines the importance of winter conditions on carbohydrate activity—their redis-
tribution and twig preparation for bloom. Knowledge on minimum requirements to survive winter to assure
synchronous bloom can offer new options to mitigate changing climatic conditions when evolved traits might
be inadequate for new challenges like winter drought and extreme temperature swings. In addition, observed
year-to-year variation in total NSC content and minimum/maximum values might have an impact on species
productivity and explain yield variability. This unique large-scale multiyear study on both bark and wood dynam-
ics and both intra and inter-seasonality variation, provides a solid foundation for future studies analyzing effects
of climate and phenology.
Received: 16 July 2020; Accepted: 18 January 2021
References
1. Loescher, W., Mccamant, T. & Keller, J. Carbohydrate reserves, translocation, and storage in woody plant roots. HortScience 25,
274–281 (1990).
2. Maurel, K. et al. Trophic control of bud break in peach (Prunus persica) trees: A possible role of hexoses. Tree Physiol. 24, 579–588
(2004).
3. Witt, W. & Sauter, J. J. Starch metabolism in poplar wood ray cells during spring mobilization and summer deposition. Physiol.
Plant. 92, 9–16 (1994).
4. Martínez-Vilalta, J. et al. Dynamics of non-structural carbohydrates in terrestrial plants: A global synthesis. Ecol. Monogr. 86,
495–516 (2016).
5. Tixier, A., Orozco, J., Roxas, A. A., Earles, J. M. & Zwieniecki, M. A. Diurnal variation in nonstructural carbohydrate storage in
trees: Remobilization and vertical mixing. Plant Physiol. 178, 1602–1613 (2018).
6. Zeeman, S. C. et al. Starch synthesis in Arabidopsis. Granule synthesis, composition, and structure. Plant Physiol. 129, 516–529
(2002).
7. Bucci, S. J., Scholz, F. G., Goldstein, G., Meinzer, F. C. & Sternberg, L. D. S. L. Dynamic changes in hydraulic conductivity in petioles
of two savanna tree species: Factors and mechanisms contributing to the refilling of embolized vessels. Plant Cell Environ. 26,
1633–1645 (2003).
8. Graf, A. & Smith, A. M. Starch and the clock: The dark side of plant productivity. Trends Plant Sci. 16, 169–175 (2011).
9. Pyl, E. T. et al. Metabolism and growth in Arabidopsis depend on the daytime temperature but are temperature-compensated
against cool nights. Plant Cell 24, 2443–2469 (2012).
10. Stitt, M. & Zeeman, S. C. Starch turnover: Pathways, regulation and role in growth. Curr. Opin. Plant Biol. 15, 282–292 (2012).
11. Streb, S. & Zeeman, S. C. Starch metabolism in Arabidopsis. Arab. B. 10, e0160 (2012).
12. Richardson, A. D. et al. Distribution and mixing of old and new nonstructural carbon in two temperate trees. New Phytol. 206,
590–597 (2015).
13. Woodruff, D. R. et al. Linking nonstructural carbohydrate dynamics to gas exchange and leaf hydraulic behavior in Pinus edulis
and Juniperus monosperma. New Phytol. 206, 411–421 (2015).
14. Furze, M. E. et al. Whole-tree nonstructural carbohydrate storage and seasonal dynamics in five temperate species. New Phytol.
221, 1466–1477 (2019).
15. Bazot, S., Barthes, L., Blanot, D. & Fresneau, C. Distribution of non-structural nitrogen and carbohydrate compounds in mature
oak trees in a temperate forest at four key phenological stages. Trees Struct. Funct. 27, 1023–1034 (2013).
16. Richardson, A. D. et al. Seasonal dynamics and age of stemwood nonstructural carbohydrates in temperate forest trees. New Phytol.
197, 850–861 (2013).
17. Rinne, P., Tuominen, H. & Junttila, O. Seasonal changes in bud dormancy in relation to bud morphology, water and starch content,
and abscisic acid concentration in adult trees of Betula pubescens. Tree Physiol. 14, 549–561 (1994).
18. Simões, F., Hawerroth, F. J., Yamamoto, R. R. & Herter, F. G. Water content and carbohydrate dynamics of pear trees during dor-
mancy in Southern Brazil. Acta Hortic. 1058, 305–312 (2014).
19. Ford, K. R., Harrington, C. A., Bansal, S., Gould, P. J. & St. Clair, J. B. Will changes in phenology track climate change? A study of
growth initiation timing in coast Douglas-fir. Glob. Chang. Biol. 22, 3712–3723 (2016).
20. Luedeling, E., Zhang, M. & Girvetz, E. H. Climatic changes lead to declining winter chill for fruit and nut trees in California during
1950–2099. PLoS ONE 4, e6166 (2009).
21. Luedeling, E., Guo, L., Dai, J., Leslie, C. & Blanke, M. M. Differential responses of trees to temperature variation during the chilling
and forcing phases. Agric. For. Meteorol. 181, 33–42 (2013).
22. Charrier, G., Poirier, M., Bonhomme, M., Lacointe, A. & Améglio, T. Frost hardiness in walnut trees (Juglans regia L.): How to
link physiology and modelling?. Tree Physiol. 33, 1229–1241 (2013).
23. Hartmann, H. & Trumbore, S. Understanding the roles of nonstructural carbohydrates in forest trees—From what we can measure
to what we want to know. New Phytol. 211, 386–403 (2016).
24. Tixier, A. et al. Spring bud growth depends on sugar delivery by xylem and water recirculation by phloem Münch flow in Juglans
regia. Planta 246, 495–508 (2017).
25. Fleisher, D. H., Shillito, R. M., Timlin, D. J., Kim, S.-H. & Reddy, V. R. Approaches to modeling potato leaf appearance rate. Agron.
J. 98, 522 (2006).
26. Leyva, A. et al. Rapid and sensitive anthrone-sulfuric acid assay in microplate format to quantify carbohydrate in biopharmaceutical
products: Method development and validation. Biologicals 36, 134–141 (2008).
27. Tixier, A. et al. Comparison of phenological traits, growth patterns, and seasonal dynamics of non-structural carbohydrate in
Mediterranean tree crop species. Sci. Rep. 10, 347. https://doi.org/10.1038/s41598-019-57016-3 (2020).
28. Sperling, O. et al. Predicting bloom dates by temperature mediated kinetics of carbohydrate metabolism in deciduous trees. Agric.
For. Meteorol. 276–277 (2019).
29. Tixier, A., Gambetta, G. A., Godfrey, J., Orozco, J. & Zwieniecki, M. A. Non-structural carbohydrates in dormant woody perennials;
the tale of winter survival and spring arrival. Front. For. Glob. Change 2, 1–8 (2019).
30. Yokota, T. & Hagihara, A. Seasonal change in the temperature coefficient Q10 for respiration of field-grown hinoki cypress
(Chamaecyparis obtusa) trees. J. For. Res. 1, 165–168 (1996).
Scientific Reports | (2021) 11:5181 | https://doi.org/10.1038/s41598-021-83935-1 11
Vol.:(0123456789)www.nature.com/scientificreports/
Acknowledgements
We would like to thank all of our citizen scientists for their participation in this project and the undergraduate
researchers that work in our lab without whom, this research would not be possible. We would also like to thank
California Department of Food and Agriculture and the California Almond, Pistachio and Walnut boards for
their financial support. Finally, we would like to thank Jessica Orozco and Jay Regio for their technical help on
the map.
Author contributions
A.D. and M.Z. were responsible for design, methodology, data interpretation, and manuscript writing/revision.
M.Z. conceptualized the project, created the website and analyzed the data. A.D. collected data and managed
the project. K.C. managed the processing of laboratory samples. S.L., E.L., and K.C., collected and processed
samples and provided edits to the manuscript.
Funding
This work was made possible by the California Department of Food and Agriculture (18-0001-020-SC), The
Almond Board of California, the California Walnut Board, and the California Pistachio Research Board.
Competing interests
The authors declare no competing interests.
Additional information
Correspondence and requests for materials should be addressed to A.M.D.
Reprints and permissions information is available at www.nature.com/reprints.
Publisher’s note Springer Nature remains neutral with regard to jurisdictional claims in published maps and
institutional affiliations.
Open Access This article is licensed under a Creative Commons Attribution 4.0 International
License, which permits use, sharing, adaptation, distribution and reproduction in any medium or
format, as long as you give appropriate credit to the original author(s) and the source, provide a link to the
Creative Commons licence, and indicate if changes were made. The images or other third party material in this
article are included in the article’s Creative Commons licence, unless indicated otherwise in a credit line to the
material. If material is not included in the article’s Creative Commons licence and your intended use is not
permitted by statutory regulation or exceeds the permitted use, you will need to obtain permission directly from
the copyright holder. To view a copy of this licence, visit http://creativecommons.org/licenses/by/4.0/.
© The Author(s) 2021
Scientific Reports | (2021) 11:5181 | https://doi.org/10.1038/s41598-021-83935-1 12
Vol:.(1234567890)You can also read