RAPID INCREASE IN SARS-COV-2 P.1 LINEAGE LEADING TO CODOMINANCE WITH B.1.1.7 LINEAGE, BRITISH COLUMBIA, CANADA, JANUARY-APRIL 2021 - CDC
←
→
Page content transcription
If your browser does not render page correctly, please read the page content below
RESEARCH

          Rapid Increase in SARS-CoV-2
              P.1 Lineage Leading to
            Codominance with B.1.1.7
            Lineage, British Columbia,
           Canada, January–April 2021
        Catherine A. Hogan,1 Agatha N. Jassem,1 Hind Sbihi, Yayuk Joffres, John R. Tyson, Kyle Noftall,
           Marsha Taylor, Tracy Lee, Chris Fjell, Amanda Wilmer, John Galbraith, Marc G. Romney,
               Bonnie Henry, Mel Krajden, Eleni Galanis, Natalie Prystajecky, Linda M.N. Hoang

 Several severe acute respiratory syndrome coronavirus 2            transmissibility, clinical severity, effect on diagnostic
 variants of concern (VOCs) emerged in late 2020; lineage           testing, and reduced vaccine efficacy (1–5). Globally,
 B.1.1.7 initially dominated globally. However, lineages            the B.1.1.7 (Alpha), B.1.351 (Beta), and P.1 (Gamma)
 B.1.351 and P.1 represent potentially greater risk for trans-      lineages represented the 3 main actively circulat-
 mission and immune escape. In British Columbia, Canada,            ing VOCs in late 2020 and early 2021 (6). B.1.1.7 was
 B.1.1.7 and B.1.351 were first identified in December 2020         first detected in England in September 2020 and pro-
 and P.1 in February 2021. We combined quantitative PCR             gressed to become the dominant lineage in this set-
 and whole-genome sequencing to assess relative contri-             ting within months (4,7). By early January 2021, >40
 bution of VOCs in nearly 67,000 infections during the first
                                                                    countries had documented B.1.1.7 cases, demonstrat-
 16 weeks of 2021 in British Columbia. B.1.1.7 accounted
                                                                    ing rapid international spread (8). This lineage has
 for 50% by week 8. P.1 accounted for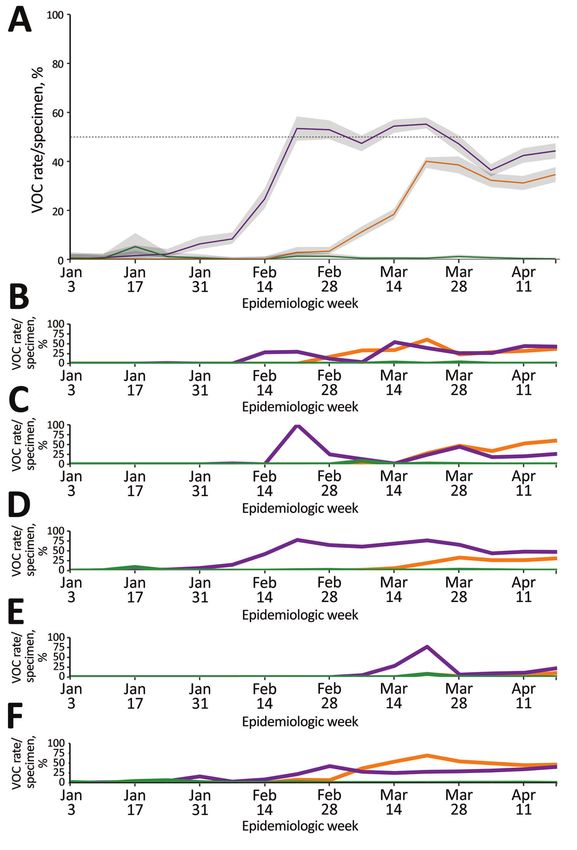
Rapid Increase in SARS-CoV-2 P1 Lineage, Canada

is most concerning for its potential vaccine response          VOC testing strategy using targeted VOC single-nu-
resistance and therefore might theoretically drive             cleotide polymorphism (SNP) qPCR and whole-ge-
selective emergence of these lineages in vaccinated            nome sequencing (WGS) to monitor VOC prevalence
populations (6). The factors that lead to the establish-       and assessed concordance between the 2 methods.
ment of one strain over another are under study; un-           Specimens tested by WGS were from priority popu-
certainty remains regarding the dynamics of VOCs               lations, such as cases from an outbreak or cluster.
in the context of recent global SARS-CoV-2 vaccine             Specimens not tested directly by WGS were screened
rollout. Understanding the dynamics of VOC rates is            by VOC qPCR. We performed an initial VOC pro-
critical given the importance of implementing strin-           portion assessment during January 30–February 6,
gent measures to mitigate the spread of more trans-            2021, to evaluate the testing strategy and benchmark
missible variants (17) and to guide vaccine program            VOC prevalence.
development, planning, and delivery.
     The province of British Columbia (BC), Canada,            VOC SNP qPCR Implementation
population 5.1 million, experienced 3 coronavirus              During January 30–March 31, 2021, N501Y qPCR
disease (COVID-19) waves during 2020 and early                 testing was performed at the BCCDC PHL and ad-
2021, consistent with other regions in North America           opted by the Victoria General Hospital Laboratory
and Europe. BC reached a single-day peak of 1,318              (Vancouver Island, BC, Canada). At the same time,
cases on April 7, 2021, at the height of the third wave        St. Paul’s Hospital Virology Laboratory (Vancouver)
and a cumulative total of 106,985 cases by that point          implemented a sequential qPCR testing algorithm
(18). For delivery of healthcare services, the prov-           targeting several mutations identified in VOCs, in-
ince is partitioned into 5 regional health authorities         cluding N501Y and K417T (20). The N501Y mutation
(Appendix Figure 1, https://wwwnc.cdc.gov/EID/                 has been detected in the 3 main currently circulating
article/27/11/21-1190-App1.pdf). B.1.1.7 and B.1.351           VOCs: B.1.1.7, B.1.351, and P.1. Among those 3 VOCs,
lineages were first identified in BC in December 2020          the K417T mutation is found only in P.1. During April
(19). BC initiated SARS-CoV-2 vaccination campaigns            1–24, 2021, VOC qPCR testing was modified to incor-
in December 2020 in predefined phases according                porate both N501Y and E484K mutation screening at
to priority populations (19). Vaccine administration,          the BCCDC PHL; this method was adopted by Victo-
which had covered >25% of the population by the                ria General Hospital on April 16. Full VOC SNP qPCR
end of the study period (epidemiologic week [epi-              used at the BCCDC PHL is described separately (Ap-
week] 16), involved three 2-dose vaccines: BNT162b2            pendix). This change was performed to account for
mRNA (Pfizer-BioNTech, https://www.pfizer.com),                circulating VOCs and to optimize testing capacity.
mRNA-1273 (Moderna, https://www.modernatx.                     The E484K mutation has been detected in lineages
com), and ChAdOx1 (AstraZeneca/SII COVISHIELD,                 B.1.351 and P.1 but is very rarely detected in B.1.1.7. In
https://www.astrazeneca.com) (19). The objective of            addition, in April 2021, the Kelowna General Hospi-
this study was to summarize provincewide VOC sur-              tal Microbiology Laboratory (Kelowna, BC, Canada)
veillance observations over a 16-week period in 2021           implemented a commercially available VOC qPCR
spanning epiweek 1 (beginning January 3) to epiweek            targeting N501Y and E484K (Allplex SARS-CoV-2
16 (beginning April 24), including changes in relative         Variant I Assay; Seegene, https://www.seegene.
population contribution over time.                             com). For this study, integrated provincewide sur-
                                                               veillance was coordinated by the BCCDC to capture
Methods                                                        VOC prevalence during January 3–April 24, 2021.

VOC Detection by Single-Nucleotide Polymorphism                Confirmation by WGS
Quantitative PCR and Whole-Genome Sequencing                   Until March 31, 2021, all presumptive positive
The British Columbia Centre for Disease Control                SNP qPCR results were confirmed by WGS at
(BCCDC) Public Health Laboratory (PHL) (Vancou-                the BCCDC PHL. After March 31, specimens that
ver, BC, Canada) serves as the reference laboratory            tested positive for N501Y alone were identified as
for the province. In addition, hospital and private lab-       presumptive B.1.1.7 lineage; ≈10% were confirmed
oratories across BC offer frontline SARS-CoV-2 diag-           by WGS. In addition, only ≈25% of specimens that
nostic testing. Testing using quantitative PCR (qPCR)          tested positive for N501Y and another mutation
is largely restricted to symptomatic persons, with the         were confirmed by WGS. The full WGS method-
exception of outbreak investigations, which might              ology performed at the BCCDC PHL is described
include asymptomatic testing. We used a combined               separately (Appendix).

                      Emerging Infectious Diseases • www.cdc.gov/eid • Vol. 27, No. 11, November 2021               2803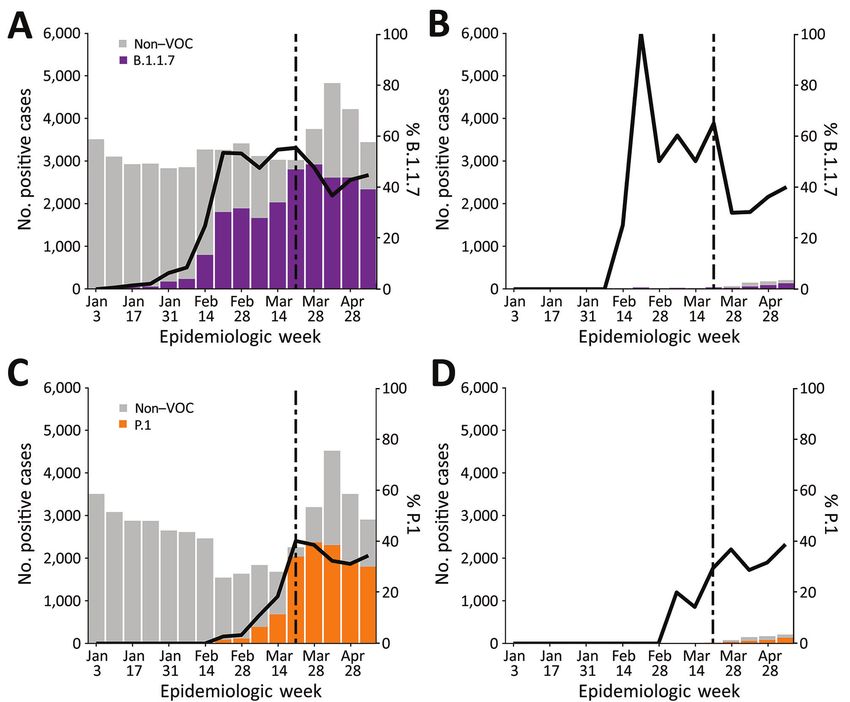
RESEARCH

Data Linkages and Analysis                                     Most VOC case-patients were young adults, median
We included all cases of SARS-CoV-2 infection diag-            age was 33 (range 10% by the
out first conducting SNP qPCR testing. We estimated            end of February 2021, >50% by the end of March 2021,
prevalence of each lineage on the basis of a weighted          and >70% by mid-April 2021 (Table). By VOC case
sum of VOC proportion through each of the 2 path-              count, the B.1.1.7 lineage increased progressively from
ways of detection, SNP qPCR and WGS (Appendix).                0% to 7.9% during epiweeks 1–6, then increased more
We defined a SARS-CoV-2 case as SARS-CoV-2 infec-              rapidly to 52.2% during epiweeks 6–8 (Figure 1, panel
tion laboratory-confirmed by PCR. To measure VOC               A); estimated doubling rate was 21 days after the first (sin-        VOCs by epiweek 12; the minimal estimated doubling
gle) vaccine dose and >7 days after the second dose.           time was 8 weeks, we observed
Fisher exact test for categorical variables. This work         a rapid increase in P.1, after which the 2 lineages coex-
was conducted under the public health mandate, and             isted (Appendix Figure 2). Despite earlier detection of
institutional review board approval was waived.                B.1.351 in BC in epiweek 9, B.1.351 remained stable or
                                                               decreased over time and represented
Rapid Increase in SARS-CoV-2 P1 Lineage, Canada

Table. Number of specimens positive for severe acute respiratory syndrome coronavirus 2, proportion screened VOC assay, and
proportion positive for variants of concern, British Columbia, Canada, January 3–April 24, 2021*
                                                                                               No. (%) specimens
Epiweek                            Start date       No. positive specimens Screened by VOC assay         Presumptive VOC-positive†
1                                 2021 Jan 3                 3,857                  19 (0.49)                          0
2                                2021 Jan 10                 3,498                 235 (6.72)                      2 (0.85)
3                                2021 Jan 17                 3,477                867 (24.94)                      9 (1.04)
4                                2021 Jan 24                 3,325                793 (23.85)                      8 (1.01)
5                                2021 Jan 31                 3,125               2,200 (70.40)                    24 (1.09)
6                                 2021 Feb 7                 3,126               2,263 (72.39)                    57 (2.52)
7                                2021 Feb 14                 3,464               2,821 (81.44)                   105 (3.72)
8                                2021 Feb 21                 3,638               3,291 (90.46)                   231 (7.02)
9                                2021 Feb 28                 3,867               3,813 (98.86)                  442 (11.59)
10                                2021 Mar 7                 3,862                3,862 (100)                   626 (16.20)
11                               2021 Mar 14                 4,155               4,128 (99.35)                 1,081 (26.19)
12                               2021 Mar 21                 5,723               5,636 (98.48)                 2,162 (38.36)
13                               2021 Mar 28                 7,036               7,032 (99.94)                 3,622 (51.51)
14                                2021 Apr 4                 8,195               8,185 (99.88)                 5,404 (66.02)
15                               2021 Apr 11                 7,278               6,560 (90.13)                 4,644 (70.79)
16                               2021 Apr 18                 6,441               6,127 (95.12)                 4,681 (76.40)
*Epiweek, epidemiologic week; VOC, variant of concern.
†Presumptive VOC detection refers to VOC identification by quantitative PCR testing without confirmation by whole-genome sequencing; includes all
specimens tested for VOCs.

attributed to B.1.1.7 and P.1 lineage strains, and 18                        and WGS data were limited (20). Building on those
(0.2%) cases in persons who had received 2 doses were                        earlier findings, our study performed ongoing sur-
attributed to B.1.1.7 and P.1 lineage strains (Appendix                      veillance of >74,000 SARS-CoV-2–positive specimens
Table). Infections after 2 doses of vaccine were exclud-                     across the entire province over 16 weeks. This surveil-
ed from downstream analyses given their small num-                           lance led to the detection of a rapid and substantial
ber. Almost all (96.4%) of the VOC infections occurred                       increase in P.1 lineage, demonstrating its potential
in unvaccinated persons, but approximately the same                          for codominance with B.1.1.7 at the provincial level.
proportion of VOC cases occurred among partially vac-                        The pattern of population-level lineage change over
cinated and unvaccinated persons. Specifically, during                       time reflected the largest outbreak of the P.1 lineage
epiweeks 9–16, when B.1.1.7 was widespread and case                          outside of Brazil at that time (21,22). This study docu-
counts were high, B.1.1.7 infections were identified                         mented the parallel rapid increase of the P.1 lineage in
in 37%–55% of cases in unvaccinated persons and in                           3 regional health authorities in which B.1.1.7 was pre-
30%–65% of cases in persons who had received 1 dose                          viously established, contrasting with previous reports
(Figure 2). During epiweeks 10–16, after P.1 emerged                         in Italy showing sustained dominance of B.1.1.7 after
in the study population, the proportion of infections                        the introduction of P.1 (15; P. Stefanelli et al., unpub.
with P.1 was 14%–39% among cases in partially vac-                           data). In 2 regions, the proportion of P.1 exceeded that
cinated persons and 11%–40% among cases in unvacci-                          of B.1.1.7 for a sustained period. Of note, P.1 arose to
nated persons (Figure 2). Conversely, at the same time                       codominance before broad vaccination of the most
(epiweeks 9–16), 6%–50% of breakthrough infections                           likely implicated young adult age group, and the
were non-VOC lineages in persons who had received 1                          proportion of VOCs was similar between vaccinated
dose of a 2-dose vaccine.                                                    and unvaccinated groups, suggesting that vaccination
                                                                             was not driving the observed trends of P.1 increase.
Discussion                                                                   Although our findings contradict those of Hacisuley-
Results from this analysis of VOC laboratory and epi-                        man et al. (16), which cautioned that infections after
demiologic surveillance data demonstrated initially                          vaccination might be characterized by variant mu-
low prevalence of VOC and predominance of the                                tations such as E484K, the difference might reflect
B.1.1.7 lineage in BC, Canada, in early 2021, consis-                        the small sample size in that study. Comprehensive
tent with trends documented across North America.                            comparative demographic data to characterize the
An earlier study that tested 2,618 SARS-CoV-2–pos-                           P.1 lineage are lacking; however, early data from Bra-
itive samples in BC over a 7-day period in a single                          zil demonstrate increased case-fatality rates among
regional health authority reported an outbreak of                            younger age groups that coincide temporally with the
13 P.1 cases; however, whether this occurrence rep-                          rise of this lineage there (M.H.S. de Oliveira, unpub.
resented a single confined outbreak or potential for                         data, https://www.medrxiv.org/content/10.1101/
more disseminated spread of this lineage is uncertain,                       2021.03.24.21254046v1). Further work investigating

                             Emerging Infectious Diseases • www.cdc.gov/eid • Vol. 27, No. 11, November 2021                                        2805
RESEARCH
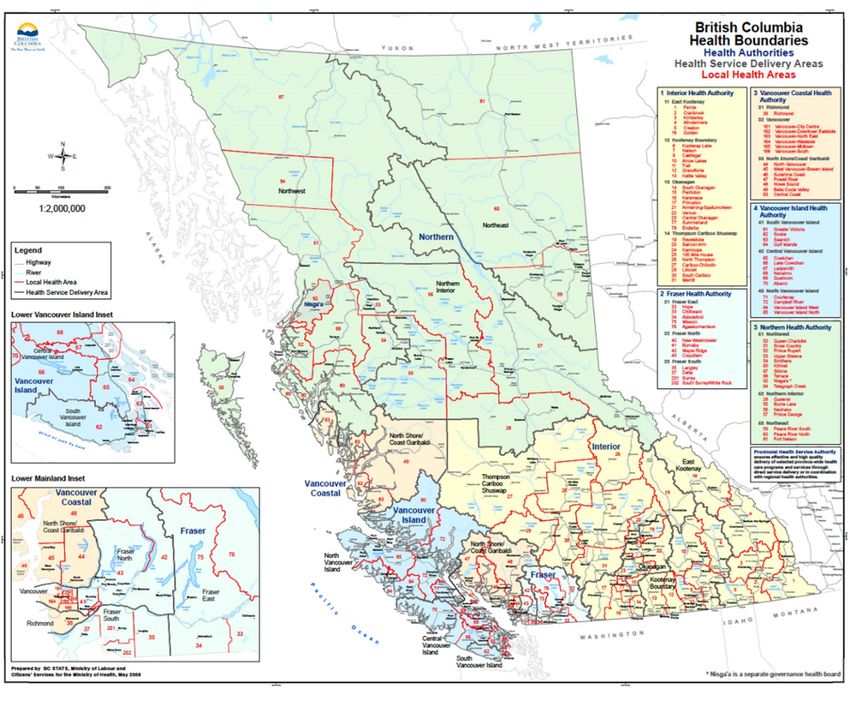
Figure 1. Weekly rate estimates
of each severe acute respiratory
syndrome coronavirus 2 VoC (per 100
specimens screened or sequenced),
by epidemiologic week and specimen
collection date, British Columbia
(BC), Canada, January–April 2021.
The 3 main VoC are shown in purple
(B.1.1.7), green (B.1.351), and orange
(P.1). The P.1 lineage was confirmed
through whole-genome sequencing or
from an N501Y- and E484K-positive
or K417T-positive result from epiweek
12 onward. A) VOC data for the whole
province. Shaded areas around the
line represent 95% CI; dashed line
indicates 50%. B) VOC data for BC
regional health authority 1. C) VOC
data for BC regional health authority
2. D) VOC data for BC regional health
authority 3. E) VOC data for BC
regional health authority 4. F) VOC
data for BC regional health authority 5.
The 95% CIs are not shown for health
regions because of low numbers and
rates and the resulting wide uncertainty
seen across regions for extended
periods. BR, Brazil; SA, South Africa;
UK, United Kingdom; VOC, variant
of concern.
the full epidemiologic characteristics and clinical im- the same timeframe (data not shown) supported the
plications, including disease severity, of the P.1 in- identification of most E484K-positive specimens as
crease will complement the findings of this study. P.1 lineage. Second, to avoid oversampling bias, we
The first limitation of our study is that the VOC based the WGS selection strategy on the inclusion of
qPCR and WGS confirmation testing strategies were specimens from persons tested for background sur-
modified over time, which might partially limit veillance purposes, not for outbreak investigation or
comparability of positivity estimates over time and targeted (e.g., travel-related) surveillance. Third, the
could overestimate rates of P.1 because of the use of populations that were vaccinated during this study
E484K-positivity as its surrogate in some instances. period do not necessarily reflect the persons at high-
Nonetheless, background surveillance data during est risk for VOC infection, which might have modified
2806 Emerging Infectious Diseases • www.cdc.gov/eid • Vol. 27, No. 11, November 2021
Rapid Increase in SARS-CoV-2 P1 Lineage, Canada

breakthrough VOC proportions. Of note, this study                      In summary, this population-level study based
was not designed to assess vaccine effectiveness; we               on a combined qPCR and WGS VOC testing strat-
did not adjust for confounders in the relationship be-             egy demonstrated the rapid increase of the P.1
tween vaccination and infection, such as age, under-               lineage and its later codominance, contrasting
lying conditions, vaccination program roll-out, and                with studies in settings such as Italy, where the
temporal-spatial epidemic risk. More comprehensive                 B.1.1.7 and P.1 lineages have cocirculated. Further
studies considering characteristics of the vaccine roll-           work is required to elucidate the biologic and so-
out strategy are needed for analyses beyond overall                cial factors that enabled the establishment of this
comparisons between lineages in unvaccinated and                   lineage and to assess the clinical implications of
vaccinated groups.                                                 these findings.

Figure 2. Distribution of all severe acute respiratory syndrome coronavirus 2 cases and VoC cases by vaccination status, British
Columbia, Canada, January–April 2021. Vaccinated persons included those who had received 1 dose of a 2-dose vaccine with diagnosis
confirmed by PCR >21 days after the first dose (on the basis of specimen collection date). Stacked bars (left-hand y-axis) represent
the absolute number of VOC cases and non-VOC cases. Solid lines (right-hand y-axis) show the percentage of VOC among all cases
identified in a given week. Dotted lines show the date when VOC quantitative PCR (qPCR) including E484K mutation detection was
adopted at the British Columbia Centre for Disease Control Public Health Laboratory. A) B.1.1.7 and non-VOC cases in nonvaccinated
persons. B) B.1.1.7 and non-VOC cases in vaccinated persons. VOC cases in panels A and B included B.1.1.7 confirmed for lineage
by whole-genome sequencing and presumptive B.1.1.7 positives based on a VOC qPCR result of N501Y-positive and E484K-negative.
C) P.1 and non-VOC cases in nonvaccinated persons. D) P.1 and non-VOC cases in vaccinated persons. VOC cases in panels C and
D included P.1 and B.1.351 confirmed for lineage by whole-genome sequencing and presumptive P.1 positives based on a VOC qPCR
result of N501Y-positive and E484K-positive or K417T-positive. VOC, variant of concern.

                         Emerging Infectious Diseases • www.cdc.gov/eid • Vol. 27, No. 11, November 2021                       2807
RESEARCH

Acknowledgments                                                      2. Galloway SE, Paul P, MacCannell DR, Johansson MA,
We thank the molecular, virology, and bacteriology staff                Brooks JT, MacNeil A, et al. Emergence of SARS-CoV-2
                                                                        B.1.1.7 lineage—United States, December 29, 2020–
and microbiologists of the British Columbia Centre for                  January 12, 2021. MMWR Morb Mortal Wkly Rep.
Disease Control Public Health Laboratory (BCCDC PHL)                    2021;70:95–9. https://doi.org/10.15585/mmwr.mm7003e2
for their contribution toward testing, without which this            3. Muik A, Wallisch AK, Sänger B, Swanson KA, Mühl J,
work would not have been possible. We thank Rebecca                     Chen W, et al. Neutralization of SARS-CoV-2 lineage B.1.1.7
                                                                        pseudovirus by BNT162b2 vaccine-elicited human sera.
Hickman, Ji-In Hum, Jason Nguyen, Frankie Tsang, Branco                 Science. 2021;371:1152–3. https://doi.org/10.1126/
Cheung, Michael Chan, Corrinne Ng, Loretta Janz, Rob                    science.abg6105
Azana, Ana Paccagnella, Kim Macdonald, Kimia                         4. Davies NG, Abbott S, Barnard RC, Jarvis CI, Kucharski AJ,
Kamelian, Diane Eisler, Dan Fornika, and Yin Chang for                  Munday JD, et al.; CMMID COVID-19 Working Group;
                                                                        COVID-19 Genomics UK (COG-UK) Consortium.
their contributions toward test procedure development,                  Estimated transmissibility and impact of SARS-CoV-2
interpretation, and implementation. We thank Karen                      lineage B.1.1.7 in England. Science. 2021;372:eabg3055.
Mooder and senior members of the BCCDC PHL                              https://doi.org/10.1126/science.abg3055
operations team for their role in building the infrastructure        5. Challen R, Brooks-Pollock E, Read JM, Dyson L,
                                                                        Tsaneva-Atanasova K, Danon L. Risk of mortality in
that enabled this work. We thank Braeden Klaver and the                 patients infected with SARS-CoV-2 variant of concern
BCCDC data analytics team for implementing the data                     202012/1: matched cohort study. BMJ. 2021;372:n579.
collection and entry systems that enabled this work. We                 https://doi.org/10.1136/bmj.n579
thank Nancy Matic and Christopher Lowe and the                       6. GISAID. Tracking of variants. 2021 [cited 2021 May 20].
                                                                        https://www.gisaid.org/hcov19-variants
virology laboratory staff from St. Paul’s Hospital,                  7. Volz E, Mishra S, Chand M, Barrett JC, Johnson R, Geidel-
Vancouver Island Health Authority (VIHA), and                           berg L, et al.; COVID-19 Genomics UK (COG-UK) consor-
Interior Health Authority (IHA) laboratories for sharing                tium. Assessing transmissibility of SARS-CoV-2 lineage
and verifying variant of concern data. We thank the British             B.1.1.7 in England. Nature. 2021;593:266–9. https://doi.
                                                                        org/10.1038/s41586-021-03470-x
Columbia Association of Medical Microbiologists for                  8. O’Toole A, Hill V, Pybus OG, Watts A, Bogoch II, Khan K,
sharing samples and data that enabled provincewide                      et al. Tracking the international spread of SARS-CoV-2 lin-
data collection and testing. We also thank medical health               eages B.1.1.7 and B.1.351/501Y–V2. 2021 [cited 2021 May 8].
officers across all 5 health authorities, and regional and              https://virological.org/t/tracking-the-international-spread-
                                                                        of-sars-cov-2-lineages-b-1-1-7-and-b-1-351-501y-v2/592
provincial public health staff, for providing case-level data.       9. Frampton D, Rampling T, Cross A, Bailey H, Heaney J,
                                                                        Byott M, et al. Genomic characteristics and clinical effect of
This work was supported by funding from Genome BC,
                                                                        the emergent SARS-CoV-2 B.1.1.7 lineage in London, UK: a
Genome Canada/CanCOGen, Canadian Institutes for                         whole-genome sequencing and hospital-based cohort study.
Health Research and MetroVancouver to N.P. This work                    Lancet Infect Dis. 2021 Apr 12 [Epub ahead of print].
was also funded by a Public Health Agency of Canada                 10. Peter Horby CH. Nick Davies, John Edmunds, Neil
                                                                        Ferguson, Graham Medley CS. NERVTAG. 2021 [cited
COVID-19 Immunology Task Force COVID-19 Hot Spots
                                                                        2021 May 1]. https://assets.publishing.service.gov.uk/
Competition Grant (grant no. 2021-HQ-000120) to M.G.R.                  government/uploads/system/uploads/attachment_data/
                                                                        file/961037/NERVTAG_note_on_B.1.1.7_severity_for_
                                                                        SAGE_77__1_.pdf
About the Author                                                    11. World Health Organization. COVID-19 weekly
Dr. Hogan is a medical microbiologist and infectious                    epidemiological update. 2021 [cited 2021 Apr 28].
                                                                        https://www.who.int/docs/default-source/coronaviruse/
diseases physician and the British Columbia Centre for                  situation-reports/20210413_weekly_epi_update_35.pdf
Disease Control Public Health Laboratory program head               12. Faria NR, Mellan TA, Whittaker C, Claro IM, Candido DDS,
for the Parasitology Laboratory. Her research interests                 Mishra S, et al. Genomics and epidemiology of the P.1
include novel diagnostic methods, clinical impact of                    SARS-CoV-2 lineage in Manaus, Brazil. Science.
                                                                        2021;372:815–21. https://doi.org/10.1126/
diagnostics, and global health. Dr. Jassem is a clinical                science.abh2644
microbiologist and the British Columbia Centre for Disease          13. PANGO lineages. P.1 [cited 2021 Apr 28].
Control Public Health Laboratory program head for the                   https://cov-lineages.org/global_report_P.1.html
Virology/Molecular Diagnostics Laboratory. Her research             14. Chen RE, Zhang X, Case JB, Winkler ES, Liu Y,
                                                                        VanBlargan LA, et al. Resistance of SARS-CoV-2 variants
interests include evaluation of molecular- and serology-                to neutralization by monoclonal and serum-derived
based strategies for virus detection or exposure.                       polyclonal antibodies. Nat Med. 2021;27:717–26.
                                                                        https://doi.org/10.1038/s41591-021-01294-w
                                                                    15. Di Giallonardo F, Puglia I, Curini V, Cammà C, Mangone I,
References                                                              Calistri P, et al. Emergence and spread of SARS-CoV-2
 1.    Walensky RP, Walke HT, Fauci AS. SARS-CoV-2 variants of          lineages B.1.1.7 and P.1 in Italy. Viruses. 2021;13:794.
       concern in the United States—challenges and opportunities.       https://doi.org/10.3390/v13050794
       JAMA. 2021;325:1037–8. https://doi.org/10.1001/              16. Hacisuleyman E, Hale C, Saito Y, Blachere NE, Bergh M,
       jama.2021.2294                                                   Conlon EG, et al. Vaccine breakthrough infections with

2808                        Emerging Infectious Diseases • www.cdc.gov/eid • Vol. 27, No. 11, November 2021
Rapid Increase in SARS-CoV-2 P1 Lineage, Canada

      SARS-CoV-2 variants. N Engl J Med. 2021;384:2212–8.          20.   Matic N, Lowe CF, Ritchie G, Stefanovic A, Lawson T,
      https://doi.org/10.1056/NEJMoa2105000                              Jang W, et al. Rapid detection of SARS-CoV-2 variants of
17.   Public Health Agency of Canada. Update on COVID-19 in              concern, Including B.1.1.28/P.1, British Columbia, Canada.
      Canada: epidemiology and modelling. 2021 Feb 19 [cited             Emerg Infect Dis. 2021;27:1673–6. https://doi.org/10.3201/
      2021 Feb 19]. https://www.canada.ca/content/dam/                   eid2706.210532
      phac-aspc/documents/services/diseases-maladies/              21.   Government of Canada. COVID-19 epidemiology update.
      coronavirus-disease-covid-19/epidemiological-economic-             2021 [cited 2021 May 20]. https://health-infobase.canada.ca/
      research-data/update-covid-19-canada-epidemiology-                 covid-19/epidemiological-summary-covid-19-cases.html
      modelling-20210219-en.pdf                                    22.   Centers for Disease Control and Prevention. COVID-19 data
18.   British Columbia Centre for Disease Control. British               tracker; variant proportions. 2021 [cited 2021 May 20]. https://
      Columbia COVID-19 dashboard. 2021 [cited 2021 May 20].             covid.cdc.gov/covid-data-tracker/#variant-proportions
      https://experience.arcgis.com/experience/
      a6f23959a8b14bfa989e3cda29297ded                             Address for correspondence: Catherine A. Hogan, British Columbia
19.   British Columbia Government. COVID-19 immunization
                                                                   Centre for Disease Control, 655 W 12th Ave, Rm 2054, Vancouver,
      plan. 2021 [cited 2021 May 20]. https://www2.gov.bc.ca/
      gov/content/covid-19/vaccine/plan                            BC, V6R 2M7, Canada; email: catherine.hogan@bccdc.ca

      The Public Health Image Library
                                                                         The Public Health Image
                                                                         Library (PHIL), Centers
                                                                         for Disease Control and
                                                                         Prevention, contains
                                                                         thousands of public health–
                                                                         related images, including
                                                                         high-resolution (print quality)
                                                                         photographs, illustrations,
                                                                         and videos.

                                                                         PHIL collections illustrate
                                                                         current events and articles,
                                                                         supply visual content for
                                                                         health promotion brochures,
                                                                         document the effects of
                                                                         disease, and enhance
                                                                         instructional media.

                                                                         PHIL images, accessible to
                                                                         PC and Macintosh users, are
                                                                         in the public domain and
                                                                         available without charge.

                                                                         Visit PHIL at:
                                                                         http://phil.cdc.gov/phil

                          Emerging Infectious Diseases • www.cdc.gov/eid • Vol. 27, No. 11, November 2021                          2809
Article DOI: https://doi.org/10.3201/eid2711.211190

Rapid Increase in SARS-CoV-2 P.1 Lineage
  Leading to Codominance with B.1.1.7
   Lineage, British Columbia, Canada,
           January–April 2021
Appendix

Methods

N501Y and E484K Mutation Quantitative PCR Screening

       The British Columbia Centre for Disease Control Public Health Laboratory developed a
real-time, multiplex reverse transcription PCR (RT-PCR) assay targeting the envelope (E) gene
and the N501Y mutation of the spike (S) protein, with later addition of the S protein E484K
mutation. The E gene probe was used to confirm detection of severe acute respiratory syndrome
coronavirus 2 (SARS-CoV-2) RNA in the specimen, as previously described by Corman et al.
(1). Primer and probe details for variant of concern (VoC) detection are as follows: for N501Y,
F-AATTGTTACTTTCCTTTACAATCATATGG, R-CCACAAACAGTTGCTGGTGC, FAM-
MGB-Probe-ACACTAGCCATCCTTACTGCGCTTCG; for E484K, F-
AGAGAGATATTTCAACTGAAATCTATCAGG, R-CCACAAACAGTTGCTGGTGC, MGB-
Probe-CTTGTAATGGTGTTAAAGGT. In brief, total nucleic acids were extracted from 200μL
of upper respiratory specimen matrix (universal transport medium or saline) by using the
Applied BioSystems MagMax Express 96 Nucleic Acid Extractor and the MagMax
Viral/Pathogen Nucleic Acid Isolation Kit (ThermoFisher Scientific,
https://www.thermofisher.com) according to the manufacturer’s recommendations. Real-time
RT-PCR was performed by using the TaqMan Fast Virus Master Mix (ThermoFisher Scientific)
on the Applied Biosystems 7500 FAST real-time PCR system (ThermoFisher Scientific). PCR
set-up was performed by using a volume of 5µL of patient specimen extract, for a final reaction
volume of 20µL.

                                           Page 1 of 5
Whole-Genome Sequencing

       Whole-genome sequencing was performed at the British Columbia Centre for Disease
Control Public Health Laboratory. In brief, SARS-CoV-2 RNA was extracted by using the
Applied BioSystems MagMax Express 96 Nucleic Acid Extractor and the MagMax
Viral/Pathogen Nucleic Acid Isolation Kit (ThermoFisher). Viral RNA was reverse transcribed
into cDNA by using Thermo SuperScript IV, and a 2-pool multiplex PCR with primers tiled
across the entire SARS-CoV-2 genome in 29 ≈1200bp segments was performed (2). We
prepared DNA libraries for whole-genome sequencing on a MiSeq or NextSeq 2000 instrument
(Illumina, https://www.illumina.com) by using DNA Prep Library Preparation Kit (Illumina).
SARS-CoV-2 whole-genome consensus sequences and mutation compositions were generated
by using a modified Nextflow pipeline for running the ARTIC network
(https://artic.network/ncov-2019) fieldbioinformatics tools (https://github.com/BCCDC-
PHL/ncov2019-artic-nf). Reports detailing SARS-CoV-2 lineage information, sequencing QC
metrics, and mutational profiles were generated by using ncov-tools from the Simpson Lab
(https://github.com/jts/ncov-tools).

Weighting Procedure for VoC Proportion

       Where Ws is the weight for sequencing and Wg is the weight for genomics:

       Ws = total screened / (total screened + total sequenced)

       Wg = total sequenced / (total screened + total sequenced)

       For a given VoC called i (where i could be B.1.1.7, B.1.351, or P.1 lineage)

       Prevalence (i) = [presumptive positive (i) / (total screened)] × Ws + [sequenced (i) / total
sequenced] × Wg

References

1. Corman VM, Landt O, Kaiser M, Molenkamp R, Meijer A, Chu DK, et al. Detection of 2019 novel
       coronavirus (2019-nCoV) by real-time RT-PCR. [Erratum in: Euro Surveill.
       2020;25(14):20200409c; 2020;25(3):2007303; 2021;26(5):210204e]. Euro Surveill. 2020;25:1–8.
       PubMed https://doi.org/10.2807/1560-7917.ES.2020.25.3.2000045

                                           Page 2 of 5
2. Freed NE, Vlkova M, Faisal MB, Silander OK. Rapid and inexpensive whole-genome sequencing of
SARS-CoV-2 using 1200 bp tiled amplicons and Oxford Nanopore Rapid Barcoding. Biol
Methods Protoc. 2020;5:bpaa014.
3. Government of British Columbia. Regional health authorities. 2021 [cited 2021 Jul 14].
https://www2.gov.bc.ca/gov/content/health/about-bc-s-health-care-system/partners/health-
authorities/regional-health-authorities
Appendix Table. Descriptive demographics and vaccine information of persons infected with severe acute respiratory syndrome
coronavirus 2 and included in the study by the 3 main variants of concern, British Columbia, Canada, January–April, 2021*
Non-VoC† B.1.1.7 B.1.351 P.1
No. persons 47,159 (70.5) 11,614 (17.4) 75 (0.1) 8,079 (12.1) p value (VoCs)‡
Sex 0.0041
F 22,667 (48.1) 5,637 (48.5) 36 (48) 3,756 (46.5)
M 24,442 (51.8) 5,960 (51.3) 38 (50.7) 4,312 (53.4)
Vaccination status 0.0073
Not vaccinated 46,394 (98.4) 11340 (97.6) 75 (100) 7,838 (97)
1 dose 668 (1.4) 260 (2.2) 237 (2.9)
2 doses 97 (0.2) 14 (0.1) 4 (0)
Vaccine type 0.45
AstraZeneca 49 (0.1) 26 (0.2) 26 (0.3%)
Moderna mRNA-1273 88 (0.2) 16 (0.1) 20 (0.2%)
Pfizer mRNA BNT162b2 628 (1.3) 232 (2) 195 (2.4%)
Age, y 95% of all positive tests, it
is expected that a negligible proportion of positive samples were not captured, and B.1.351 reflects only sequencing results given the assumption
that dual positive results of VoC quantitative PCR were highly likely to be P1.
‡p values represent comparison among 3 variants of concern and were calculated by Kruskal-Wallis test for continuous variables and Fisher exact
test for categorical variables.
Page 3 of 5Appendix Figure 1. Map of the 5 regional health authorities, British Columbia, Canada (3).
Page 4 of 5Appendix Figure 2. Weekly rate estimate of each VoC/100 specimens screened or sequenced, by
epiweek and specimen collection date, for a single smaller geographic unit within a regional health
authority, British Columbia, Canada. The 3 main VoCs are shown in purple (B.1.1.7), green (B.1.351),
and orange (P.1). The dashed line indicates 50%. The P.1 lineage was identified through whole-genome
sequencing confirmation or from an N501Y-positive and E484K-positive or K417T-positive result from
epiweek 12 onward. Shaded areas around the line represent 95% CI. VoC, variant of concern.
Page 5 of 5You can also read