The injury mechanisms and injury pyramids among children and adolescents in Zhuhai City, China
←
→
Page content transcription
If your browser does not render page correctly, please read the page content below
Yin et al. BMC Public Health    (2021) 21:436
https://doi.org/10.1186/s12889-021-10425-4

 RESEARCH ARTICLE                                                                                                                                   Open Access

The injury mechanisms and injury pyramids
among children and adolescents in Zhuhai
City, China
Xiling Yin1, Wencan Dai1, Yukai Du2 and Deyun Li1*

  Abstract
  Background: The unclear mechanisms and severity of injuries in the injury pyramids for Chinese children and
  adolescents prevent the prioritization of interventions. This study aimed to describe the injury mechanisms and
  injury pyramids in this population to provide a priority for injury prevention strategies.
  Methods: Death, hospitalization, and outpatient/emergency department visit data from patients aged 0 ~ 17 years
  with injuries were obtained from January 1, 2013, to December 31, 2017, in Zhuhai City, China. The injury
  mechanism ratios were calculated, and the injury pyramid ratios were drawn in proportion using injury mortality
  and the incidence of both injury hospitalizations and outpatient/emergency department injury visits.
  Results: The top three mechanisms for injuries in children and adolescents treated in outpatient/emergency
  departments were falls (52.02%), animal bites (14.57%), and blunt injuries (10.60%). The top three mechanisms for
  injury hospitalizations were falls (37.33%), road traffic injuries (17.87%), and fire/burns (14.29%), while the top three
  mechanisms for injury deaths were drowning (32.91%), road traffic injuries (20.25%) and falls (13.92%). The incidence
  rate of outpatient/emergency department injury visits for children and adolescents was 11,210.87/100,000; the
  incidence rate of injury hospitalization was 627.09/100,000, and the injury death rate was 10.70/100,000. For each
  injury death, there were 59 injury hospitalizations and 1048 outpatient/emergency injury visits.
  Conclusions: The injury mechanisms were different for injury-related outpatient/emergency department visits,
  hospitalizations, and deaths among children and adolescents. The injury mechanisms by sex at different stages of
  child development, and interventions should be formulated based on this finding. The ratios of the injury pyramids
  varied by age, sex, region, and injury mechanisms; minor nonfatal injuries were more common in children and
  adolescents. The differences in the severity and extent of the injuries suggested that injury interventions in children
  and adolescents still have a long way to go.
  Keywords: Injury, Children, Adolescents, Injury mechanisms, Injury pyramid, China

* Correspondence: ljdycn@163.com
1
 Department of Public Health and Health Research, Center for Disease
Control and Prevention of Zhuhai City, Zhuhai, China
Full list of author information is available at the end of the article

                                        © The Author(s). 2021 Open Access This article is licensed under a Creative Commons Attribution 4.0 International License,
                                        which permits use, sharing, adaptation, distribution and reproduction in any medium or format, as long as you give
                                        appropriate credit to the original author(s) and the source, provide a link to the Creative Commons licence, and indicate if
                                        changes were made. The images or other third party material in this article are included in the article's Creative Commons
                                        licence, unless indicated otherwise in a credit line to the material. If material is not included in the article's Creative Commons
                                        licence and your intended use is not permitted by statutory regulation or exceeds the permitted use, you will need to obtain
                                        permission directly from the copyright holder. To view a copy of this licence, visit http://creativecommons.org/licenses/by/4.0/.
                                        The Creative Commons Public Domain Dedication waiver (http://creativecommons.org/publicdomain/zero/1.0/) applies to the
                                        data made available in this article, unless otherwise stated in a credit line to the data.
Yin et al. BMC Public Health (2021) 21:436 Page 2 of 11 Background and standardized comprehensive injury monitoring data- Children and adolescents are high-risk groups and key bases have resulted in the accumulation of authoritative, populations for injury prevention [1]. In recent years, valuable first-hand data for the analysis of injury spectra the global injury mortality rate of children has declined and pyramids for Chinese children and adolescents. overall, but the phenomenon of inequality in injury mortality between high-income countries (HICs) and lower-middle- and upper-middle-income countries Methods (LMICs) has expanded [2]. Road traffic injuries were the Settings leading cause of child deaths worldwide, followed by Zhuhai City, one of the monitoring points of the Chinese drowning [3]. According to China’s monitoring data for National Injury Surveillance System (NISS), is one of the 2014, the death rate for children and adolescents aged core cities in the Greater Bay Area of Guangdong, Hong 0–17 was 22.90/100,000. Approximately 65,000 children Kong and Macau, and one of the leading frontier cities in died from injuries each year. Injury was the leading China’s globalization process. The land area of Zhuhai cause of death for children aged 1–17. Approximately City is 1711.24 km2. The average number of resident 140,000 children suffer from nonfatal injuries; the main population in 2013–2017 was 16,315,60, of which males cause of death among Chinese children and adolescents accounted for 53.21%, the urban population accounted for is drowning and road traffic injuries [4]. The injury 55.10%, the floating population accounted for approxi- mortality rate or incidence rate, mechanism of occur- mately 31.30%, and the population aged 0–17 accounted rence, and injury patterns of different countries, regions for 18.10%. Zhuhai City has three administrative districts: and data sources vary widely [5–7]. Xiangzhou District is the city’s main urban area, and Although mortality is often used as a criterion for un- Jinwan District and Doumen District are the rural areas in derstanding the severity level of an injury, this approach the western region. In recent years, with the increasing represents an “iceberg” effect for injury. The severity of saturation of residential, industrial and commercial land an injury may vary depending on the injury mechanisms, in Xiangzhou District, Jinwan District and Doumen Dis- demographic characteristics, and prognosis; therefore, it trict are experiencing rapid population growth and accel- is not possible to fully understand injury status through erating urbanization. mortality or a single source of injury statistics [8]. The There are three sentinel monitoring hospitals in Zhuhai bottom of the injury pyramid to the top includes the in- City that are included in the NISS for collecting outpatient/ jury cases treated in outpatient/emergency departments, emergency department injury cases. Of these three hospi- injury hospitalizations, and injury deaths. Depicting the tals, 2 of them are distributed in urban areas, and 1 is in a “injury pyramid” can help us understand and grasp the rural area; they are government-sponsored comprehensive whole picture of the injury. Lee [9] described the injury hospitals with the ability to treat patients with emergency pyramid ratio for children and adolescents living in Mas- injuries. The hospitalization data obtained in this study sachusetts in the United States as 1:36:1014. The injury cover 24 hospitals that can provide hospitalization for injur- pyramid ratio among South Korean teenagers (13–18 ies. There are 15 hospitals in urban areas and 9 hospitals in years old) was 1:162:492 [10]. The unintentional injury rural areas. The hospitals’ diagnosis and treatment cover all pyramid ratio in South Korea was 1:54:231 [8]. The permanent residents, including both floating and household injury pyramid ratio of the Missouri and Nebraska popu- populations. The death data came from the Chinese na- lation of the United States was 1:10:147 [11]. Based on tional population death information registration manage- family surveys, the injury pyramid ratio in Iran was 1:50: ment system, which also covers all permanent residents. 646 [12]. The injury pyramid ratios vary among different countries, regions, and populations. In some areas of Data collection China, research on the injury pyramids of the whole The period for obtaining data was from January 1st, population has been carried out [13, 14], but to date, 2013, to December 31st, 2017. there have been no reports on the injury pyramid for Chinese children and adolescents. The unclear mecha- nisms and severity of the injuries in the injury pyramids Outpatient/emergency departments for Chinese children and adolescents prevent the Injured patients aged 0 ~ 17 years who first visited an prioritization of interventions. outpatient/emergency department in one of the three in- The comprehensive use of injury information that jury monitoring hospitals in Zhuhai City were selected integrates deaths, hospitalizations, and outpatient/emer- as subjects. The personal information of the injured gency department visits can provide a reliable basis for patient, the basic situation of the injury event, and the the development of injury prevention strategies. Continu- clinical information related to the injuries were derived ous and systematic collection of injury-related information from the NISS.
Yin et al. BMC Public Health (2021) 21:436 Page 3 of 11
Hospitalization Population data
The inpatients who were 0 ~ 17 years old, had experi- The population data of residents 0 to 17 years old from
enced their first hospitalization because of injuries and 2013 to 2017 were derived from the basic information
were diagnosed with an injury (indicated by an external system in the Chinese disease prevention information
cause code of V01-Y98) according to The International control system. In the resident population data, there
Statistical Classification of Diseases and Related Health was a specific value for every 1 year of age between 0
Problems 10th Revision (ICD-10) were selected as and 9 years, but summations were provided for the
subjects (Table 1). The data came from the Medical children/adolescents aged 10 to 14 and 15 to 19 years
Information Management Platform of Zhuhai City, old. We divided the population of subjects aged 10 to
which collected information such as personal informa- 14 years old and 15 to 19 years old evenly and added
tion on inpatients and clinical features of injuries. There them to the specific populations of other age groups to
were 24 hospitals covering all residents in the city with calculate the population numbers for the subjects aged 6
inpatient treatment wards. to 11 years, 12 to 14 years and 15 to 17 years (Table 2).
Death
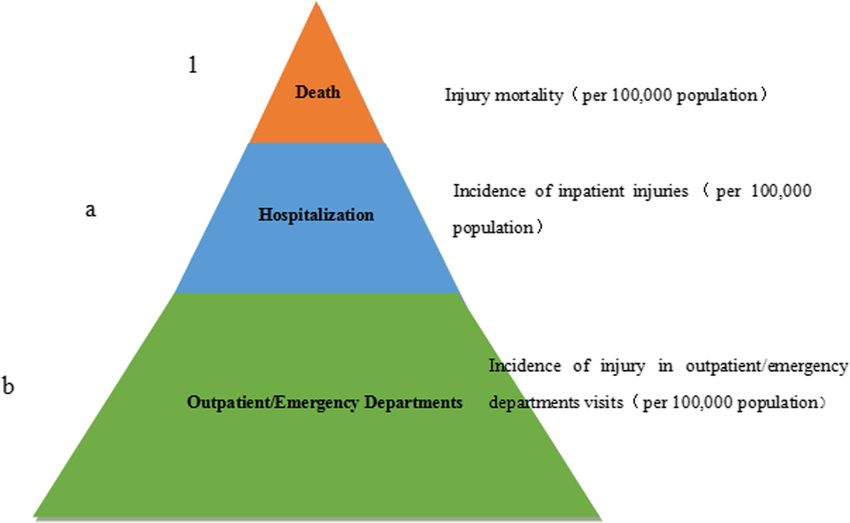
Statistics of the injury pyramid ratio
The death data came from the Chinese national popula-
The injury pyramid ratio (1, a: b) was calculated as
tion death information registration management system.
shown in the figure: a = incidence of inpatient injuries/
According to their current address, all the children and
injury mortality, which means that every injury death
adolescents aged 0–17 who died from injuries (root
occurred accompanying an injury hospitalization cases;
causes of death codes V01-Y98) in the resident population
b = incidence of injuries in outpatient/emergency depart-
were identified. The data collected by this registry system
ment visits/injury mortality, which represented every
included the personal information of the deceased, the
injury death that occurred accompanying b outpatient/
place of death, and the basis causes of disease diagnosis.
emergency department injury cases (Fig. 1).
Table 1 The mechanisms of injuries and ICD-10 code Statistical indicators
Mechanisms of injuries ICD-10 code Injury mortality (per 100,000 population) = total deaths
Road traffic injuries V01-V89 (due to injury) in a certain period / number of resident
Falls W00-W19
population × 100,000 .
Incidence of inpatient injuries (per 100,000 popula-
Bruise/crush/glass or knife W20-W31
cut/machine accident tion) = number of inpatient injuries cases / number of
resident population × 100,000. Because the current resi-
Foreign matter entering W41-W49
the eye or other cavity/ dent area was unknown for 1175 cases of hospitalized
cutting and puncture injuries, these cases were split according to the propor-
device injuries tions of the average populations of urban and rural areas
Boxing and punching W50- W52 in 2013–2017 between the number of urban and rural
injuries in sports
hospitalizations for injuries to calculate the incidence of
Animal bites W53-W59 injury hospitalizations.
Drowning W65-W74 Incidence of outpatient/emergency department injury
Asphyxiation W75-W84 visits (per 100,000 population) = total number of out-
Fires and burns X00-X19 patient emergency department injury visits (n / p) /
number of resident population × 100,000.
Poisoning X20-X29,X40-X49
p: Community survey results were used to estimate the
Overwork/travel and X50- X57
poverty
probability that injury patients visit outpatient/emer-
gency departments at NISS monitoring hospitals. Data
Self-harm/suicide X60-X84
from a retrospective survey based on the entire popula-
Harm by others X85-Y09 tion conducted in the same city in 2011 [14] showed
Drug reaction/medical Y40-Y84 that of the 2060 people who were surveyed in the
accident/surgery and
medical complications
community, 350 reported an injury within 6 months of
survey administration, and 88 of them visited outpatient/
Others W32-W40, W60, W64,
W85-W99, V90-V99, emergency departments at NISS monitoring hospitals,
X30-X39, X58-X59, p = 0.251. n: Number of injury cases that saw a doctor
Y10-Y34, Y35-Y36, at an outpatient/emergency department in an NISS
Y85-Y89,Y90-Y98
monitoring hospital.Yin et al. BMC Public Health (2021) 21:436 Page 4 of 11
Table 2 Number of residents aged 0–17 in Zhuhai City, 2013 ~ 2017
Years Gender Region Age group (years old) Total
Male Female Urban Rural 0~2 3~5 6 ~ 11 12 ~ 14 15 ~ 17
2013 156,000 132,045 165,540 122,505 44,367 36,315 84,196 44,647 78,520 288,045
2014 155,127 133,815 166,034 122,908 44,505 36,415 84,444 44,774 78,804 288,942
2015 162,682 128,763 167,556 123,889 44,894 36,783 85,243 45,223 79,302 291,445
2016 159,388 136,586 170,113 125,861 45,170 37,394 86,700 45,976 80,734 295,974
2017 176,769 135,017 158,304 153,482 49,305 53,957 93,816 49,727 64,981 311,786
Statistical Package for the Social Sciences (19.0; IBM and other events also had a large impact on the health
Corp Armonk, NY, USA; SPSS) was used for statistical of children and adolescents (Table 3).
analysis. Falls were the leading mechanism of outpatient/emer-
gency department visits and hospitalizations for injured
Results children and adolescents in urban and rural areas.
Injury mechanisms Animal bites to children and adolescents in urban areas
The top three mechanisms for injuries in outpatient/ were a secondary mechanism of outpatient/emergency
emergency departments for children and adolescents visits, while in rural areas, the secondary mechanism was
were falls (52.02%), animal bites (14.57%), and blunt in- road traffic injuries. Among the mechanisms of injury
juries (10.60%). The top three injury mechanisms for deaths, road traffic injuries ranked first in urban areas,
hospitalizations were falls (37.33%), road traffic injuries while drowning ranked first in rural areas.
(17.87%), and fire/burns (14.29%), while the top three Among the mechanisms of injuries in outpatient/
mechanisms for injury deaths were drowning (32.91%), emergency department visits for boys and girls, the top
road traffic injuries (20.25%) and falls (13.92%). In two were falls and animal bites; blunt injuries accounted
addition, cuts, poisoning, asphyxiation, self-harm/suicide for the third mechanism for boys, and road traffic
Fig. 1 Schematic diagram of the injury pyramid ratiosYin et al. BMC Public Health (2021) 21:436 Page 5 of 11 Table 3 Injury mechanisms among children and adolescents in Zhuhai City, China injuries accounted for the third mechanism for girls. were falls, road traffic injuries, fires and burns (in different Boys and girls had the same top five ranking injury order). Regarding the injury death mechanisms, drowning mechanisms among injury hospitalizations. Among the ranked first for children and adolescents aged 0 to 11 mechanisms of injury deaths, drowning and road traffic years, the second mechanism of death for children aged 0 injuries accounted for the first two for boys and girls, to 2 years was suffocation, and the second mechanism of and the third ranking mechanisms were falls for boys death for children aged 3 to 11 years old was road traffic and asphyxiation for girls. injuries. The first mechanism of injury death among chil- Comparing the injury spectra of children and adoles- dren and adolescents aged 12 to 17 years was road traffic cents in different age groups, it was found that in the out- injury, the second was self-harm/suicide, and the third patient/emergency department visits, in addition to falls, was drowning (Table 4). which were the first ranking mechanism of injury in each age group, fires and burns for children aged 0 ~ 2 years Injury pyramid ratios old, animal bites among those ages 3–14 years, and blunt The incidence of outpatient/emergency department in- injuries among those ages 15–17 years old were the sec- jury visits for children and adolescents was 11,210.87/ ondary injury mechanisms. Among injury hospitalizations, 100,000, the incidence rate of injury hospitalization was the top three ranking injury mechanisms in all age groups 627.09/100,000, and the injury death rate was 10.70/100,
Yin et al. BMC Public Health   (2021) 21:436                                                                        Page 6 of 11

Table 4 Injury mechanisms among different regions, genders, and age groups of children and adolescents in Zhuhai City, China
Yin et al. BMC Public Health         (2021) 21:436                                                                                                 Page 7 of 11

000. For each injury death, there were 59 hospitalized in-                        States were road traffic injuries and firearm injuries.
juries and 1048 outpatient/emergency visits for injuries.                         There are differences in injury mortality patterns in
The injury pyramid ratios varied among different regions,                         different countries and regions.
sex, and age groups of children and adolescents. The in-                            Drowning is one of the leading causes of death among
jury pyramid ratio for drowning was 1:0.7:0.5 (Each injury                        children aged 5 to 14 years old in China [19]. The aver-
death that occurred was accompanied by 0.7 injury                                 age drowning mortality of children and adolescents in
hospitalization and 0.5 outpatient/emergency injury visit)                        Zhuhai was 3.52/100,000, which was lower than the na-
and in the shape of an inverted triangle, which was differ-                       tional average mortality (7.46/100,000) in China [4]. This
ent from falls (1:157:3914), road traffic injuries (1:52:452)                     difference may be related to the effectiveness of Zhuhai
and self-harm/suicide (1:3:20) (Table 5).                                         City’s interventions to reduce child drowning in recent
                                                                                  years, including health education for students, teachers,
Discussion                                                                        and guardians, the establishment of a school safety edu-
The average injury mortality rate of children and adoles-                         cation leadership group, and the implementation of a re-
cents in Zhuhai City from 2013 to 2017 was 10.70/100,                             sponsibility system to sign responsibility letters, among
000, which was lower than the injury mortality rate of                            other measures. Drowning in Malaysia was estimated at
global entire population (66.90/100,000) [15], higher                             5 per 100,000 people, including nondeath cases [20].
than the injury mortality rate of children and adolescents                        The overall drowning mortality rate in Nepal was 1.90
in HICs (7.70/100,000), and lower than the injury mor-                            per 100,000, but 53.00% of drownings occurred in people
tality rate of children and adolescents in LMICs (37.20/                          under 20 years old, and most drownings occurred in riv-
100,000) [16], while the average injury mortality of chil-                        ers (natural bodies of water) [21]. Drowning ranked first
dren and adolescents in Zhuhai City was also lower than                           in injury deaths among children and adolescents in rural
the total injury mortality of children aged 0–17 in China                         areas in Zhuhai City. Drowning is closely related to
in 2014 (22.90/100,000) [4] and lower than the injury                             temperature, environmental risks, and water-related risk
death rate of the entire population in Guangdong Prov-                            activities [22], especially in rural areas of Zhuhai, where
ince in 2015 (43.11/100,000) [17]. Drowning and road                              there are many rivers and ponds.
traffic injuries were the main causes of death among                                The average death rate attributable to road traffic in-
children and adolescents in Zhuhai City, which is con-                            juries for children and adolescents in Zhuhai was 2.17/
sistent with the major causes of death among children in                          100,000, which was lower than the national death rate of
China [18]. Road traffic injuries are the leading cause of                        road traffic injuries for children and adolescents (6.66/
child injury deaths worldwide, followed by drowning [3].                          100,000) [4]. This difference may be related to Zhuhai
The main causes of child injury deaths in the United                              City’s regulations prohibiting riding motorcycles and
Table 5 Injury pyramids ratios of children and adolescents in Zhuhai City, China
                                                     Incidence of outpatient/        Incidence of inpatient        Injury mortality (per        Injury pyramid
                                                     emergency department            injuries (per 100,000         100,000 population)          ratios
                                                     injury visits (per 100,000      population)
                                                     population)
Total                                                11,210.87                       627.09                        10.70                        1:59:1048
Region                     Urban                     13,688.03                       633.32                        8.46                         1:75:1618
                           Rural                     8050.49                         619.14                        13.57                        1:46:593
Gender                     Male                      13,638.37                       790.77                        12.22                        1:65:1116
                           Female                    8259.64                         428.08                        8.86                         1:48:932
Age group, years old       0~2                       16,820.13                       867.94                        22.34                        1:39:753
                           3~5                       19,051.17                       899.61                        16.43                        1:55:1160
                           6 ~ 11                    11,257.02                       622.70                        8.06                         1:77:1397
                           12 ~ 14                   7286.77                         485.35                        6.95                         1:70:1048
                           15 ~ 17                   6055.17                         430.51                        6.02                         1:72:1006
Injury mechanisms          Falls                     5832.28                         234.12                        1.49                         1:157:3914
                           Road traffic injuries     981.31                          111.77                        2.17                         1:52:452
                           Self-harm/suicide         16.46                           2.03                          0.81                         1:3:20
                           Drowning                  1.89                            2.51                          3.52                         1:0.7:0.5a
a
 The injury pyramid for drowning was in the shape of an inverted triangle, with each injury death that occurred was accompanied by 0.7 injury hospitalization
and 0.5 outpatient/emergency injury visit
Yin et al. BMC Public Health (2021) 21:436 Page 8 of 11 electric vehicles, which are available in only a few cities Studies in several countries have shown that rural chil- across the country, and the popularity of child safety dren and adolescents have higher injury mortality rates seats in recent years. From 1991 to 2015, the death rate than urban children [37, 38]. Rural children and adoles- attributable to road traffic injuries among children and cents in Zhuhai had an injury mortality rate of 13.57 per adolescents aged 1 to 14 years in Ireland decreased from 100,000, which was 1.60 times that of urban areas. Road 2.10/100,000 to 0.32/100,000 [23]. From 2006 to 2012, traffic injuries were the leading cause of injury deaths the incidence of road traffic injuries in Canadian chil- among children and adolescents in urban areas, and dren was 70.91/100,000, and the hospitalization rate for drowning injuries were the leading cause of injury deaths injuries decreased from 85.51/100,000 to 58.77/100,000 among children and in rural areas. These urban-rural [24]. With the implementation of the global “traffic differences could be caused by environmental factors, safety promotion”, the use of seat belts and appropriate residents’ behavioral factors, different infrastructure in- child safety seats has steadily increased, and the produc- vestments, and differences in access to emergency med- tion of safer cars, better road construction, and increased ical services [39]. public awareness of driving risk behaviors have reduced The mechanisms of injury deaths, injury hospitaliza- road traffic injuries among children and adolescents tions, and outpatient/emergency department injury visits [25, 26]. Although road traffic injuries for children showed obvious age characteristics, and there were and adolescents in Zhuhai City were lower than the differences in the injury spectra at different stages of mortality rate for children and adolescents in China, child development. A study in the United States showed road traffic injuries were still the main cause of death, that drowning was the most common cause of death for hospitalization and outpatient/emergency department children aged 1 to 4 years, and the causes of death from visits, and there is still much more space for improvement. injuries among those aged 10 to 19 years was mainly The global burden of disease estimates indicate that road traffic injuries, firearm injuries and suffocation [40]. 172 million falls result in short- or long-term disability The main mechanisms of injury hospitalizations for annually [27]. A cohort study in Brazil found that falls children aged 0–16 years in Australia were violence, were the most commonly reported injuries in all age poisoning, burns and road traffic injuries [41]. Falls were groups among children [28]. Falls among children and the most common mechanisms of nonfatal injuries to adolescents in Zhuhai City were the main reason for children in Nepal, followed by burns in preschool chil- hospitalization and outpatient/emergency department dren, and road traffic injuries were the most likely mech- visits. A large household survey covering more than one anisms of injury during adolescence [42]. For outpatient/ million people in Bangladesh in 2013 found that nonfatal emergency department injury visits and injury hospitali- falls were the most common injuries [29]. zations, falls were the leading cause of injury for all age Animal bites were one of the main reasons for chil- groups in Zhuhai City. Children in the younger age dren and adolescents to visit the outpatient/emergency group had more outpatient/emergency department visits department for injuries. A study showed that the inci- because of burns and animal bites. In the older age dence of animal bites in China was 245.05 per 100,000 group, there were more blunt injuries and cuts. Drown- in 2016 [30]. Although animal bites are mostly minor ing was the main cause of injury death among young injuries, as increasing numbers of pets enter the family, children, and road traffic injuries were the main cause of the problems caused by animal bites cannot not be injury death among children and adolescents in older ignored. age groups. A multicountry survey of children aged 14–17 years As a model for injury research, the injury pyramid can found that 8.90% of girls and 2.60% of boys reported visually show the relative effects of fatal and nonfatal in- self-harm incidents in the past year [31]. Studies by juries [43]. This study showed that, for every injury Muehlenkamp [32] and Swannell [33] showed that self- death among children and adolescents in Zhuhai, there harm/suicide behavior was prevalent in adolescents in were 59 injury hospitalizations and 1048 outpatient/ clinical and community samples. The suicide mortality emergency department visits for injuries. Similar to the rate of children and adolescents in Zhuhai City was injury pyramid (1:36:1014) described by Lee [9] for children 0.81/100,000. Most of them were older children aged and adolescents ≤19 years old living in Massachusetts, ≥12 years, and the suicidal tendency increased with age. USA, Ballesteros [44] also found that every injury death The self-harm/suicide rates of children and adolescents among children in the United States was accompanied by are rising in many high-income countries [34–36]. The approximately 1000 injury-related outpatient/emergency development trajectory, cultural background, risk factors department visits. Compared with the injury pyramid for and mechanisms, and independent diagnosis of self- South Korean adolescents (1:162:492) [10], for every injury harm/suicide among children and adolescents in China death, the percentage of injury hospitalizations of children will be the focus of future research. and adolescents in Zhuhai City was small, while the
Yin et al. BMC Public Health   (2021) 21:436                                                                     Page 9 of 11

proportion of outpatient/emergency department visits was        3 different pyramid types, with an inverted pyramid indi-
high. This difference may be due to different medical guar-     cating high-lethality injuries (C), a rectangular pyramid
antees in different countries, and China may have a rela-       indicating mid-level-lethality injuries (B), and a typical
tively heavy burden of hospitalization costs, which limits      pyramid indicating low-lethality injuries (A). The ratio
hospitalizations. In addition, the severity of the injury and   of injury pyramid of self-harm/suicide among South
the timeliness of treatment can also affect hospitalizations.   Korean youth was 1:7:15 [10], showing a steep pyramid
   Compared with the whole population injury pyramid,           (type C); this was similar to the injury pyramid of self-
the rate of outpatient/emergency department injury              harm/suicide among children and adolescents in Zhuhai
visits among children and adolescents was greater. The          City (1:3:20), indicating that self-harm/suicide had con-
injury pyramid ratio for unintentional injuries among           siderable lethality. The drowning injury pyramid was in
the entire South Korean population was 1:54:231 [8].            the shape of an inverted triangle, indicating that, for
The injury pyramid ratio in the entire population in            every injury death that occurred was accompanied by 0.7
Missouri and Nebraska was 1:10:147 [11]. The injury             injury hospitalization and 0.5 outpatient/emergency
pyramid ratio in Iran, based on a household survey, was         injury visit. It was observed that self-harm/suicide and
1:50:646 (deaths:hospitalizations:all injuries) [12]. Studies   drowning had very high mortality rates, but the numbers
in the same country still showed higher rates of injury         of outpatient/emergency department visits for these
among children and adolescents seen in the outpatient/          mechanisms were very small, resulting in steep and nar-
emergency departments. For example, the injury pyra-            row pyramids.
mid ratio for children who were ≤ 10 years old and came           The mortality rate of road traffic injuries among South
from Alberta, Canada, was 1:73:1612 [45], and the injury        Korean youth was 3.00/100,000, with an injury pyramid
pyramid ratio for children who were ≥ 12 years old and          ratio of 1:195:341 [10]. The death rate of road traffic in-
came from Ontario, Canada, was 1:25:363 [46]. Fatal in-         juries for children and adolescents in Zhuhai was 2.17/
juries were at the top of the injury pyramid, but minor         100,000, and the injury pyramid ratio was 1:52:452. The
nonfatal injuries were more common in children and ad-          shape of the injury pyramid for road traffic injuries was
olescents than adults, and the burden of minor nonfatal         type B, indicating that the mortality rate was low, but
injuries cannot be ignored.                                     the degree of injury was high. Type B injury pyramids
   This study showed that rural children and adolescents        have a cumulative effect on the use and cost of the med-
had higher injury mortality rates than urban children and       ical system that is far greater than type C. The injury
adolescents, while the incidence of outpatient/emergency        pyramid ratio for falls among children and adolescents
department visits for injuries was higher in urban areas        in Zhuhai was 1:157:3914. Falls had a low mortality rate,
than in rural areas. Compared to the urban injury pyramid       but the outpatient/emergency department visits were
(1:75:1618), the rural injury pyramid has a narrower shape      large in scale, forming a type A pyramid. An injury
(1:46:593), which was related to the difference between         mechanism with high lethality can reduce the occur-
injury-related death rates, hospitalization rates, and injury   rence of the injury itself through primary prevention;
mechanisms in urban and rural areas. Incidence/mortality        however, although the fatality rate of falls was very low,
was higher at all levels in boys than in girls. The frequency   the scale of occurrence was large, and the consumption
of fatal and nonfatal injuries was higher in males than in      of medical resources may be more serious.
females. Research in South Korea found that the injury
pyramids of children and adolescents aged 0 to 6 years (1:      Limitations
151:3657), 7 to 12 years (1:280:3011), and 13 to 18 years       The injury hospitalization data used in this study were
(1:132:594) showed that the younger the age, the wider          derived from a medical information management plat-
the bottom of the pyramid [8]. This study showed that the       form. We did not obtain the nature of injury codes, but
bottom of the injury pyramid was the widest among               only the external cause codes from hospital data systems,
participants aged 6 to 11 years; with each injury death that    and the external cause codes, which we mainly analyze,
occurred, there were the most injury hospitalizations and       may be misclassifications. However, due to a problem with
outpatient/emergency department injury visits. The high-        platform integration, only 6 medical institutions were in-
est injury mortality was observed in children aged 0 to 2       cluded in 2013; this number increased year by year until it
years, and this injury pyramid had the narrowest bottom         reached 24 included institutions in 2017 (essentially cover-
(1:39:753). The rest of the children aged 3 to 5 years (1:55:   ing all medical institutions with the ability to treat injur-
1160), 12 to 14 years (1:70:1048), and 15 to 17 years (1:72:    ies). Therefore, the incidence of injury hospitalizations
1006) had similar pyramid shapes. Injuries were more            may be underestimated. In addition, there was a lack of
lethal to children in younger age groups.                       information on some subjects’ current addresses, and the
   Wadman MC [11] believed that according to the                urban or rural area residence of some subjects could not
lethality of the injury mechanism, injury data will lead to     be determined. The incidence of outpatient/emergency
Yin et al. BMC Public Health        (2021) 21:436                                                                                                Page 10 of 11

department injury visits was estimated based on the re-                         Ethics approval and consent to participate
sults of community surveys in the literature; these estima-                     This study protocol had been approved by the Ethics Committee of Center
                                                                                for Disease Control and Prevention of Zhuhai City, and followed the tenets
tion methods may make the estimation efficiency low.                            of the Declaration of Helsinki.
  Most minor injuries were difficult to estimate because
they did not seek health care services. In addition, there                      Consent for publication
                                                                                Not applicable.
may be injury sequelae among survivors of severe injuries,
leading to even more important estimates of disability                          Competing interests
levels. Ideally, the injury pyramid should include untreated                    The authors declare no conflict of interest.
cases and injuries caused by disability, which is also a
                                                                                Author details
direction for future efforts.                                                   1
                                                                                 Department of Public Health and Health Research, Center for Disease
                                                                                Control and Prevention of Zhuhai City, Zhuhai, China. 2Department of
                                                                                Maternal and Child Health, School of Public Health, Tongji Medical College,
Conclusions                                                                     Huazhong University of Science and Technology, Wuhan, China.
The injury mechanisms were different among outpatient/
                                                                                Received: 24 February 2020 Accepted: 10 February 2021
emergency department visits, hospitalizations, and deaths
among children and adolescents. Falls, animal bites, road
traffic injuries, fires and burns were the main injuries for                    References
which children and adolescents sought medical treatment;                        1. Alonge O, Khan UR, Hyder AA. Our shrinking globe: implications for child
                                                                                    unintentional injuries. Pediatr Clin N Am. 2016;63(1):167–81.
drowning and road traffic injuries were the main causes of                      2. Sethi D, Aldridge E, Rakovac I, Makhija A. Worsening inequalities in child
injury deaths. The sexes have different injury mechanisms                           injury deaths in the WHO European region. Int J Environ Res Public Health.
at different stages of child development, and interventions                         2017;14(10):1–8.
                                                                                3. Global Burden of Disease Child and Adolescent Health Collaboration,
should be formulated accordingly.                                                   Kassebaum N, Kyu HH, Zoeckler L, Olsen HE, Thomas K, et al. Child and
  For every case of injury death among children and                                 adolescent health from 1990 to 2015: Findings from the global burden
adolescents, there were nearly 60 hospitalized injuries                             of diseases, injuries, and risk factors 2015 study. JAMA Pediatr. 2017;
                                                                                    171(6):573–92.
and thousands of injury-related outpatient/emergency                            4. Liang X. Injury report of Chinese children (in Chinese). Beijing: People's
department visits. Minor nonfatal injuries were more                                Medical Publishing House; 2017.
common in children and adolescents. The size and                                5. Burrows S, Auger N, Lo E. Language and unintentional injury mortality in
                                                                                    Quebec, Canada. Inj Prev. 2016;22(1):72–5.
shape of the injury pyramid varied by age, sex, and re-                         6. Matzopoulos R, Prinsloo M, Pillay-van Wyk V, Gwebushe N, Mathews S,
gion; that is, there were differences in the severity and                           Martin LJ, et al. Injury-related mortality in South Africa: a retrospective
extent of the injuries. The injury pyramids suggested                               descriptive study of postmortem investigations. Bull World Health Organ.
                                                                                    2015;93(5):303–13.
that self-harm/suicide and drowning had very high                               7. Lin Y, Chen M, Chen G, Wu X, Lin T. Application of an autoregressive
mortality rates. Road traffic injuries had a low mortality                          integrated moving average model for predicting injury mortality in Xiamen,
rate and a high degree of injury; falls had a low mortality                         China. BMJ Open. 2015;5(12):e008491.
                                                                                8. Kim A, Song H, Park N, Choi S, Cho J. Injury pyramid of unintentional
rate, but the scale of outpatient/emergency visits was                              injuries according to sex and age in South Korea. Clin Exp Emerg Med.
large.                                                                              2018;5(2):84–94.
                                                                                9. Lee LK, Fleegler EW, Forbes PW, Olson KL, Mooney DP. The modern
                                                                                    paediatric injury pyramid: injuries in Massachusetts children and
Abbreviations
                                                                                    adolescents. Inj Prev. 2010;16(2):123–6.
HICs: High-income countries; LMICs: Lower-middle- and Upper-middle-
                                                                                10. Han H, Park B, Park B, Park N, Park JO, Ahn KO, et al. The pyramid of injury:
income countries; NISS: National Injury Surveillance System
                                                                                    estimation of the scale of adolescent injuries according to severity. J Prev
                                                                                    Med Public Health. 2018;51(3):163–8.
Acknowledgments                                                                 11. Wadman MC, Muelleman RL, Coto JA, Kellermann AL. The pyramid of injury
We thank the surveillance hospitals for their work and support. We would            using:Ecodes to accurately describe the burden of injury. Ann Emerg Med.
like to thank American Journal Experts (https://www.aje.cn/services/editing/)       2003;42(4):468–78.
for Language editing service.                                                   12. Saadat S, Mafi M, Sharif-Alhoseini M. Population based estimates of non-
                                                                                    fatal injuries in the capital of Iran. BMC Public Health. 2011;11:608.
                                                                                13. Mengjue H, Wenjun M, Yanjun X, HaoFeng X, Xiuling S, Shaoping N, et al.
Authors’ contributions                                                              Survey on injury spectrum and economic burden of injuries in residents of
YXL conducted the data analysis, and drafted and revised the manuscript.            Guangdong Province(in Chinese). South China Prev Med J. 2013;39(1):18–22.
DWC collected the data and critically reviewed the manuscript. DYK              14. Yuan W, Leilei D, Xiao D, Wei J, Sijie L. Methodological studies on injury
reviewed the manuscript. LDY conceived and designed the study, directed             comprehensive surveillance (in Chinese). Chin J Health Educ. 2012;28(4):
the statistical analysis. All authors approved the final manuscript as              248–51.
submitted and agree to be accountable for all aspects of the work.              15. Haagsma JA, Graetz N, Bolliger I, Naghavi M, Higashi H, Mullany EC, et al.
                                                                                    The global burden of injury: incidence, mortality, disability-adjusted life
Funding                                                                             years and time trends from the global burden of disease study 2013. Inj
No external funding for this manuscript.                                            Prev. 2016;22(1):3–18.
                                                                                16. WHO. Child and adolescent injury prevention: A WHO Plan of action 2006-
                                                                                    2015. Geneva: WHO Press. p. 2006.
Availability of data and materials                                              17. Meng R, Xu X, Xu Y, Luo C, Xu H, Wang Y, et al. Epidemiological
The datasets used and/or analysed during the current study are available            characteristics of injury mortality in Guangdong Province, China, 2015. BMC
from the corresponding author on reasonable request.                                Public Health. 2019;19(1):142.
Yin et al. BMC Public Health (2021) 21:436 Page 11 of 11
18. Chan KY, Yu XW, Lu JP, Demaio AR, Bowman K, Theodoratou E. Causes of 41. Seah R, Lystad RP, Curtis K, Mitchell R. Socioeconomic variation in injury
accidental childhood deaths in China in 2010: a systematic review and hospitalisations in Australian children ≤ 16 years: a 10-year population-based
analysis. J Glob Health. 2015;5(1):010412. cohort study. BMC Public Health. 2018;18(1):1336.
19. Fadel SA, Boschi-Pinto C, Yu S, Reynales-Shigematsu LM, Menon GR, 42. Pant PR, Towner E, Ellis M, Manandhar D, Pilkington P, Mytton J.
Newcombe L, et al. Trends in cause-specific mortality among children aged 5- Epidemiology of unintentional child injuries in the Makwanpur District of
14 years from 2005 to 2016 in India, China, Brazil, and Mexico: an analysis of Nepal: a household survey. Int J Environ Res Public Health. 2015;12(12):
nationally representative mortality studies. Lancet. 2019;393(10176):1119–27. 15118–28.
20. Hss AS, Tan PS, Hashim L. Childhood drowning in Malaysia. Int J Inj Control 43. Frieden TR. A framework for public health action: the health impact
Saf Promot. 2014;21(1):75–80. pyramid. Am J Public Health. 2010;100(4):590–5.
21. Sedain B, Pant PR. Status of drowning in Nepal: A study of central police 44. Ballesteros MF, Schieber RA, Gilchrist J, Holmgreen P, Annest JL. Differential
data. F1000Res. 2018;7:576. ranking of causes of fatal versus non-fatal injuries among US children. Inj
22. Zhu Y, Xu G, Li H, Huang Y, Ding K, Chen J. Epidemiology and Risk Factors Prev. 2003;9(2):173–6.
For Nonfatal Drowning in The Migrant Children. Southeast Asian J Trop 45. Spady DW, Saunders DL, Schopflocher DP, Svenson LW. Patterns of injury in
Med Public Health. 2015; 46(6):1112–1123.PMID: 26867370. children: a population based approach. Pediatrics. 2004;113(3):522–9.
23. McGarvey C, Hamilton K, Donnelly J, Nicholson AJ. Trends in road transport 46. Sahai VS, Ward MS, Zmijowskyj T, Rowe BH. Quantifying the iceberg effect
collision deaths in the Irish paediatric population: a retrospective review of for injury. Can J Public Health. 2005;96(5):328–32.
mortality data, 1991-2015. BMJ Paediatr Open. 2019;3(1):e000361.
24. Fridman L, Fraser-Thomas JL, Pike I, Macpherson AK. Childhood road traffic
injuries in Canada - a provincial comparison of transport injury rates over
Publisher’s Note
Springer Nature remains neutral with regard to jurisdictional claims in
time. BMC Public Health. 2018;18(1):1348.
published maps and institutional affiliations.
25. Ning P, Schwebel DC, Huang H, Li L, Li J, Hu G. Global Progress in road
injury mortality since 2010. PLoS One. 2016;11(10):e0164560.
26. Xie SH, Wu YS, Liu XJ, Fu YB, Li SS, Ma HW, et al. Mortality from road traffic
accidents in a rapidly urbanizing Chinese city: a 20-year analysis in
Shenzhen, 1994-2013. Traffic Inj Prev. 2016;17(1):39–43.
27. GBD 2017 Disease and Injury Incidence and Prevalence Collaborators.
Global, regional, and national incidence, prevalence, and years lived with
disability for 354 diseases and injuries for 195 countries and territories,
1990–2017: a systematic analysis for the Global Burden of Disease Study
2017. Lancet. 2018;392(10159):1789–858.
28. Barcelos RS, Santos IS, Matijasevich A, Barros AJ, Barros FC, França GV, et al.
Falls, cuts and burns in children 0-4 years of age: 2004 Pelotas (Brazil) birth
cohort. Cad Saude Publica. 2017;33(2):e00139115. https://doi.org/10.1590/01
02-311X00139115.
29. Wadhwaniya S, Alonge O, Ul Baset MK, Chowdhury S, Bhuiyan AA, Hyder
AA. Epidemiology of Fall Injury in Rural Bangladesh. Int J Environ Res Public
Health. 2017; 14(8): pii: E900.
30. Ye PP, Jin Y, Ji CR, Er YL, Duan LL, Li ZX. Disease burden of animal injury in
China, 1990-2016(article in Chinese). Chin J Epidemiol. 2019;40(1):52–8.
31. Madge N, Hewitt A, Hawton K, de Wilde EJ, Corcoran P, Fekete S, et al.
Deliberate self-harm within an international community sample of young
people: comparative findings from the child and adolescent self-harm in
Europe (CASE) study. J Child Psychol Psychiatry. 2008;49(6):667–77.
32. Muehlenkamp JJ, Claes L, Havertape L, Plener PL. International prevalence of
adolescent non-suicidal self-injury and deliberate self-harm. Child Adolesc
Psychiatry Ment Health. 2012;6:10.
33. Swannell SV, Martin GE, Page A, Hasking P, St John NJ. Prevalence of
nonsuicidal self-injury in nonclinical samples: systematic review, meta-
analysis and meta-regression. Suicide Life Threat Behav. 2014;44(3):273–303.
34. Morgan C, Webb RT, Carr MJ, Kontopantelis E, Green J, Chew-Graham CA,
et al. Incidence, clinical management, and mortality risk following self-harm
among children and adolescents: Cohort study in primary care. BMJ. 2017;
359:j4351.
35. Hedegaard H, Curtin SC, Warner M. Suicide Rates in the United States
Continue to Increase. NCHS Data Brief. 2018;(309):1–8 PMID: 30312151.
36. Jack SPD, Petrosky E, Lyons BH, Blair JM, Ertl AM, Sheats KJ, et al.
Surveillance for violent deaths - National Violent Death Reporting System,
27 states, 2015. MMWR Surveill Summ. 2018;67(11):1–32.
37. Mitchell RJ, Chong SL. Comparison of injury-related hospitalised morbidity
and mortality in urban and rural areas in Australia. Rural Remote Health.
2010;10(1):1326. 20230166.
38. Kristiansen T, Rehn M, Gravseth HM, Lossius HM, Kristensen P. Paediatric
trauma mortality in Norway: a population-based study of injury
characteristics and urban-rural differences. Injury. 2012;43(11):1865–72.
39. Staton C, Vissoci J, Gong E, Toomey N, Wafula R, Abdelgadir J, et al. Road
traffic injury prevention initiatives: a systematic review and metasummary of
effectiveness in low and middle income countries. PLoS One. 2016;11(1):
e0144971.
40. Cunningham RM, Walton MA, Carter PM. The major causes of death in
children and adolescents in the United States. N Engl J Med. 2018;379(25):
2468–75.You can also read