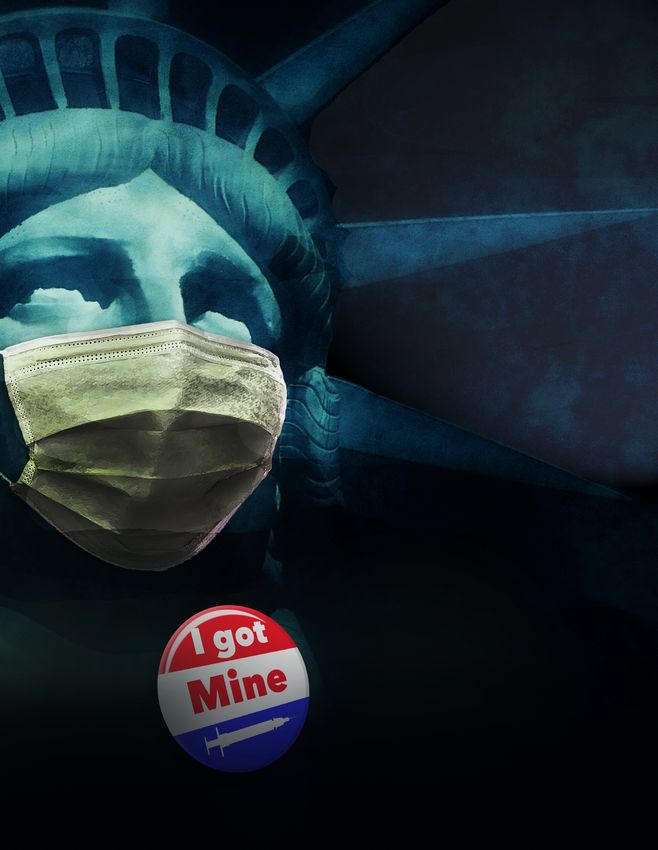
COVID-19 DEATH AND VACCINATION RATES - FOR LATINOS IN NEW YORK CITY
←
→
Page content transcription
If your browser does not render page correctly, please read the page content below
COVID-19 DEATH AND
 VACCINATION RATES
                  FOR LATINOS IN
                  NEW YORK CITY

Paul M. Ong, Lauren Harper, Nataly
Rios, Rodrigo Domínguez-Villegas 1
                                       May 18, 2021
          1
            Paul M. Ong, Ph.D., Director, UCLA Center for
       Neighborhood Knowledge (CNK); Lauren Harper,
      B.S., Researcher, CNK; Nataly Rios Gutiérrez, B.A.,
   Researcher, CNK; Rodrigo Domínguez-Villegas, Ph.D.,
Director, UCLA Latino Policy and Politics Initiative (LPPI)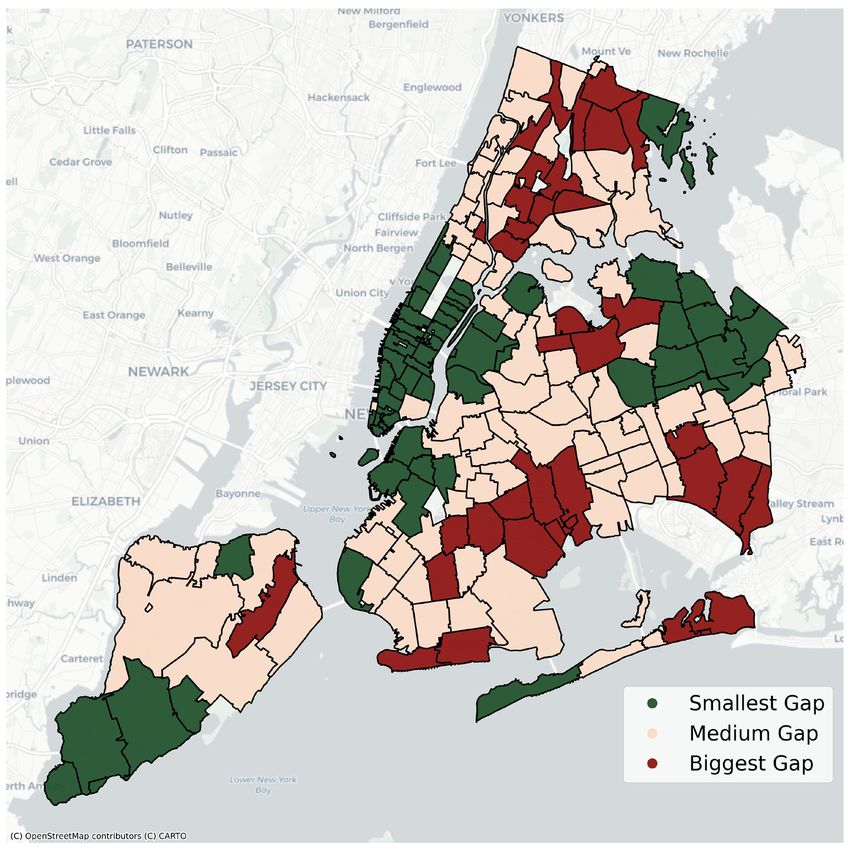
Acknowledgements
We are thankful to the UCLA Center for Health Policy Research for providing partial funding to support the
analysis by disaggregated ethnicity. The Center for Neighborhood Knowledge (CNK) and the Latino Policy
and Politics Initiative (LPPI) are grateful to all our funders that make our work possible. The authors would
  like to thank Victor Tran for his comments and research assistance, Kassandra Hernandez for editorial
                   support, and Andrea Cannon for her cover design and report layout.

   This project builds on UCLA’s Center for Neighborhood Knowledge (CNK) COVID-19 Equity Research
Initiative, which includes studies examining how the negative impacts of COVID-19 are distributed across
                    neighborhoods and on LPPI’s research on racial health disparities.

    As a land grant institution, the Latino Policy and Politics Initiative and the Center for Neighborhood
 Knowledge at UCLA acknowledge the Gabrielino and Tongva peoples as the traditional land caretakers
of Tovaangar (Los Angeles basin, Southern Channel Islands), and that their displacement has enabled the
                                            flourishing of UCLA.

                                     About Our Centers
     The UCLA Center for Neighborhood Knowledge specializes in empirical spatial analysis to inform
    policy and planning action and explicitly emphasizes the study of immigrant enclaves, low-income
                                neighborhoods, and minority communities.

   The UCLA Latino Policy and Politics Initiative addresses the most critical domestic policy challenges
 facing Latinos and other communities of color through research, advocacy, mobilization, and leadership
                      development to expand genuine opportunity for all Americans.

  The Center for Puerto Rican Studies, Hunter College, CUNY (Centro) is the nation’s leading university-
   based institution devoted to the interdisciplinary study of the Puerto Rican experience in the United
States. Centro is dedicated to understanding, preserving, and sharing the Puerto Rican experience in the
United States. Centro seeks to link scholarship to social action and policy debates, and to contribute to the
                betterment of our community and the enrichment of Puerto Rican studies.

                                            Disclaimer
    The views expressed herein are those of the authors and not necessarily those of the University of
   California, Los Angeles as a whole. The authors alone are responsible for the content of this report.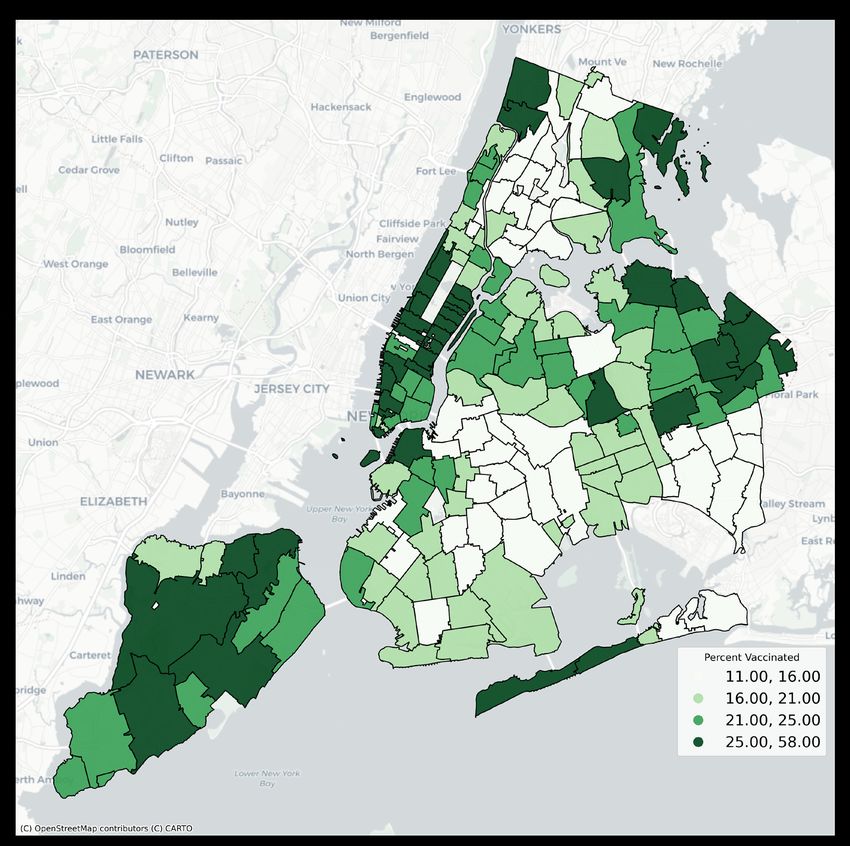
Table of Contents
PREFACE                                                                04

EXECUTIVE SUMMARY                                                      05

BACKGROUND                                                             06
COVID-19 VACCINATION POLICIES AND EFFORTS IN NEW YORK CITY             06
STRUCTURAL DISADVANTAGES FOR LATINOS’ ACCESS TO THE COVID-19 VACCINE   06

FINDINGS                                                               09
CITY-WIDE COVID-19 DEATH AND VACCINATION DISPARITIES                   09
GEOGRAPHY OF COVID-19 DEATHS AND VACCINATION                            11
SPATIAL-RACIAL DISPARITIES                                             14

CONCLUSION AND RECOMMENDATIONS                                         19

APPENDIX: DATA AND GAP INDEX CONSTRUCTION                              20

ENDNOTES                                                               22
COVID-19 Death and Vaccination Rates for Latinos in New York City

PREFACE

The disproportionate impacts of the Coronavirus Disease 2019 (COVID-19) pandemic on racial and ethnic
minority groups in the United States are already well-documented. However, Black, Asian, and Hispanic
communities are not monolithic populations. Rather, they experience unequal impacts across age groups,
geographies, and social contexts. Healthcare researchers and social scientists are examining these factors to
better measure the unequal distribution of health outcomes in the context of the pandemic and the potential
role of existing underlying disparities in these outcomes.

While aggregate group comparisons between White, Hispanic, and Black populations are possible, data at
the neighborhood level is rarely collected or disaggregated for subpopulations within these major racial and
ethnic groups. Existing national studies, such as the U.S. Census Bureau’s Household Pulse Survey measuring
household experiences during the pandemic, do not currently have a large enough sample size to disaggregate
the major racial and ethnic groups and assess in-group differential impacts. Consequently, researchers must
use indirect approaches to estimate the impact of the pandemic on population subgroups.

This study uses bivariate correlations at the ZIP code level to examine COVID-19 death and vaccine disparities
within the Hispanic population in New York City. The study disaggregates Hispanics by age, education,
and ethnicity. Disparities are evident and consistent with historical findings for this population. Hispanics
are disadvantaged relative to non-Hispanic Whites, even among the elderly and highly educated. Ethnic
differences among Hispanics are minor, indicating a shared liability. In other words, Hispanics consistently bear
a disproportionate share of COVID-19 deaths while facing barriers to vaccination.

By contributing to our understanding of the sources and patterns of disparities between Hispanics and other
groups and within Hispanic subpopulations, this study contributes to determining and implementing public
health measures that will have the greatest beneficial impact on those most affected by the pandemic. As
the authors conclude, we still have a long road ahead. More studies are necessary to measure the differential
impact of COVID-19 between and within racial and ethnic groups. A more concerted effort is needed to collect
data that will allow a more direct assessment of health outcomes and the factors contributing to disparities.

Edwin Melendez, PhD
Director, Center for Puerto Rican Studies
Professor of Urban Policy and Planning

                                                         4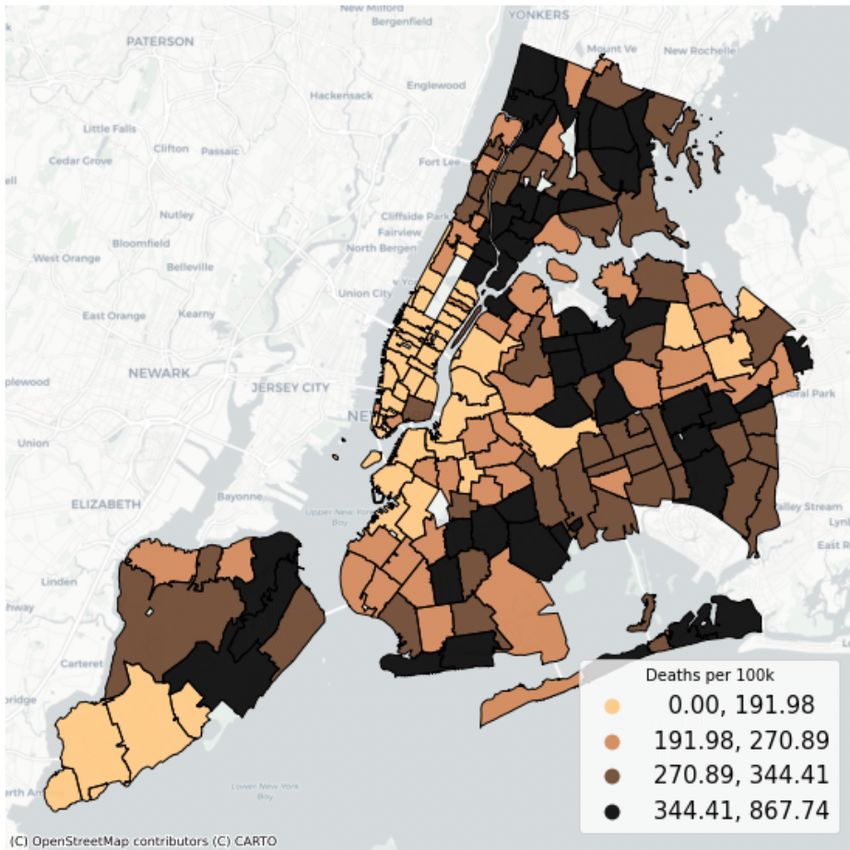
COVID-19 Death and Vaccination Rates for Latinos in New York City

EXECUTIVE SUMMARY

This brief compares the overall Coronavirus Disease 2019 (COVID-19) death and vaccination rates of
Latinos and non-Hispanic whites (NH Whites) and describes the geographic pattern of these rates across
neighborhoods in New York City (NYC).i As the first major epicenter of the COVID-19 pandemic, NYC is an
important case study. During the initial three months of the pandemic, there were 203,000 confirmed cases
with a crude fatality rate of 9.2 percent overall and 32.1 percent among those hospitalized.ii NYC is home to 2.6
percent of the nation’s population, but 5.7 percent of the nation’s COVID-related deaths occurred there.iii

The available data on the pandemic reveal that Latinos were disproportionately impacted by COVID-19
infections, hospitalization, and deaths.iv Given this disparity, prioritizing this population for vaccination is
critically important. The effort should focus on immunizing individuals in predominantly Latino neighborhoods
to lower contagion risk, given that elevated risks are associated with both individual and neighborhood
characteristics.v To assess whether vaccines are adequately reaching this population, we analyze available
data to compare outcomes for Latinos and NH Whites (see Appendix for a discussion on data and methods).

Our major findings and recommendations are:

    •    Latinos in NYC are 1.4 times more likely to be infected and almost twice as likely to be hospitalized
         and die from COVID-19 as NH Whites.

    •    Despite disproportionately high COVID-19 impacts, vaccination rates among Latinos in NYC are
         less than three-fifths that of NH Whites.

    •    Differences in reluctance to vaccination are insufficient to explain the disparity faced by Latinos.

    •    On average, NYC neighborhoods with the highest death rates have lower vaccination rates,
         creating a vaccination gap between neighborhoods with the greatest need and the least need.

    •    There are geographic disparities in NYC COVID-19 death rates and vaccination rates.
         Neighborhoods in the Bronx and portions of Queens, Brooklyn, and Staten Island have high death
         rates and low vaccination rates, while neighborhoods in Manhattan south of Harlem (excluding
         Chinatown) and in some parts of Brooklyn and Queens closer to Manhattan have relatively lower
         death rates and high vaccination rates.

    •    Relative to NH Whites, Latinos at various ages and education levels disproportionately reside in
         NYC neighborhoods with the greatest death-vaccination gap, meaning that they have relatively
         high death rates and relatively low vaccination rates.

    •    Political commitments to an equitable distribution of vaccines should be aggressively implemented
         through evidence-based actions, greater community engagement, and performance-based
         accountability.

The brief is organized as follows. We begin with a background section describing COVID-19 vaccination
policies and efforts in New York City to date and the structural disadvantages Latinos in NYC might face to
access the vaccine. We then present the findings from our analyses, which include quantification of city-wide
COVID-19 death and vaccination disparities between Latinos and NH Whites and a spatial-racial analysis of
these disparities. We end with a conclusion and recommendations.

                                                           5
COVID-19 Death and Vaccination Rates for Latinos in New York City
BACKGROUND
COVID-19 VACCINATION POLICIES AND EFFORTS IN NEW YORK CITY
New York City (NYC) made history when a critical care nursing director in Queens received the first vaccine
administered in the United States on December 14, 2020. That day marked the start of vaccination distribution
across the country.vi
Since then, New York has administered vaccinations using a tiered rollout system based on prioritization of
population groups deemed most vulnerable. Under this system, healthcare workers and all residents and staff
in approximately 600 nursing homes and long-term care facilities across the state were first priority.vii The
state then expanded vaccinations for essential workers, people over 60, and people with other high-risk health
conditions.viii On March 30, 2021, Governor Andrew Cuomo announced that all individuals 30 years and older
were eligible for vaccination.ix On April 6, 2021, he extended vaccine eligibility to all New York residents over
the age of 16.
The state’s guiding principles for vaccine distribution emphasize an “equitable and clinically driven distribution.”
Despite efforts and concerns surrounding equitable distribution, including New York City Mayor Bill de Blasio’s
vow to expand access in communities most affected by the virus, Latino and Black communities are being
vaccinated at lower rates than non-Hispanic White (NH White) communities.x
STRUCTURAL DISADVANTAGES IN LATINOS’ ACCESS TO THE COVID-19 VACCINE
Certain demographic characteristics of the Latino population in NYC, including age, income, and education,
could pose challenges to vaccine access.xi
Approximately 2.4 million Latinos reside in NYC, comprising about 29 percent of the city’s population. NYC is
home to proportionately more Latinos and fewer NH Whites than the nation as a whole (Figure 1). Outreach to
such large populations poses logistical challenges for public health authorities.
6COVID-19 Death and Vaccination Rates for Latinos in New York City
Figure 1: Population by Race/Ethnicity in the United States and New York City, 2019
100% 3.6% 3.0%
90% 18.4% 29.1%
80%
Percent of the Population
5.6%
70%
12.4%
60% 14.3%
50% 21.7%
40%
60.0%
30%
20%
31.9%
10%
0%
United States New York City
Non-Hispanic Whites Non-Hispanic Blacks Non-Hispanic Asians
Latinos (All Races) Other
Note: While we use the term Latino, the data analyzed is from the U.S. Census, which uses the term Hispanic.
Sources: American Community Survey, 2019.
The Latino population is proportionally younger than other racial/ethnic groups in New York City. For
example, less than 12 percent of Latinos are over 65 years old compared to almost 20 percent of NH Whites.
Consequently, comparatively fewer Latinos had access to the vaccine in the early stages of the rollout.
Figure 2: Percent Over 65 Years Old by Race/Ethnicity in the United States and New York City, 2019
25%
Percent Over 65 Years Old
20%
20.9%
19.7%
15%
10% 11.7%
7.7%
5%
0%
United States New York City
Non-Hispanic White Latinos (All Races)
Note: While we use the term Latino, the data analyzed is from the U.S. Census, which uses the term Hispanic.
Sources: American Community Survey, 2019.
7COVID-19 Death and Vaccination Rates for Latinos in New York City
Latinos face other structural disadvantages that likely impact access to the vaccine.xii Latinos have a median
income in the city at $47,000, which is less than half the median income of NH Whites (Figure 3). Studies have
shown both a higher vulnerability to COVID-19 and lower vaccine coverage for low-income communities.xiii
Figure 3: Median Income by Race/Ethnicity in the United States and New York City, 2019
$120,000
$101,536
$100,000
Median Income
$80,000 $71,664
$60,000 $55,658
$47,157
$40,000
$20,000
$0
United States New York City
Non-Hispanic Whites Latinos (All Races)
Note: While we use the term Latino, the data analyzed is from the U.S. Census, which uses the term Hispanic.
Sources: American Community Survey, 2019.
Latinos in NYC have less access to education, and studies show that communities with lower educational
attainment have had lower vaccination coverage.xiv As seen in Figure 4, slightly less than 20 percent of Latinos
have a bachelor’s degree compared to almost 62 percent of NH Whites.
Figure 4: Percent of the Population with a Bachelor’s Degree by Race/Ethnicity in the United States and New York City, 2019.
70%
Percent With a Bachelor's Degree
60%
61.8%
50%
40%
36.9%
30%
20%
19.8%
17.6%
10%
0%
United States New York City
Non-Hispanic Whites Latinos (All Races)
Note: While we use the term Latino, the data analyzed is from the U.S. Census, which uses the term Hispanic.
Sources: American Community Survey, 2019.
8COVID-19 Death and Vaccination Rates for Latinos in New York City
Reports indicate that socioeconomic characteristics are affecting Latinos’ access to the vaccine. Language
barriers, confusion about the sign-up process, lack of internet access, exclusionary hours at clinics that do
not accommodate work schedules, and the desire to not miss pay for missed work all contribute to lower
vaccination rates among Latinos.xv Additionally, appointments at sites intended to reach communities of color
were taken up by NH White residents with better access to information, transportation, and flexibility to travel.xvi
The next section presents our findings on the extent to which these structural factors affect vaccination
outcomes in Latino communities.
FINDINGS
We conducted several analyses to better understand COVID-19 impacts on Latinos in New York City. First, we
compared Latino COVID-19 death, hospitalization, vaccination, and case rates with those of NH Whites. Then,
we mapped death rates and vaccination rates by neighborhood across New York City to assess place-based
exposure risk. Additionally, we did a spatial-racial analysis to determine disparities in death and vaccination
rates.
These results are based on data from March 11, 2021. Using U.S. Census definitions of race and ethnicities,
we use the terms “Hispanic” and “NH White” to refer to Latino and Non-Hispanic White neighborhoods. More
detailed information on data sources and methods can be found in the Appendix.
CITY-WIDE COVID-19 DEATH AND VACCINATION DISPARITIES
To understand disparities between Hispanics and NH Whites, we first analyzed COVID-19 metrics from the NYC
Department of Health, including cases, deaths, hospitalizations, and vaccination rates. Figure 5 displays the
Hispanic to NH White ratio for these metrics, with parity at 1.0. Across all metrics, there are disparities between
the two groups: COVID-19 cases are 1.4 times higher among Hispanics, and hospitalizations and deaths are
almost twice the rate for Hispanics as NH Whites. The lower ratio of cases compared to deaths/hospitalizations
could be due to the presence of testing barriers for Hispanics. Despite disproportionate COVID-19 impacts,
vaccination rates among Hispanics are less than three-fifths that of NH Whites. Hispanics have borne a larger
share of negative COVID-19 health outcomes but have received a smaller share of the protection afforded by
the vaccine.
9COVID-19 Death and Vaccination Rates for Latinos in New York City
Figure 5: COVID-19 Metrics: Hispanic to Non-Hispanic White Ratio in New York City
2
1.95
1.8 1.86
1.6
1.4
1.40
Parity with White = 1
1.2
1
0.8
0.6
0.59
0.4
0.2
0
Case Rate Hospitalizations Deaths Vaccination Rate
Source: NYC Department of Health
The U.S. Census Bureau’s Household Pulse Survey (see Appendix) provides additional evidence of
disproportionate impacts faced by Hispanics. Figures 6 and 7 show overall vaccination rates and reluctance
for Hispanics and NH Whites. We also compared responses between 1) older adults, who had priority access to
vaccines, and 2) people with high levels of education, who have greater access to information, are more likely
to trust medical experts and are more likely to have the digital technology skills and equipment to sign up.
Consistent with the NYC Public Health data, U.S. Census data indicate that the vaccination rate among
Hispanics was about half that of NH Whites as of March 2021. Vaccination rate differences between Hispanics
and NH Whites persisted among older adults and people with high levels of education, although the gap is
smaller in the U.S. Census Bureau’s dataset (see Figure 6).). This indicates a need to target outreach and
information efforts to reach these individuals.
10COVID-19 Death and Vaccination Rates for Latinos in New York City
Figure 6: Vaccination Rates by Age, Educational Level, and Race/Ethnicity New York City
60%
50%
Percent of Population
51%
40% 44%
30% 35%
30%
20% 25%
16%
10%
0%
18 Years + 65 Years + Bachelor's Degree
or Higher
NH White Latinos (All Races)
Source: U.S. Census Household Pulse Survey
While there are some differences in vaccine reluctance (two percentage points), this is likely not sufficient to
explain the disparity faced by Hispanics. About 15 percent of NH White respondents and 17 percent of Hispanic
respondents expressed that they would "probably not" or "definitely not" get vaccinated, suggesting that
differences in vaccination rates cannot be explained by vaccine reluctance alone. However, Hispanics were
slightly more likely to "definitely not” get a vaccine than NH Whites (7 percent vs. 5 percent).
GEOGRAPHY OF COVID-19 DEATHS AND VACCINATION
We mapped the death rates and vaccination rates by neighborhood across New York City to assess place-
based exposure risk. Our unit of analysis is the ZIP Code Tabulation Area (ZCTA), as defined by the U.S. Census
Bureau. We use the terms “ZCTA” and “neighborhood” interchangeably throughout. More detailed information
on data sources and methods can be found in the Appendix.
Note that our analysis assesses neighborhood risk, as opposed to individual risk – for example, a person living
in a neighborhood with a high rate of car accidents is more likely to be in an accident.
Figure 7 illustrates the COVID-19 death rate by neighborhood, with lighter brown indicating a lower death rate
and darker brown indicating a higher death rate. Overall, neighborhoods with higher death rates were located
in the Bronx and portions of Queens, Brooklyn, and Staten Island. Neighborhoods with lower death rates were
located in Manhattan south of Harlem (excluding Chinatown) and in some parts of Brooklyn and Queens closer
to Manhattan.
11COVID-19 Death and Vaccination Rates for Latinos in New York City
Figure 7: COVID-19 Death Rate by ZIP Code Tabulation Area in New York City
Figure 8 displays vaccination rates, with lighter green indicating lower vaccination rates and darker green
indicating higher rates. In contrast to the COVID-19 death rate, neighborhoods with high vaccination rates
are located in Manhattan, particularly in the Upper East and West Side and the outer parts of Queens. Low
vaccination rates are primarily located across the Bronx and Brooklyn and some sections of Queens.
12COVID-19 Death and Vaccination Rates for Latinos in New York City
Figure 8: COVID-19 Vaccination Rate by ZIP Code Tabulation Area in New York City
There is significant geographic inequality in the odds of dying from COVID-19 or receiving the vaccine. Visually,
the two rates appear to be inversely correlated; that is, many ZTCAs with high death rates are also ZTCAs with
low vaccination rates. People living in these areas therefore face multiple factors indicating greater COVID-19
risk.
We developed a “death-vaccination gap metric” (hereby referred to as "gap metric") to quantify these spatial
disparities between neighborhoods. Overall, we observe an inverse relationship between death rates and
vaccination rates: ZCTAs with low death rates have on average higher vaccination rates (a smaller gap) and
ZCTAs with high death rates have on the average lower vaccination rates (a bigger gap). More information
about how we developed this metric can be found in the Appendix.
The following map is based on classifying the gap metric values into three categories: the smallest gap (green)
is the bottom quartile, the medium gap (tan) is the middle two quartiles, and the biggest gap (red) is the top
quartile.
13COVID-19 Death and Vaccination Rates for Latinos in New York City
Figure 9: Death-Vaccination Gap by ZIP Code Tabulation Area in New York City
Overall, we find that neighborhoods with lower COVID-19 death rates tend to have higher vaccination rates.
Neighborhoods with the smallest gaps are located in Manhattan south of Harlem (excluding Chinatown). In
contrast, areas with the highest death gaps are located in the Bronx and portions of Brooklyn and Queens.
Many places with the greatest gap between deaths and vaccinations are also communities of color, meaning
that racial/ethnic minorities in NYC often face the greatest risks of COVID-19.
SPATIAL-RACIAL DISPARITIES
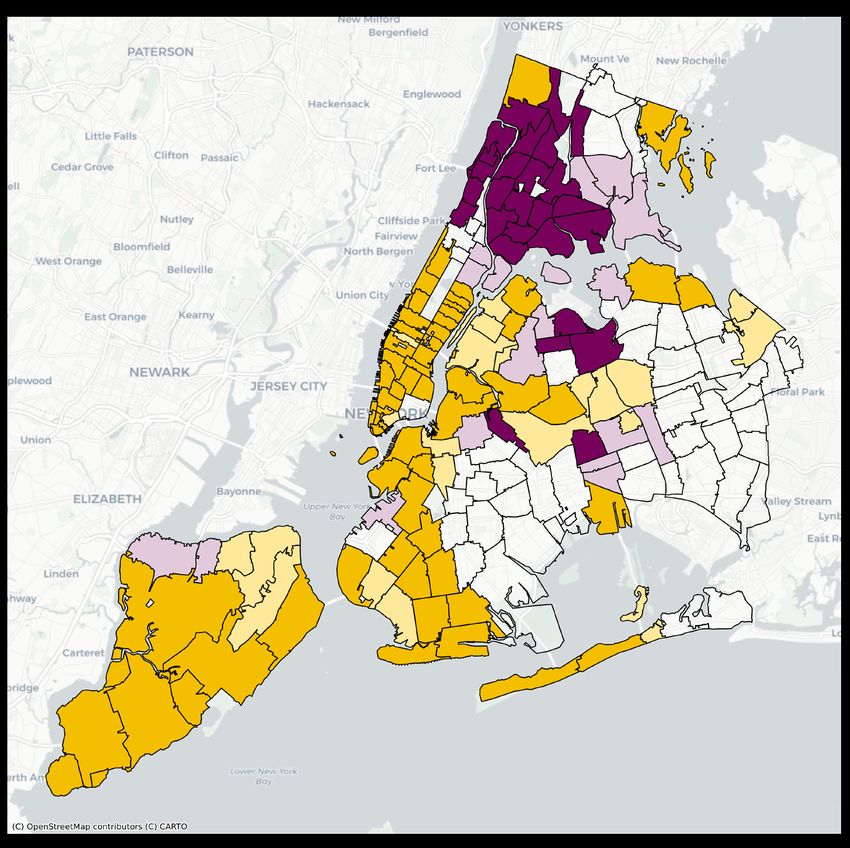
Figure 10 showcases neighborhoods by majority or plurality Hispanic or NH White. Overall, we find
that neighborhoods with a majority NH White population are located in Manhattan below Harlem and
neighborhoods with a majority Hispanic population are located in the Bronx. Visual inspection of Figures 8 and
9 reveals that neighborhoods with a high share of Hispanic population tend to have the “biggest gap” between
deaths and vaccines. In contrast, neighborhoods with a high share of NH White population tend to be located
within the “smallest gap” category.
14COVID-19 Death and Vaccination Rates for Latinos in New York City
Figure 10: Racial Majority/Plurality by ZIP Code Tabulation Area in New York City
Majority NH-White
Plurality NH-White
Majority Latino
Plurality Latino
To quantify the observed geographic racial disparities in deaths, vaccinations, and the gap metric, we used
population-weighted quintiles to rank the ZCTAs. We compare Hispanic and NH White populations to the total
city population. Population-weighted quintiles mean the top quintile will contain 20 percent of the population,
not 20 percent of the ZCTAs (which vary in population size). Therefore, the quintiles for the entire city
population fall roughly equally in the quintiles, while we see variation in the distribution of the Hispanic and NH
White populations.
Figure 11 shows the population distribution by death rate. As expected, we find the total population distributed
evenly across ZCTAs within the five quintiles. However, we find the nearly 40 percent of the NH White
population resides in ZCTAs within the lowest death rate quintile, as compared to only 10 percent of the Latino
population.
15COVID-19 Death and Vaccination Rates for Latinos in New York City
Figure 11: Population Distribution by Death Rate in New York City
100%
15%
Distribution of Population Across Neighborhoods
90% 21% 23%
80% 11%
70% 20%
15%
28% Highest Death Rates
60%
2nd Highest Death Rates
50% 20% 21%
3rd Highest Death Rates
40% 19% 2nd Lowest Death Rates
30% 20% Lowest Death Rates
20% 38% 21%
10% 20%
10%
0%
Total Population NH White Latinos
Figure 12 displays the population distribution by vaccination rate. Again, we find an even distribution for the
total population but significant disparities between NH Whites and Latinos. Over 40 percent of NH Whites live
in ZCTAs in the highest quintile of vaccination rates compared to just over 10 percent of Latinos. This result
aligns with the Household Pulse Survey, which showed higher vaccination rates for NH White populations.
Figure 12: Population Distribution by Vaccination Rate in New York City
100%
13%
90% 24%
Distribution of Population Across Neighborhoods
80% 42% 16%
70% 16%
60% 21% Highest Vaccination Rates
2nd Highest Vaccination Rates
50% 22% 17%
3rd Highest Vaccination Rates
40% 2nd Lowest Vaccination Rates
23%
Lowest Vaccination Rates
30% 19%
21%
20%
15% 26%
10% 19%
6%
0%
Total Population NH White Latinos
Finally, Figure 13 illustrates the population distribution by the death-vaccination gap. Consistent with the
results for death rate and vaccination rate distribution, we find equal distribution for the total population, while
40 percent of NH Whites reside in the ZCTAs in the lowest quintile of the death-vaccination gap and only 10
percent of Latinos in the lowest quartile.
The charts reveal that, relative to NH Whites, Latinos are more likely to be overrepresented in the riskiest
places for COVID-19 exposure, including areas with high death rates, low vaccination, and a bigger gap
between death and vaccination rates.
16COVID-19 Death and Vaccination Rates for Latinos in New York City
Figure 13: Population Distribution by Death-Vaccine Gap in New York City
100%
9%
90% 21%
Distribution of Population Across Neighborhoods
9% 27%
80%
17%
70% 19%
Highest Gap
60% 25%
2nd Highest Gap
26%
50% 20%
3rd Highest Gap
40% 2nd Lowest Gap
21%
30% 20% Lowest Gap
20% 39% 18%
10% 20%
9%
0%
Total Population NH White Latinos
To further disaggregate disparities among different subpopulations within NH White and Latino populations,
we examined average neighborhood risk across death rates, vaccination rates, and the gap metric. In Figure
14, the death rate is deaths per 100,000 people, the vaccination rate is a percentage of the population, and the
death-vaccination gap is the normalized rate (with a higher value indicating a larger gap).
Overall, Latinos reside in neighborhoods with a higher risk of COVID-19 impacts than NH Whites. The death
rate and the gap metric is much higher for Latinos, while the vaccination rate is lower than for NH Whites.
These disparities hold true for elderly and educated populations with potential advantages to vaccine access.
Even among these more advantaged groups, Latinos still have higher place-based exposure risk to COVID-19.
We are also interested in disparities within Latinos ethnic groups. By comparing COVID-19 metrics between
Dominican, Mexican, and Puerto Rican neighborhoods, we find only minor variations between the ethnic
groups. Puerto Rican neighborhoods see slightly higher vaccination rates and slightly lower death rates,
though the difference is negligible. Regardless of age, education, or ethnicity, Latinos are more likely to live in
neighborhoods with a higher risk of COVID-19 exposure and have lower access to vaccination as compared to
NH Whites.
17COVID-19 Death and Vaccination Rates for Latinos in New York City
Figure 14: Average Neighborhood COVID-19 Risk Indicators in New York City
DEATH-VACCINE
DEATH RATE VACCINATION RATE
GAP
All 294 20.5 99
Race
NH White 250 23.6 71
Hispanic 316 18.7 114
Hisp-NHW Ratio 1.26 0.79 1.60
65 Years or Older
NH White 279 24.5 74
Hispanic 317 19.6 109
Hisp-NHW Ratio 1.14 0.80 1.47
Bachelor's Degree or Higher
NH White 228 24.9 60
Hispanic 284 21.1 93
Hisp-NHW Ratio 1.25 0.85 1.54
Hispanic Ethnicity
Dominican 317 17.9 120
Mexican 314 18.3 115
Puerto Rican 312 18.9 113
Largest Ratio 1.01 0.95 1.06
18COVID-19 Death and Vaccination Rates for Latinos in New York City
CONCLUSION AND RECOMMENDATIONS
The disparities documented in this brief are not surprising: both the media and the populace are aware of
COVID-19’s disproportionate impacts on certain groups. This brief’s contribution is quantifying the pattern and
magnitude of the problem in New York City. Racial stratification is not unique to the impacts of the pandemic.
xvii
Existing disadvantages faced by racial and ethnic groups have made Latinos more vulnerable to COVID-19
infection, hospitalization, and death. Such disadvantages include residing in riskier built environments
(e.g. overcrowded housing), relying more heavily on public transit, and working in essential sectors.xviii This
inequality is also visible in the differences in vaccination rates, which further compounds the divide between
NH Whites and Latinos as recovery from the pandemic begins.
These unequal outcomes occurred despite political promises of racial justice and fairness. These disparities
would likely have been worse without such efforts. Nevertheless, persistent inequalities reveal that public
actions to date have been insufficient. The results reveal the overwhelming power of institutions, economic
markets, and structures of privilege to build new forms of racial stratification on the foundation of old forms of
racial inequality.
The governor and mayor must aggressively implement their expressed commitments to racial equity through
evidence-based policies and programs, greater community engagement and participation, and explicit
performance-based accountability. Clearly, there is an urgent necessity to address the immediate crisis and
particularly to close the vaccination gap. It is not too late to formulate a socially fair recovery plan that focuses
help on those disproportionately harmed by the pandemic. This restorative approach should be a starting
point for a renewed and broader fight against systemic inequality. “Race-blind” strategies fail to recognize the
existence of systemic racism and would ultimately perpetuate societal inequalities or even widen the racial
divide.
19COVID-19 Death and Vaccination Rates for Latinos in New York City
APPENDIX: DATA AND GAP INDEX CONSTRUCTION
Table A1 lists the multiple public data sources used for this analysis. The neighborhood-level analysis is
conducted at the ZIP Code Tabulation Area (ZCTA) level, as defined by the U.S. Census Bureau. The terms
“neighborhood” and “ZCTA” are used interchangeably throughout.
Table A1: Data Sources
DATA SOURCE ACCESS DATE VARIABLES GEOGRAPHY
NYC Health COVID-19 Cases and Deaths per
March 11, 2021 ZCTA
Coronavirus Data 100,000 residents
NYC Health Percent of population that has
Vaccination March 11, 2021 received at least one COVID-19 ZCTA
Dashboard vaccine
American Hispanic and Non-Hispanic Race;
Community Survey March 11, 2021 Hispanic Ethnicities; Over 65; ZCTA
(2015-2019) Bachelor’s Degree or Higher
New York State
Vaccination Rates by Age and proportion of
Household Pulse Education;
March 15, 2021 the NY-NJ-PA
Survey Reluctance to Vaccination by
Metropolitan
Race
Area
The New York City Department of Health and Mental Hygiene is one of the largest public health agencies in
the world, with over 6,000 employees serving 8 million New Yorkers.xix The department makes COVID-19 data
available through its data and mapping portal, with detailed and downloadable information housed at Github.
Confirmed case, death, and vaccination data are available for ZCTAs. Although the data are updated daily, the
statistics can lag behind as long as a week because of delays in reporting.
We use COVID-19 death rates, as opposed to case rates, to measure the impact of the pandemic on a
neighborhood. Case rates are a more problematic measure due to limited access to testing early in the
pandemic and significant racial disparities in testing rates. A study of testing rates in New York during March
and April 2020 found higher testing rates in ZCTAs with a larger NH-White population.xx COVID-19 death rates
are a better indicator because the information comes from death certificates; nonetheless, it is also subject to
some racial misclassification.xxi
The ZCTA-level data on race, age, and education come from the 2015‒2019 five-year average American
Community Survey (ACS) estimates. The ACS is a continuous survey conducted by the U.S. Census Bureau to
collect housing, demographic, social, and economic information. On an annual basis, the sample represents
about 2.0‒2.5 percent of households and individuals; as such, reported statistics are subject to sampling
variation. For small geographies (less than 65,000 persons), statistics are reported as a five-year average.
ZCTAs fall into this five-year reporting category.
20COVID-19 Death and Vaccination Rates for Latinos in New York City
The Household Pulse Survey is conducted by the U.S. Census Bureau in collaboration with multiple federal
agencies to collect data on the social and economic effects of COVID-19 pandemic on American households.
The online survey is conducted in English and Spanish and includes questions on vaccination and intention to
vaccinate, along with socioeconomic and demographic data. For our analysis, we use the sample from January
6 to March 15, 2021, which surveyed 5,859 Non-Hispanic White and Hispanic respondents residing in the New
York State portion of the NY-NJ-PA metropolitan area.
Our gap metric identifies spatial disparities between neighborhoods hit hardest with high COVID-19 death rates
and least protected by vaccination, and neighborhoods with low COVID-19 death rates but high vaccination
protection. Overall, we observe an inverse relationship between the outcomes: ZCTAs with low death rates
have on average higher vaccination rates and ZCTAs with high death rates have on the average lower
vaccination rates. This negative correlation can be seen in Figure A1.
Figure A1: COVID-19 Vaccination and Death Rates in NYC
COVID Death and Vaccination Rates
45
40
35
Vaccination Rate
30
25
20
15
10
0 100 200 300 400 500 600 700
COVID Death Rate
To quantify the gap, we created an index measuring the difference between the death rate and the vaccination
rate in a neighborhood. This is done in two steps: the first part normalizes each input (due to different scales
with different distributions) by converting the two values into a population-weighted normalized z-score, then
taking the difference:
Death-Vaccination Gap for ith ZCTA =
(Z-score of Death Rate for ith ZCTA) - (Z-score of Vaccination Rate for ith ZCTA)
For ZCTAs from 1 … n.
We then rank the gap metric by classifying each ZCTA into one of three categories: top quartile, middle half,
and bottom quartile. For the maps, categories are population weighted such that the top quartile consists of
25 percent of the total population, not 25 percent of the ZCTAs. For the distribution analysis reported in the
bar charts, we use population-weighted quintiles, which enable us to estimate the number of people exposed
to risky environments with high gap metrics. For the table, we report the average ranking, where higher values
means higher risk.
21COVID-19 Death and Vaccination Rates for Latinos in New York City
ENDNOTES
i
While the data analyzed in this brief uses the U.S. Census Bureau definition and term “Hispanic,” we use Latino and Hispanic
interchangeably in this brief.
Corrine N. Thompson, Jennifer Baumgartner, Carolina Pichardo, et al. (November 2020). “COVID-19 Outbreak — New York
ii
City, February 29–June 1, 2020,” MMWR Morb Mortal Wkly Rep 2020; 69:1725–1729, available online.
“Tracking Coronavirus in New York: Latest Map and Case Count” (Updated April 20, 2021), New York Times, available
iii
online.
Laura E. Martínez, Arturo Vargas-Bustamante, Yohualli Balderas-Medina Anaya, Rodrigo Domínguez-Villegas, Seira Santizo-
iv
Greenwood, Sonja F.M. Diaz, David E. Hayes Bautista (July 2020). COVID-19 in Vulnerable Communities: An Examination by
Race/Ethnicity in Los Angeles and New York City, UCLA Latino Policy & Politics Initiative, available online.
See also: “COVID-19 Cases in New York City, a Neighborhood-Level Analysis” (April 2020), NYU Furman Center, available
online.
v
Jin Jin, Neha Agarwala, Prosenjit Kundu, Benjamin Harvey, Yuqi Zhang, Eliza Wallace, and Nilanjan Chatterjee (December
2020). "Individual and community-level risk for COVID-19 mortality in the United States." Nature medicine 27, no. 2 (2021):
264-269, available online.
See also: Byoungjun Kim, Andrew G. Rundle, Alicia T. Singham Goodwin, Christopher N. Morrison, Charles C. Branas, Wafaa
El-Sadr, and Dustin T. Duncan (February 2021). "COVID-19 testing, case, and death rates and spatial socio-demographics in
New York City: An ecological analysis as of June 2020." Health & place 68: 102539, available online.
Luis Ferré-Sadurní and Joseph Goldstein (December 2020), “1st Vaccination in U.S. Is Given in New York, Hard Hit in
vi
Outbreak’s First Days,” NY Times, available online.
vii
New York State Distribution of the Vaccine (2021), “Pharmacy Partnership for Long-Term Care Program,” available online.
Katie Honan (February 2021), “New York City Covid-19 Vaccination Rates Vary by ZIP Codes,” The Wall Street Journal,
viii
available online.
New York State (2021), “Governor Cuomo Announces New Yorkers 30 Years of Age and Older Will Be Eligible to Receive
ix
COVID-19 Vaccine”, March 29, 2021, available online.
x
NY Times Editorial Board, “How New York’s Vaccine Program Missed Black and Hispanic Residents”, New York Times, Feb. 1,
2021, available online.
xi
Kevin Credit (2020). "Neighbourhood inequity: Exploring the factors underlying racial and ethnic disparities in COVID‐19
testing and infection rates using ZIP code data in Chicago and New York." Regional Science Policy & Practice 12, no. 6
(2020): 1249-1271, available online.
Ibid.
xii
See also: Shigehiro Oishi, Youngjae Cha, and Ulrich Schimmack (January 2021). "The Social Ecology of COVID-19 Cases and
Deaths in New York City: The Role of Walkability, Wealth, and Race." Social Psychological and Personality Science, available
online.
Nicole Wetsman (February 2021), “Maps show ZIP codes hit hardest by COVID-19 have low vaccination rates,” The Verge,
available online.
Michelle M. Hughes, Alice Wang, Marissa K. Grossman, et al. (March 2021). “County-Level COVID-19 Vaccination Coverage
xiii
and Social Vulnerability — United States, December 14, 2020–March 1, 2021,” MMWR Morb Mortal Wkly Rep 2021;70:431–
436, available online.
22COVID-19 Death and Vaccination Rates for Latinos in New York City
xiv
K. Viswanath, Mesfin Bekalu, Dhriti Dhawan, Ramya Pinnamaneni, Jenna Lang, and Rachel McLoud (April 2021). “Individual
and social determinants of COVID-19 vaccine uptake,” BMC Public Health, 21 (818), available online.
xv
NY Times Editorial Board, “How New York’s Vaccine Program Missed Black and Hispanic Residents”, New York Times, Feb.
1, 2021, available online.
Nicquel Terry Ellis (January 2021), “A vaccination site meant to serve a hard-hit Latino neighborhood in New York instead
xvi
serviced more NH-Whites from other areas”, CNN, available online.
xvii
Paul M. Ong and Silvia R. Gonzalez (2019). Uneven Urbanscape: Spatial Structures and Ethnoracial Inequality. Cambridge
University Press, available online.
xviii
Shima Hamidi, Sadegh Sabouri, and Reid Ewing (June 2020), “Does Density Aggravate the COVID-19 Pandemic? Early
Findings and Lessons for Planners,” Journal of the American Planning Association, Vol. 86, Iss. 4, p. 495-509, available online.
See also: Lorenz von Seidlein, Graham Alabaster, Jacqueline Deen, and Jakob Knudsen (November 2020). “Crowding has
consequences: Prevention and management of COVID-19 in informal urban settlements,” Build Environ.188: 107472, available
online.
National Multifamily Housing Council (December 2020), “How Much is Overcrowding a Factor in COVID-19 Risk,” available
online.
Benjamin Rader, Samuel V. Scarpino, Anjalika Nande, et al. (October 2020). “Crowding and the shape of COVID-19
epidemics,” Nature Medicine Vol. 26, p. 1829–1834, available online.
Brittny Mejia (January 2021). “How overcrowded housing led to COVID death in a L.A. family,” LA Times, available online.
Irvin Dawid (January 2021), “Los Angeles Mayor Blames COVID Outbreak on Density,” Planetizen, available online.
“Urban Density Not Linked to Higher Coronavirus Infection Rates — and Is Linked to Lower COVID-19 Death Rates” (June
2020), Johns Hopkins Bloomberg School of Public Health, available online.
xix
New York City Department of Health and Mental Hygiene (2021), “About the NYC Department of Health and Mental
Hygiene, available online.
xx
Kelly Servick (July 2020). “‘Huge hole’ in COVID-19 testing data makes it harder to study racial disparities,” Science
Magazine, available online.
xxi
Elizabeth Arias, Melonie Heron M, Jahn Hakes (August 2016). “The validity of race and Hispanic-origin reporting on death
certificates in the United States: An update.” National Center for Health Statistics. Vital Health Stat 2(172), available online.
23You can also read