Ohio - 2018 County Health Rankings Report - County Health Rankings & Roadmaps
←
→
Page content transcription
If your browser does not render page correctly, please read the page content below

Ohio

2018 County Health Rankings Report
County Health Rankings 2018
Introduction
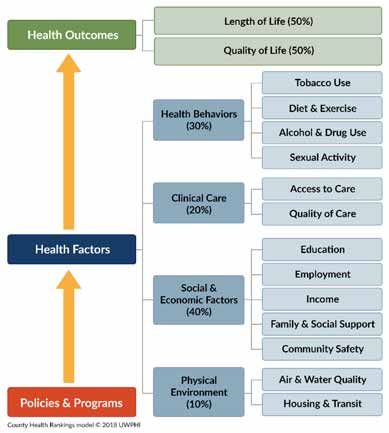
Ranking the health of nearly every county in the nation
(based on the model to the right), County Health Rankings
& Roadmaps (CHR&R) illustrates what we know when it
comes to what is keeping people healthy or making
them sick and shows what we can do to create
healthier places to live, learn, work and play. CHR&R
brings actionable data, evidence, guidance and stories to
communities to make it easier for people to be healthy in
their neighborhoods, schools and workplaces.
Our country has achieved significant health
improvements over the past century. We have
benefited from progress in automobile safety, better
workplace standards, good schools and medical
clinics, and reductions in smoking and infectious
diseases. But when you look closer, there are
significant differences in health outcomes according to
where we live, how much money we make or how we
are treated. The data show that not everyone has
benefited in the same way from these health
improvements. There are fewer opportunities and
resources for better health among groups that have
been historically marginalized including people of
color, people living in poverty, people with physical or
mental disabilities, LGBTQ persons, and women.
This report explores the size and nature of health differences by place and race/ethnicity in Ohio and how state
and community leaders can take action to create environments where all residents have the opportunity to live
their healthiest lives. Specifically, this report will help illuminate:
1. What health equity is and why it matters
2. Differences in health outcomes within the state by place and racial/ethnic groups
3. Differences in health factors within the state by place and racial/ethnic groups
4. What communities can do to create opportunity and health for all
The Robert Wood Johnson Foundation (RWJF) collaborates with the University of Wisconsin Population Health Institute (UWPHI)
to bring this program to cities, counties, and states across the nation.
Page 2 | countyhealthrankings.org
County Health Rankings 2018

What Is Health Equity?
We live in a nation that prides itself on being a land of
opportunity ‐ a place where everyone has a fair chance to lead
the healthiest life possible regardless of where we live, how
we are treated, or the circumstances we were born into; this
is the prospect of health equity. However, this is not always
our reality. More often the choices we make depend on the
opportunities we have, such as a quality education, access to
healthy foods and living in safe, affordable housing in crime‐
free neighborhoods. These opportunities are not the same for
everyone.

Health disparities emerge when some groups of people have
more access to opportunities and resources over their
                                                                         Why Does It Matter?
lifetime and across generations. For example, when children              Population projections indicate that our nation’s
live in families with higher incomes, they typically experience          youth are increasingly more racially and ethnically
stable housing in safer neighborhoods, have access to better‐            diverse. A healthy beginning is essential to a healthy
resourced and higher quality schools, and are better prepared            future for our children and our nation.
for living wage jobs leading to upward economic mobility and
good health. When children live in families with lower                   Yet, child poverty rates remain high with nearly one
incomes and do not have access to these same opportunities,              in five living in poverty. And, in the majority of U.S.
they face challenges to gaining a foothold on the ladder to              counties, rates for Black or Hispanic children are
economic security that helps them thrive.                                even higher than rates for White children.

Differences in opportunity do not come about on their own              Investing in the health and well‐being of ALL young
or because of the actions of individuals alone. Often, they            people now and in years to come is vital to our
are the result of policies and practices at many levels that           nation’s future success and prosperity.
have created deep‐rooted barriers to good health, such as
unfair bank lending practices, school funding based on local
property taxes, and policing and prison sentencing. The collective effect is that a fair and just opportunity to live
a long and healthy life is not a reality for everyone. Now is the time to change how things are done.

Achieving health equity means reducing and ultimately eliminating unjust and avoidable differences in health and in
the conditions and resources needed for optimal health by improving the health of marginalized groups, not by
worsening the health of others. Our progress toward health equity will be measured by how health disparities change
over time. This report provides data on differences in health and opportunities in Ohio that can help identify where
action is needed to achieve greater equity and offers information on how to move from data to action.

                                                Page 3 | countyhealthrankings.org
County Health Rankings 2018

Differences in Health Outcomes within States by Place and Racial/Ethnic Groups
How Do Counties Rank for Health Outcomes?
Health outcomes in the County Health Rankings represent measures of how long people live and how healthy people
feel. Length of life is measured by premature death (years of potential life lost before age 75) and quality of life is
measured by self‐reported health status (% of people reporting poor or fair health and the number of physically and
mentally unhealthy days within the last 30 days) and the % of low birth weight newborns. Detailed information on the
underlying measures is available at countyhealthrankings.org

The green map above shows the distribution of Ohio’s health outcomes, based on an equal weighting of length and
quality of life. The map is divided into four quartiles with less color intensity indicating better performance in the
respective summary rankings. Specific county ranks can be found in the table on page 12 at the end of this report.

How Do Health Outcomes Vary by Race/Ethnicity?
Length and quality of life vary not only based on where we live, but also by our racial/ethnic background. In Ohio there
are differences by race/ethnicity in length and quality of life that are masked when we only look at differences by place.
The table below presents the five underlying measures that make up the Health Outcomes Rank. Explore the table to see
how health differs between the healthiest and the least healthy counties in Ohio, and among racial/ethnic groups.

Differences in Health Outcome Measures among Counties and for Racial/Ethnic Groups in Ohio
                                                 Healthiest          Least Healthy
                                                                                         AI/AN     Asian/PI   Black    Hispanic   White
                                                 OH County            OH County

 Premature Death (years lost/100,000)               3,800                10,600           3,300     2,900     11,500    4,800     7,700
 Poor or Fair Health (%)                             10%                  23%               29%      4%        22%       24%      16%
 Poor Physical Health Days (avg)                      3.0                  4.7              5.4      0.5       4.6       6.0       3.8
 Poor Mental Health Days (avg)                        3.3                  4.6              6.8      1.1       4.5       5.2       4.2
 Low Birthweight (%)                                  6%                  10%               9%       8%        14%       8%        7%
American Indian/Alaskan Native (AI/AN), Asian/Pacific Islander (Asian/PI)
N/A = Not available. Data for all racial/ethnic groups may not be available due to small numbers

                                                            Page 4 | countyhealthrankings.org
County Health Rankings 2018

Health Outcomes in Ohio
Differences by:       Place               Race/Ethnicity
                               OH                OH                The graphic to the left compares measures of length and quality
                                                                   of life by place (Health Outcomes ranks) and by race/ethnicity.
                                                                   To learn more about this composite measure, see the technical
                                                                   notes on page 13.

                                                                    In Ohio, measures of length and quality of life indicate:

                                                                         • American Indians/Alaskan Natives are most similar in
                                                                           health to those living in the least healthy quartile of
                                                                           counties.
                                                                         • Asians/Pacific Islanders are healthier than those living in
                                                                           the top ranked county.
                                                                         • Blacks are less healthy than those living in the bottom
                                                                           ranked county.
                                                                         • Hispanics are most similar in health to those living in the
                                                                           middle 50% of counties.
                                                                         • Whites are most similar in health to those living in the
                                                                           middle 50% of counties.

                                                                   (Quartiles refer to the map on page 4.)

AI/AN ‐American Indian/Alaskan Native/Native American
Asian/PI ‐ Asian/Pacific Islander

Across the US, values for measures of length and quality of life for Native American, Black and Hispanic residents are
regularly worse than for Whites and Asians. For example, even in the healthiest counties in the US, Black and American
Indian premature death rates are about 1.5 times higher than White rates. Not only are these differences unjust and
avoidable, they will also negatively impact our changing nation’s future prosperity.

                                                                 Changing the Course in Kansas City
                                                                 A decade ago, public health officials identified an 8‐year gap in
                                                                 life expectancy between the city's White and Black populations.
                                                                 Segregation and discrimination over the past century fueled this
                                                                 disparity, but community residents and city leaders joined forces
                                                                 to tackle tough conversations on race, stem the violence,
                                                                 increase educational opportunities, improve access to care and
                                                                 ensure economic justice. Today the disparity in life expectancy
                                                                 has been reduced to 6.9 years. Learn more at rwjf.org/prize.

                                                        Page 5 | countyhealthrankings.org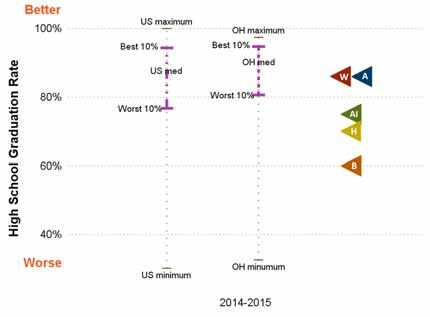
County Health Rankings 2018

Differences in Health Factors within States by Place and Racial/Ethnic Groups
How Do Counties Rank for Health Factors?
Health factors in the County Health Rankings represent the focus areas that drive how long and how well we live,
including health behaviors (tobacco use, diet & exercise, alcohol & drug use, sexual activity), clinical care (access to care,
quality of care), social and economic factors (education, employment, income, family & social support, community
safety), and the physical environment (air & water quality, housing & transit).

The blue map above shows the distribution of Ohio’s health factors based on weighted scores for health behaviors,
clinical care, social and economic factors, and the physical environment. Detailed information on the underlying
measures is available at countyhealthrankings.org. The map is divided into four quartiles with less color intensity
indicating better performance in the respective summary rankings. Specific county ranks can be found in the table on
page 12.

What are the Factors That Drive Health and Health Equity?
Health is influenced by a range of factors. However, social and economic factors, like connected and supportive
communities, good schools, stable jobs, and safe neighborhoods, are foundational to achieving long and healthy lives.
These social and economic factors also influence other important drivers of health and health equity. Social and
economic factors impact our ability to make healthy choices, afford medical care or housing, and even manage stress
leading to serious health problems. The choices we make are based on the choices we have.

Across the nation, there are meaningful differences in social and economic factors among counties and among
racial/ethnic groups. Even within counties, policies and practices marginalize many racial and ethnic groups, keeping
them from resources and supports necessary to thrive. Limited access to opportunities is what creates disparities in
health, impacting how well and how long we live.

                                                 Page 6 | countyhealthrankings.org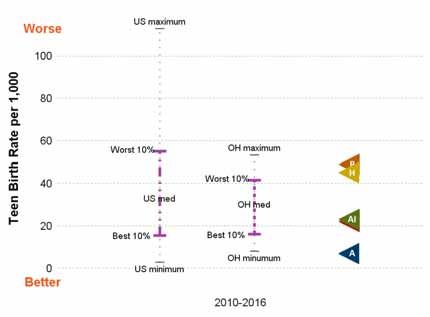
County Health Rankings 2018

How Do Social and Economic Opportunities for Health Vary in Ohio?
Social and economic factors vary depending on where we live and by our racial/ethnic background. The following four
data graphics illustrate differences among counties and by racial/ethnic groups in social and economic opportunities for
health in Ohio. These graphics show that it is important to explore differences by place and race/ethnicity in order to tell
a more holistic story about the health of your community.

                                                      Consider these questions as you look at the data graphics
This report explores state‐wide data. To dive
                                                      throughout this report:
deeper into your county data, visit Use the
Data at www.countyhealthrankings.org                   • What differences do you see among counties in your state?
                                                       • What differences do you see by racial/ethnic groups in your state?
                                                       • How do counties in your state compare to all U.S. counties?
                                                       • What patterns do you see? For example, do some racial/ethnic
                                                          groups fare better or worse across measures?

                                                                Differences by:                 Place                  Race/Ethnicity
CHILDREN IN POVERTY
                                                                                       US                OH                 OH

Poverty limits opportunities for quality housing,
safe neighborhoods, healthy food, living wage jobs,
and quality education. As poverty and related
stress increase, health worsens.

The graphic to the right shows:
• In Ohio, 20% of children are living in poverty
  compared to the U.S. rate of 20%.
• Children in poverty rates among Ohio counties
  range from 5% to 32%.
• Children in poverty rates among racial/ethnic
  groups in Ohio range from 10% to 46%.

                      US and state values and the state minimum and maximum can be found in the table on page 14
                    American Indian/Alaskan Native/Native American (AI/AN)         Asian/Pacific Islander (Asian/PI)

                                                   Page 7 | countyhealthrankings.org
County Health Rankings 2018

HIGH SCHOOL GRADUATION
                                                                Differences by:                         Place                       Race/Ethnicity
                                                                                           US                      OH                       OH
Higher rates of educational achievement are
linked to better jobs and higher incomes resulting
in better health. Education is also connected to
lifespan: on average, college graduates live nine
years longer than those who didn’t complete high
school.

The graphic to the right shows:
• Ohio’s high school graduation rate is 81%
  compared to the U.S. rate of 83%.
• High school graduation rates among Ohio
  counties range from 33% to 98%.
• High school graduation rates among
  racial/ethnic groups in Ohio range from 60%
  to 86%.

HEALTH INSURANCE
                                                                Differences by:                         Place                       Race/Ethnicity
                                                                                           US                      OH                       OH
Health insurance helps individuals and families
access needed primary care, specialists, and
emergency care. Those without insurance are
often diagnosed at later, less treatable disease
stages and at higher costs than those with
insurance.

The graphic to the right shows:
• The uninsured rate in Ohio is 8% compared to
  the U.S. rate of 11%.
• Uninsured rates among Ohio counties range
  from 4% to 22%.
• Uninsured rates among racial/ethnic groups in
  Ohio range from 7% to 17%.

                                                                        Data for Asians and Native Americans are not available for this measure

                                                   Page 8 | countyhealthrankings.org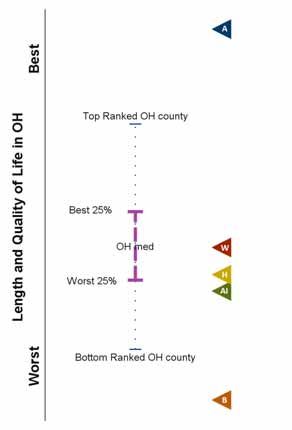
County Health Rankings 2018

TEEN BIRTHS
                                                                Differences by:                  Place                Race/Ethnicity
                                                                                        US               OH                OH
Teenage motherhood is more likely to occur in
communities with fewer opportunities for
education or jobs. Teen mothers are less likely to
complete high school and face challenges to
upward economic mobility. In turn, their children
often have fewer social and economic supports
and worse health outcomes.

The graphic to the right shows:
• The teen birth rate in Ohio is 28 births per
  1,000 female population, ages 15‐19,
  compared to the U.S. rate of 27 per 1,000.
• Teen birth rates among Ohio counties range
  from 8 to 53 per 1,000.
• Teen births for racial/ethnic groups in Ohio
  range from 7 to 49 per 1,000.

                     US and state values and the state minimum and maximum can be found in the table on page 14
                   American Indian/Alaskan Native/Native American (AI/AN)         Asian/Pacific Islander (Asian/PI)

                                                                                  Spartanburg County Closing the Gap
                                                                                  Community leaders in Spartanburg County, SC
                                                                                  took a good hard look at their data in 2008 and
                                                                                  discovered they had the worst teen birth rate in
                                                                                  the whole state. Deciding to face this issue head
                                                                                  on, they brought together teens, providers,
                                                                                  parents, and partners to create solutions ‐ a warm
                                                                                  welcoming teen center, accessible and respectful
                                                                                  reproductive health care, and open discussions
                                                                                  about sexuality. Recent data show improvements
                                                                                  ‐ rates have receded by 50% from 2010 to 2016
                                                                                  for all 15‐19 year olds. And while disparities in
                                                                                  teen births among racial/ethnic groups in SC
                                                                                  continue, the gap has closed for teen births
                                                                                  among Black and White females in Spartanburg
                                                                                  County (in 2016, 23.3 per 1,000 and 23.9 per
                                                                                  1,000, respectively). Learn more at rwjf.org/prize.

                                                   Page 9 | countyhealthrankings.org
County Health Rankings 2018
What Communities Can Do to Create Opportunity and Health for All
This report shows some of the differences in opportunity for people in Ohio based on where they live and their race or
ethnicity. But how can you turn this information into action? Below are some evidence‐informed approaches to consider
as your community moves forward:
Invest in education from early childhood through Ensure that everyone has adequate, affordable health
adulthood to boost employment and career prospects care coverage and receives culturally competent
Strengthen parents’ skills, including ways to foster services and care
children’s learning and development in home and Make health care services accessible and available in
community settings community, school, and clinical settings, including
Undertake policy initiatives to improve pre‐K‐12 medical, dental, vision, mental health care, and long‐
education in the classroom, school, district or state term care
level, focusing on raising school attendance and high Increase access to sex education and contraceptives
school graduation rates in school, clinic, and community settings
Implement community and school‐based supports Increase patients' health‐related knowledge via
that will improve access to and quality of early efforts to simplify health education materials,
childhood care and education, beginning in infancy improve patient‐provider communication, and
Offer alternative learning models and technology to increase literacy
help students develop social and work‐ready skills Provide culturally‐sensitive care coordination and
Support higher education opportunity for all through system navigation, including language interpretation
college application assistance and financial aid and care tailored to patients’ norms, beliefs, and
values
Increase or supplement income and support asset
development in low income households Foster social connections within communities and
Increase public and private sector wages and offer cultivate empowered and civically engaged youth
benefits for low‐income earners through living wages Establish positive relationships among youth and
and paid leave adult mentors and provide youth with leadership
Expand elibigility for earned‐income tax credits and opportunities in schools, community groups, and local
increase credit amount governments
Assist parents by expanding refundable child care tax Create safe places to convene, such as community
credits and increasing child care subsidies centers, with activities, programs, and supportive
technologies for all ages and abilities
Support information sharing, collaboration and
networking to inform decision‐making using social
media and in‐person approaches
To learn more about specific strategies that can support your work, visit What Works for Health, a living resource of
evidence‐informed policies and programs to make a difference locally. You can search for policies and programs that
have been tested or implemented in communities like yours, or adapt strategies that have been tested elsewhere but
seem like a good ‘fit’. You can also learn about each strategy’s likely impact on disparities.
Visit countyhealthrankings.org/whatworks
Page 10 | countyhealthrankings.orgCounty Health Rankings 2018
Communities Driving Local Change
We can work together to reshape the policies, programs, and
practices that have marginalized some and, without action, will
perpetuate health disparities. We can create environments where
people are treated fairly, where everyone has a voice in decisions
that affect them, and where all have a chance to succeed.
The 35 RWJF Culture of Health Prize winners are prime examples
of making this a reality. For examples of how several
communities, such as the below are cultivating a shared belief in
good health for all, visit www.rwjf.org/prize.
Columbia Gorge Region, OR/WA
Richmond, VA
Chelsea, MA
Santa Monica, CA
Moving With Data to Action Guidance in the Action Center focuses on areas like:
County Health Rankings & Roadmaps offers a range of
Working together is at the heart of making meaningful
community supports including data, evidence, guidance change. When people share a vision and commitment to
and stories to support communities moving from improve health, it can yield better results than working
awareness to action. Visit our website to learn more – alone. CHR&R’s Work Together guide can help you build
countyhealthrankings.org. and sustain partnerships that reflect the diversity of your
community. Together you can identify the challenges and
CHR&R provides a snapshot of a community’s health solutions that can make a difference.
and a starting point to explore ways to improve health
and increase health equity. Use the Data will help you Taking time to choose policies and programs that have
learn more about the data and find other sources as been shown to work and that are a good fit for your
you begin to assess your needs and resources and community will maximize your chances of success.
focus on what's important. CHR&R’s Choose Effective Policies & Programs guide can
help you explore and select strategies to address priority
Our Partner Center helps changemakers in all sectors issues.
make connections and leverage collective power to
put ideas into action. Once you have decided what you want to do, the next
step is to make it happen. CHR&R’s guide to Act on
Our Action Center provides step‐by‐step guidance to What’s Important can help your community build on
help communities assess their needs, drive local policy strengths, leverage available resources, and respond to
and systems changes, and evaluate the impacts of unique needs.
their health improvement efforts. Our team of
community coaches are available to communities What you say and how you say it can motivate people to
across the nation to guide local collaborations and take the right action at the right time. CHR&R’s
individuals to accelerate learning and action. Communicate guide can help you to develop strategic
messages and deliver those messages effectively.
Page 11 | countyhealthrankings.orgCounty Health Rankings 2018
2018 County Health Rankings for the 88 Ranked Counties in Ohio
County County County County
Adams 88 88 Fairfield 11 11 Licking 32 29 Portage 31 24
Allen 51 51 Fayette 72 64 Logan 40 25 Preble 53 34
Ashland 18 27 Franklin 49 50 Lorain 38 37 Putnam 3 3
Ashtabula 69 77 Fulton 21 26 Lucas 66 76 Richland 57 55
Athens 71 56 Gallia 84 57 Madison 30 43 Ross 74 65
Auglaize 10 12 Geauga 2 4 Mahoning 68 61 Sandusky 48 23
Belmont 55 68 Greene 14 14 Marion 73 87 Scioto 82 85
Brown 76 72 Guernsey 78 71 Medina 4 5 Seneca 41 31
Butler 52 47 Hamilton 65 40 Meigs 80 75 Shelby 12 16
Carroll 39 54 Hancock 20 8 Mercer 9 6 Stark 42 39
Champaign 37 30 Hardin 61 66 Miami 26 18 Summit 46 44
Clark 70 69 Harrison 56 81 Monroe 47 79 Trumbull 64 74
Clermont 36 28 Henry 8 10 Montgomery 75 60 Tuscarawas 28 49
Clinton 59 52 Highland 81 73 Morgan 77 82 Union 6 19
Columbiana 63 70 Hocking 62 53 Morrow 35 48 Van Wert 23 15
Coshocton 50 67 Holmes 7 45 Muskingum 67 58 Vinton 85 83
Crawford 54 46 Huron 34 41 Noble 25 59 Warren 5 2
Cuyahoga 60 62 Jackson 86 84 Ottawa 27 20 Washington 43 42
Darke 29 22 Jefferson 79 80 Paulding 16 36 Wayne 15 13
Defiance 24 32 Knox 33 21 Perry 45 63 Williams 19 33
Delaware 1 1 Lake 13 9 Pickaway 44 38 Wood 17 7
Erie 58 35 Lawrence 83 78 Pike 87 86 Wyandot 22 17
Stay Up‐To‐Date with County
Health Rankings & Roadmaps
For the latest updates on our
Rankings, community support,
RWJF Culture of Health Prize
communities, and more visit
countyhealthrankings.org/news.
You can see what we’re featuring
on our webinar series, what
communities are doing to improve
health, and how you can get
involved!
Page 12 | countyhealthrankings.orgCounty Health Rankings 2018
Technical Notes and Glossary of Terms
What is health equity? What are health disparities? And how do they relate?
Health equity means that everyone has a fair and just opportunity to be as healthy as possible. This requires removing obstacles
to health such as poverty and discrimination, and their consequences, including powerlessness and lack of access to good jobs
with fair pay, quality education and housing, safe environments, and health care.
Health disparities are differences in health or in the key determinants of health such as education, safe housing, and
discrimination, which adversely affect marginalized or excluded groups.
Health equity and health disparities are closely related to each other. Health equity is the ethical and human rights principle or
value that motivates us to eliminate health disparities. Reducing and ultimately eliminating disparities in health and its
determinants of health is how we measure progress toward health equity.
Braveman P, Arkin E, Orleans T, Proctor D, and Plough A. What is Health Equity? And What
Difference Does a Definition Make? Robert Wood Johnson Foundation. May 2017
How do we define racial/ethnic groups?
In our analyses by race/ethnicity we define each category as follows:
Hispanic includes those who identify themselves as Mexican, Puerto Rican, Cuban, Central or South American, other
Hispanic, or Hispanic of unknown origin.
American Indian/Alaskan Native includes people who identify themselves as American Indian or Alaskan Native and do
not identify as Hispanic. This group is sometimes referred to as Native American in the report.
Asian/Pacific Islander includes people who identify themselves as Asian or Pacific Islander and do not identify as
Hispanic.
Black includes people who identify themselves as black/African American and do not identify as Hispanic.
White includes people who identify themselves as white and do not identify as Hispanic.
All racial/ethnic categories are exclusive so that one person fits into only one category. Our analyses do not include people
reporting more than one race, as this category was not measured uniformly across our data sources.
We recognize that “race” is a social category, meaning the way society may identify individuals based on their cultural ancestry,
not a way of characterizing individuals based on biology or genetics. A strong and growing body of empirical research provides
support for the notion that genetic factors are not responsible for racial differences in health factors and very rarely for health
outcomes.
How did we compare county ranks and racial/ethnic groups for length and quality of life?
Data are from the same data sources and years listed in the table on page 15. The mean and standard deviation for each health
outcome measure (premature death, poor or fair health, poor physical health days, poor mental health days, and low
birthweight) are calculated for all ranked counties within a state. This mean and standard deviation are then used as the metrics
to calculate z‐scores, a way to put all measures on the same scale, for values by race/ethnicity within the state. The z‐scores are
weighted using CHR&R measure weights for health outcomes to calculate a health outcomes z‐score for each race/ethnicity. This
z‐score is then compared to the health outcome z‐scores for all ranked counties within a state; the identified‐score calculated for
the racial/ethnic groups is compared to the quartile cut‐off values for counties with states. You can learn more about calculating
z‐scores on our website under Rankings Methods.
How did we select evidence‐informed approaches?
Evidence‐informed approaches included in this report represent those backed by strategies that have demonstrated consistently
favorable results in robust studies or reflect recommendations by experts based on early research. To learn more about evidence
analysis methods and evidence‐informed strategies that can make a difference to improving health and decreasing disparities,
visit What Works for Health.
Technical Notes:
In this report, we use the terms disparities, differences, and gaps interchangeably.
We follow basic design principles for cartography in displaying color spectrums with less intensity for lower values and
increasing color intensity for higher values. We do not intend to elicit implicit biases that “darker is bad”.
In our graphics of state and U.S. counties we report the median of county values, our preferred measure of central tendency
for counties. This value can differ from the state or U.S. overall values.
Page 13 | countyhealthrankings.orgCounty Health Rankings 2018
2018 County Health Rankings for Ohio: Measures and National/State Results
OH OH
Measure Description US OH Minimum Maximum
HEALTH OUTCOMES
Premature death Years of potential life lost before age 75 per 100,000 population 6,700 7,700 3,800 11,700
Poor or fair health % of adults reporting fair or poor health 16% 17% 10% 23%
Poor physical health days Average # of physically unhealthy days reported in past 30 days 3.7 4.0 3.0 4.7
Poor mental health days Average # of mentally unhealthy days reported in past 30 days 3.8 4.3 3.3 4.7
Low birthweight % of live births with low birthweight (< 2500 grams) 8% 9% 5% 11%
HEALTH FACTORS
HEALTH BEHAVIORS
Adult smoking % of adults who are current smokers 17% 23% 14% 25%
Adult obesity % of adults that report a BMI ≥ 30 28% 32% 27% 40%
Food environment index Index of factors that contribute to a healthy food environment, (0‐10) 7.7 6.6 5.7 8.9
Physical inactivity % of adults aged 20 and over reporting no leisure‐time physical 23% 26% 19% 36%
activity
Access to exercise opportunities % of population with adequate access to locations for physical activity 83% 85% 16% 97%
Excessive drinking % of adults reporting binge or heavy drinking 18% 19% 16% 21%
Alcohol‐impaired driving deaths % of driving deaths with alcohol involvement 29% 34% 16% 60%
Sexually transmitted infections # of newly diagnosed chlamydia cases per 100,000 population 478.8 489.3 84.3 847.2
Teen births # of births per 1,000 female population ages 15‐19 27 28 8 53
CLINICAL CARE
Uninsured % of population under age 65 without health insurance 11% 8% 4% 22%
Primary care physicians Ratio of population to primary care physicians 1,320:1 1,310:1 14,780:1 750:1
Dentists Ratio of population to dentists 1,480:1 1,660:1 15,310:1 980:1
Mental health providers Ratio of population to mental health providers 470:1 560:1 10,980:1 340:1
Preventable hospital stays # of hospital stays for ambulatory‐care sensitive conditions per 1,000 49 57 33 120
Medicare enrollees
Diabetes monitoring % of diabetic Medicare enrollees ages 65‐75 that receive HbA1c 85% 85% 74% 93%
monitoring
Mammography screening % of female Medicare enrollees ages 67‐69 that receive 63% 61% 48% 69%
mammography screening
SOCIAL AND ECONOMIC FACTORS
High school graduation % of ninth‐grade cohort that graduates in four years 83% 81% 33% 98%
Some college % of adults ages 25‐44 with some post‐secondary education 65% 65% 19% 83%
Unemployment % of population aged 16 and older unemployed but seeking work 4.9% 4.9% 3.2% 11.1%
Children in poverty % of children under age 18 in poverty 20% 20% 5% 32%
Income inequality Ratio of household income at the 80th percentile to income at the 5 4.8 3.5 6.9
20th percentile
Children in single‐parent % of children that live in a household headed by a single parent 34% 36% 8% 47%
households
Social associations # of membership associations per 10,000 population 9.3 11.3 5.4 22.5
Violent crime # of reported violent crime offenses per 100,000 population 380 290 20 794
Injury deaths # of deaths due to injury per 100,000 population 65 75 40 111
PHYSICAL ENVIRONMENT
Air pollution – particulate matter Average daily density of fine particulate matter in micrograms per 8.7 11.3 10.5 13.0
cubic meter (PM2.5)
Drinking water violations Indicator of the presence of health‐related drinking water violations. NA NA No Yes
Yes ‐ indicates the presence of a violation, No ‐ indicates no violation.
Severe housing problems % of households with overcrowding, high housing costs, or lack of 19% 15% 8% 24%
kitchen or plumbing facilities
Driving alone to work % of workforce that drives alone to work 76% 83% 53% 89%
Long commute – driving alone Among workers who commute in their car alone, % commuting > 30 35% 30% 16% 57%
minutes
Page 14 | countyhealthrankings.orgCounty Health Rankings 2018
2018 County Health Rankings: Ranked Measure Sources and Years of Data
Measure Source Years of Data
HEALTH OUTCOMES
Length of Life Premature death National Center for Health Statistics – Mortality files 2014‐2016
Quality of Life Poor or fair health Behavioral Risk Factor Surveillance System 2016
Poor physical health days Behavioral Risk Factor Surveillance System 2016
Poor mental health days Behavioral Risk Factor Surveillance System 2016
Low birthweight National Center for Health Statistics – Natality files 2010‐2016
HEALTH FACTORS
HEALTHBEHAVIORS
Tobacco Use Adult smoking Behavioral Risk Factor Surveillance System 2016
Diet and Exercise Adult obesity CDC Diabetes InteractiveAtlas 2014
Food environment index USDA Food Environment Atlas, Map the Meal Gap 2015
Physical inactivity CDC Diabetes InteractiveAtlas 2014
Access to exercise opportunities Business Analyst, Delorme map data, ESRI, & U.S.Census Files 2010 & 2016
Alcohol and Drug Use Excessive drinking Behavioral Risk Factor Surveillance System 2016
Alcohol‐impaired driving deaths Fatality Analysis Reporting System 2012‐2016
SexualActivity Sexually transmitted infections NationalCenter for HIV/AIDS,Viral Hepatitis,STD, andTB Prevention 2015
Teen births National Center for Health Statistics – Natality files 2010‐2016
CLINICAL CARE
Access to Care Uninsured Small Area Health Insurance Estimates 2015
Primary care physicians AreaHealthResourceFile/AmericanMedicalAssociation 2015
Dentists Area Health ResourceFile/National Provider Identification file 2016
Mental health providers CMS, National Provider Identification file 2017
Quality of Care Preventable hospital stays Dartmouth Atlas of Health Care 2015
Diabetes monitoring Dartmouth Atlas of Health Care 2014
Mammography screening Dartmouth Atlas of Health Care 2014
SOCIAL AND ECONOMIC FACTORS
Education High school graduation EDFacts 2014‐2015
Some college American Community Survey 2012‐2016
Employment Unemployment Bureau of Labor Statistics 2016
Income Children in poverty Small Area Income and Poverty Estimates 2016
Income inequality American Community Survey 2012‐2016
Family and Children in single‐parent American Community Survey 2012‐2016
Social Support households
Social associations County Business Patterns 2015
Community Safety Violent crime UniformCrime Reporting – FBI 2012‐2014
Injury deaths CDC WONDER mortality data 2012‐2016
PHYSICAL ENVIRONMENT
Air and WaterQuality Air pollution – particulate matter* Environmental Public Health Tracking Network 2012
Drinking water violations Safe Drinking Water Information System 2016
Housing and Transit Severe housing problems Comprehensive Housing Affordability Strategy (CHAS) data 2010‐2014
Driving alone to work American Community Survey 2012‐2016
Long commute – driving alone American Community Survey 2012‐2016
*Not available for AK and HI.
Page 15 | countyhealthrankings.orgReport Authors
University of Wisconsin‐Madison Marjory Givens, PhD, MSPH
School of Medicine and Public Health Amanda Jovaag, MS
Department of Population Health Sciences Julie Willems Van Dijk, PhD, RN, FAAN
Population Health Institute
Suggested citation: University of Wisconsin Population Health Institute. County Health Rankings 2018.
Research Assistance: Outreach Assistance: Communications & Website
Courtney Blomme, RD Kate Kingery, MPA Development:
Keith Gennuso, PhD Kitty Jerome, MA Burness
Elizabeth Pollock, PhD Kate Konkle, MPH Forum One
Joanna Reale Raquel Bournhonesque, MPH Kim Linsenmayer, MPA
Jennifer Robinson Ericka Burroughs‐Girardi, MA, MPH Matthew Call
Matthew Rodock, MPH Aliana Havrilla, MPIA Komal Dasani, MPH
Anne Roubal, PhD, MS Antonia Lewis, MPH Lindsay Garber, MPA
Karen Odegaard, MPH Samuel Hicok
Alison Bergum, MPA Justin Rivas, MPH, MIPA James Lloyd, MS
Lael Grigg, MPA Attica Scott, MS
Bomi Kim Hirsch, PhD Jerry Spegman, JD Robert Wood Johnson Foundation
Jessica Rubenstein, MPA, MPH Janna West Kowalski, MS
Jessica Solcz, MPH
Kiersten Frobom Astra Iheukumere, MPA, MBA
Data: Carrie Carroll, MPA
Centers for Disease Control and Olivia Little, PhD
Prevention: National Center for Devarati Syam, PhD
Health Statistics
Dartmouth Institute for Health Policy
& Clinical Practice
Measure of AmericaYou can also read