Assessment of Orthodontic treatment need and level of service provision for the resident population of Cheshire and Merseyside 2018 - NHS England
←
→
Page content transcription
If your browser does not render page correctly, please read the page content below
Assessment of Orthodontic
        treatment need and level of
          service provision for the
           resident population of
         Cheshire and Merseyside
                    2018

Draft orthodontic needs assessment    Page 1
First published: April 2018
Review date: 2024/5
Prepared by:
Orthodontic Steering Group
NHSE Cheshire & Merseyside
Classification: For local use only
Draft orthodontic needs assessment Page 2Acknowledgements NHS England would like to thank all of the individuals, groups and organisations that supported this review. We would particularly like to thank the following who contributed to the review and the development of this document: NHS England (Cheshire and Merseyside) would particularly like to thank the following for their contributions: Gaynor Cartwright, Assistant Contract Manager (Dental) Heather Cattrell, Assistant Primary Care Support Officer (Dental) Yvonne Dailey, Consultant in Dental Public Health John O’Hara, Finance Manager (Dental) Jean Rogers, Senior Commissioning Manager (Dental) NHS Business Services Authority (Dental Services) Public Health England Knowledge and Information Team The C&M Orthodontic Managed Clinical Network. Draft orthodontic needs assessment Page 3
Contents                                 Page

    1. Executive Summary………………………………………………………………………...6

    2. Introduction…………………………………………………………………………………..7

    3. Glossary……………………………………………………………………………………...7

    4. Context……………………………………………………………………………………….8

    5. Data…………………………………………………………………………………………..9

    6. Population demographics…………………………………………………………………. 9

    7. Dental Health and attendance…………………………………………………..……….10

    8. Quantifying the need for orthodontic treatment…………………………..….. ............12

    9. How much orthodontic need is in C&M population of 12 year olds…………………..12

    10. Estimate of normative need……………………………………………………………....13

    11. Perceived need and demand…………………………………………………………….18

    12. Current commissioning for orthodontic treatment in primary care….………………..18

    13. Current primary care service location…………………………………….……………..20

    14. Patient flows in and out of C&M………………………………………….………………21

    15. Referral management system underpinning commissioning approach.…………….24

    16. Referral numbers and patients waiting for orthodontic treatment….…………………25

    17. What orthodontic treatment is provided in primary care………………………………26

    18. Secondary / tertiary care provision………………………………………………………28

    19. Secondary vs. primary care provision…………………………….…………................29

    20. Stakeholder feedback and engagement…………………………………….................30

    21. Knowledge gaps……………………………………………………………….................30

    22. Key Issues………………………………………………………………………………….31

    23. Needs assessment summary…………………………………………………………….32

    24. References…………………………………………………………………………………33

Draft orthodontic needs assessment                                          Page 4
Index of tables
1 Projected average population of 12 year old children in C&M - 2014 base
projections from ONS for years 2017 to 2027.
2 12-year-old Survey 2008/09 - Primary Care Trust Data
3 Number of patient claims within the last 24 month period for patients aged 12
years old at February 2018.
4 Illustrates the levels of normative need in 12 year old children in published
international studies.
5 Estimation of the number of 12 year olds in C&M (combined years average
2017-2027) in need of orthodontic treatment, applying model 1.
6 Estimation of the number of 12 year olds in C&M (combined years average
2017-2027) in need of orthodontic treatment, applying model 2.
7 Summary of comparison methods showing orthodontic need in C&M.
8 UOA commissioned in C&M by Local Authority areas in 2017.
9 UOA commissioned in C&M Local Authority areas in 2016.
10 Merseyside residents flow for orthodontic dental treatment during the period
April 2015 to March 2016
11 Cheshire , Warrington and Wirral residents flow for orthodontic treatment
during the period April 2015 to March 2016
12 E-referral data for patient inflow against resident Local Authority for the period
Feb 2017-18
13 MCN reported numbers of children waiting for orthodontic assessment and
treatment in C&M up to January 2018.
14 Numbers of referrals to primary and secondary care from validate e- referral
system for the period Jan 2017-18.
15 Current commissioned capacity and the number of orthodontic providers at
January 2018.
16 Number of first appointments and follow ups from each major acute provider,
with associated costs for the financial year 2015/16.
17 Number of first appointments and follow ups from each major acute provider,
with associated costs for the financial 2016/17.
Appendices
Appendix 1 Projected population of 12 year old children in C&M - 2014 base
projections from ONS for years 2017 to 2027.
Appendix 2 Location of Orthodontic Dental Practices within Local Authority
LSOA IMD 2015 deciles.
Appendix 3 Location of Primary Care Dental Practices in C&M,at Dec 2017.
Appendix 4 Cheshire & Merseyside orthodontic patient inflow by CCG and
legacy PCT, period Feb 2017- Feb 2018.
Appendix 5 Vital signs for orthodontic contracts in C&M; 2015-16, 2016-17.
Draft orthodontic needs assessment Page 51. Executive summary The purpose of this orthodontic needs assessment is to systemically provide information to support efficient and effective use of resources to inform commissioning decisions that are beneficial to the oral health of the population. Understanding need is not an exact science. Orthodontic treatment need can be categorised in a number of ways. The assessment is based upon estimating the need in the 12-year-old population, using a measure called Index of Orthodontic Treatment Need. For the purpose of this document the figures obtained by using the “third rule” are used in calculations of need. This ensures the document is consistent with the NHS England Orthodontic Commissioning Guide 2015. The location and capacity of current providers is largely historic and there has been little active commissioning of orthodontic services since the advent of the new contract in 2006. The data suggest that if primary care orthodontic activity continues to be commissioned at 2017 levels then there will not be sufficient orthodontic activity provided in primary care to meet the modelled need. However, this gap assumes that all activity is delivered in primary care, there also is a considerable amount of activity delivered in secondary care. Secondary care data has limitations and ideally there should be further analysis of these data so that it can be determined whether the current level of commissioned activity is sufficient to address the need based upon current and future service delivery models. Prior to the introduction of the e-referral system, waiting lists and times for primary care orthodontic treatment were not routinely collected or standardised. Self-reported data suggests a large variation in the waiting times, between the primary and secondary care providers. Validation of historic waiting lists, in both primary and secondary care would provide further beneficial data, for future commissioning of services. Patient flows for orthodontic care, is relatively stable, with inflows from neighbouring NHSE regions balancing outflow. The exception is cross boarder flow, where the proportion of inflow from Wales is much greater than outflow. Data including local demographics, patient views and current service delivery need to be triangulated to provide a whole systems approach towards planning a future service, which provides efficient and effective service delivery. Draft orthodontic needs assessment Page 6
2.     Introduction

       The 2013 Health and Social Care Act brought together the commissioning of
       all dental services into NHS England (NHSE). Prior to 2013, dental services
       across Cheshire and Merseyside (C&M) were commissioned by 8 Primary
       Care Trusts (PCTs). Historically each PCT had undertaken individual
       orthodontic needs assessments. This document represents the first such
       needs assessment for NHSE C&M area. The document has been work in
       progress since 2015, with data being reviewed and updated on an annual
       basis.

       The needs assessment gives an overview of the current position of
       orthodontic commissioning in C&M. The current data described within the
       document is designed to inform commissioning, it outlines population need
       and orthodontic services currently commissioned, before identifying gaps in
       services and knowledge.

3.     Glossary

          Abbreviation / term                        Definition

        C&M                          Cheshire & Merseyside
        PCT                          Primary Care Trust
        LA                           Local Authority
        UOA                          Units of Orthodontic Activity
        NHSE                         National Health Service England
        PDS                          Personal Dental Service
        GDS                          General Dental Service
        IOTN                         Index of Orthodontic Treatment Need
        DMFT                         Decayed , Missing, Filled Teeth
        MCN                          Managed Clinical Network
        CCG                          Clinical Commissioning Group
        GDP                          General Dental Practitioner
        CDHS                         Child Dental Health Survey
        DHC                          Dental Health Component
        AC                           Aesthetic Component
        SUS                          Secondary users service
        LGA                          Local Government Association
        ONS                          Office of National Statistics

Draft orthodontic needs assessment                                         Page 7
4. Context
4.1. Orthodontics is the dental specialty concerned with facial growth,
development of the dentition and occlusion, and the assessment, diagnosis,
interception and treatment of facial irregularities and malocclusions. 1 General
dental practitioners, dentists with enhanced skills and orthodontic specialists
deliver primary care orthodontic services. They may be supported by
orthodontic therapists.
4.2 Secondary care orthodontics is delivered by consultants and specialists
assisted by orthodontic therapists and trainees. Secondary care orthodontists
offer advice, training and treat the most complex cases.
4.3 Successful outcomes from orthodontic treatment may include improved
appearance and improved function enabling an individual to eat, speak and
socialise without, discomfort or embarrassment and which contributes to
general well-being. In many cases the consequences of not providing
orthodontic treatment for an individual are not easy to quantify. A small
number of cases may give rise to oral health problems such as gingival
trauma, increased risk of dental damage due to external trauma if not treated,
however, the most commonly cited negative outcome for untreated
malocclusion is ‘psycho- social’ a catch all description for the psychological or
social disability consequent to having misaligned teeth.
4.4. The orthodontic provision in C&M were provided through a number of primary
and secondary care contracts, which are historically derived from PCTS. The
contracts are currently managed by NHS England (NHSE).
4.5. Across C&M primary care orthodontic services are provided through time-
limited Personal Dental Services (PDS) contracts. In one area only (Halton),
units of orthodontic activity (UOAs) are provided through a single open-ended
General Dental Services (GDS) contract.
4.6. The majority of the current time-limited PDS contacts will expire on 31st March
2019.
4.7. The majority of secondary care orthodontic services are provided through
NHSE directly commissioning with nine NHS Hospital Trusts.
4.8. Primary care orthodontic treatment provided within the NHS is funded in a
currency called units of orthodontic activity (UOA). A full course of fixed
orthodontic treatment will require 21 UOA 1. It is assumed that some patients
will require a separate orthodontic assessment. To allow for these slight
Draft orthodontic needs assessment Page 8variations in the way patients are managed, NHSE have adopted a more
liberal approach to measuring activity within a needs assessment. Thus local
commissioners were informed in 2017, that each completed course of
orthodontic treatment, for an individual patient, will be modelled using 22.5
UOA.
4.9. The policy for NHSE is to commission orthodontic treatment under the NHS
for children 18 years and under at the more severe end of the spectrum of
malocclusion present in the population. Treatment need can be clinically
assessed using the Index of Orthodontic Treatment Need (IOTN). This index
has two components. Firstly a measure of clinical need assessed on scale of
1- 5 where 5 is more severe. Secondly, an aesthetic assessment on a scale
from 1-10 where 10 is least aesthetically acceptable. The current threshold for
eligibility for treatment under NHS contract is IOTN 3 (AC 6-10) 4 and 51
Children who are 12 years of age are the age group used to define
orthodontic need, as treatment is usually carried out when all the permanent
teeth have erupted. The National Child Dental Health Survey showed that
35% of 12 year old children in the UK had an index of treatment need (IOTN)
score of 3.8 or above based on dental health and aesthetic grounds. It is
estimated that 26% of 12 year old children will fall into IOTN 4 and 5. Although
the number of children in IOTN 5 only has not been published, senior
clinicians estimate this to be between 5-10%2.
5. Data
In order to inform the needs assessment, data was used from a variety of
sources; orthodontic service provision and access to NHS dental services was
provided by the Business Service Authority. The Local Authority joint strategic
needs assessment and the Local Government Association (LGA)3 website,
provided, population data for C&M. The NHS England area team for C&M
provided information for the UOA contract values currently commissioned
from all providers of orthodontics, the quality outcome data for the providers
and electronic referral data.
6. Population demographics
6.1. Population demographics relating to each of the 9 Local Authorities (LAs)
within the NHSE C&M boundary were reviewed using the LGA website, these
data included: levels of deprivation, population density and total population
projections for age.
Draft orthodontic needs assessment Page 96.2. Appendix 1 shows data by age, derived from the Office of National Statistics
for the 12 years of age population estimates per Local Authority within C&M,
for the years 2017-20274. These estimates are based upon the 2014 census
data. The data in appendix 1 has been used to produce the figures in Table 1,
which are based upon an average of each LA 12 year old population
estimates for the period 2017-2027.
6.3 The data suggest that there will be a projected 8 percent increase in 12 year
old children within C&M, over the 10 year period 2017 and 2027.
6.4. There is a large variation in resident population sizes within the 9 local
authorities across NHSE C&M, which is reflected in the size of the 12 years of
age population. This ranges from 1,600 in Halton to over 5,000 in Liverpool.
Table 1
Projected average population of 12 year old children in C&M - 2014 base
projections from ONS for years 2017 to 2027
Local Authority Projected average number of 12 year olds
between 2017-2027
Cheshire East 4,431
Cheshire West & Chester 3,842
Halton 1,649
Knowsley 1,816
Liverpool 5,076
Sefton 3,089
St. Helens 2,104
Warrington 2,646
Wirral 3,933
TOTAL 28,585
7. Dental Health and attendance
7.1 The oral health of 12 year old children was surveyed in 2008-092. The
survey was undertaken when PCTs commissioned dental services Table 2
shows that in the C&M area there was a wide variation across the various
PCTs for 12 year olds who had experienced dental disease (DMFT>0), with
a range from 29% to 56%.
Draft orthodontic needs assessment Page 10Table 2 12-year-old Survey 2008/09 - Primary Care Trust Data2
PCT Name 12-year-old Weighted
Population Measures
(Mid-2008) % D3MFT > 0
England 608,460 33.4%
Central and Eastern Cheshire 5,539 28.8%
Halton and St Helens 3,690 41.6%
Knowsley 1,993 56.1%
Liverpool 4,729 52.5%
Sefton 3,414 38.1%
Warrington 2,389 32.9%
Western Cheshire 2,744 30.6%
Wirral 3,829 36.0%
7.2. Under the current dental contractual arrangements (introduced in
April 2006), patients do not have to be registered with a NHS dentist to
receive NHS dental care. The closest equivalent measure to ‘registration’ is
the number of patients receiving NHS dental services (‘patients seen’) over a
24-month period.
7.3 Table 3 shows the numbers of claims for children aged 12 years of age
attending a dentist in C&M over the 24 month period, up to February 2018. If
these figures are aligned with the population estimates for 12 year olds in
table 1, it could be assumed that over 70% of 12 year olds will attend a dentist
in C&M, each year.
Table 3
Number of patient claims in the last 24 months period Number of
for patients aged 12 at February 20185: claims for
patients age
12, in 24 month
period
Area Team Area February 2018
Team
Code
Cheshire, Warrington and Wirral
Q44 12,866
Merseyside
Q48 11,177
TOTAL 24,043
Draft orthodontic needs assessment Page 118. Quantifying the need for orthodontic treatment
8.1. In order to determine the amount of orthodontic service that should be
commissioned, consideration needs to be given to the prevalence of disease
in the population as determined by dental professionals. In addition one needs
to regard factors which then modify this normative need – e.g. patient
compliance, patient preference, and oral health status.
8.2. The prevalence of malocclusion in 12 year old children is the measure usually
referenced when considering this issue. The prevalence of malocclusion at 12
years of age will underestimate estimates of treatment need in any one year,
as there will be a small group of the population that will have a treatment need
but won’t be accounted for in the 12 year cohort. These groups include:
A proportion of young children who have “interceptive treatment” in attempt to
reduce the need for complex treatment when they are older.
A group of older patient who may require orthodontic treatment in addition to
complex surgery, they are usually referred to as orthognathic patients and the
majority of their care will be undertaken in secondary/tertiary care.
9. How much orthodontic need is in Cheshire & Merseyside
population of 12 year olds?
9.1 Orthodontic need can be categorised in a number of different ways:
1. Normative (clinical) need established by examination by trained
clinician and commonly measured using the Index of Orthodontic
Treatment Need.
2. Demand for treatment from children (or parents) who ‘Want’
orthodontic treatment to straighten teeth.
9.2 There are various methods of estimating need for orthodontic care,
particularly in relation to normative need. No method of assessing need
however, is precise.
9.3 It is important that any estimate of need in C&M be consider within the context
of the system as a whole.
Draft orthodontic needs assessment Page 1210. Estimate of normative need
There are various methods of assessing normative need, no method is
precise, this report describes 3 methods:
10.1. Survey method
10.2. Stephen’s formula method
10.3. The rule of ‘a third’ method
10.1. Survey method
Most orthodontic needs assessments utilise the Community Dental Health
Survey (CDHS) 2003, 2013 data. The surveys assess need using a modified
Index of Orthodontic. The survey does not recognise a child with an IOTN 3.6-
3.7 as having a treatment need, whereas a child with this IOTN would be
eligible for treatment on the NHS. This means that these figures will slightly
underestimate the need for Orthodontic care according to NHS IOTN
threshold.
Summary of level of treatment need as measured by consecutive
Children’s Dental Health Surveys, 2003 and 2013
Year % in treatment % treatment need % total need
2003 8 35 43
2013 20 Not gathered Not gathered
Using the 2003 survey, 35% of children had an IOTN Dental Health
Component (DHC) of 4 or 5 or an Aesthetic Component (AC) of 8-10. This
approach doesn’t include those with an AC of 3.6 or 3.7. 8% of those
surveyed were wearing orthodontic appliances. DPB data suggested that
under the new contract regulations 2006, that some 14% fewer people would
be eligible for NHS orthodontic treatment. If this is correct then one might
suppose that 14% of those with orthodontic appliances wouldn’t fall into the
IOTN categories of DHC3 with an AC of 6 or higher, thus 86% of 8% may be
eligible i.e. 6.9%2.
Taking these two values there is an estimate that 35% + 6.9%=41.9% of
Draft orthodontic needs assessment Page 1312 year old children had an IOTN Dental Health Component (DHC) of 4 or
5 or with an Aesthetic Component (AC) of 8-10.
Additional complex work can be undertaken to estimate the impact of the
interceptive treatments and other factors, however, utilising either simple 35%
or the adjusted 41.9% appears to be well accepted. However, it should be
remembered that these figures assume 100% of 12 year olds will attend a
dental practice. These data also make assumptions that all children who need
orthodontic treatment will accept it. Numbers for acceptance of treatment
have been estimated at between 25 - 50 % depending on the population and
number of 12 year old children attending a dentist within a given year.
10.2. Stephen’s formula method
Stephen’s method is one of a number of formulaic methods of estimating
normative need. This method defines a person with need as having an IOTN
dental health component of (DHC) 4 or 5 (which again differs slightly from the
NHS IOTN threshold).
The formula for Stephen’s method of estimation of need
12 year old population X 100 + interceptive factor + adult factor
3 100
(Where interceptive factor = 4 and adult factor = 9)
Stephen’s formula is likely to provide an overestimate of need for treatment
because it does not include demand6.
10.3. The rule of ‘a third’ method
Evidence from national surveys and literature suggest that around 33% of 12-
year olds have an objective need for orthodontic treatment (table 3). In a
typical school population, one third of the children fall into IOTN categories 4
and 5. This method of estimation is supported by the NHS England
commissioning guide for orthodontics1.
Draft orthodontic needs assessment Page 14Table 4
Illustrates the levels of normative need in 12 year old children in published
international studies
Author Date Country Sample Age of Percent
size children with
(years) definite
treatment
need*
Brooke and 1989 England 333 11-12 32.7%
Shaw7
Holmes8 1992 England 996 12 32.0%
Wang et al9 1999 China 765 12 37.0%
Abdullah 2001 Malaysia 5,112 12-13 30.0%
and Rock10
Abu Alhaij et 2004 Jordan 1,002 12-14 34.0%
al11
10.4. To allow for the discrepancies in data, three differing data sets have been
modelled. The modelling assumed that orthodontic treatment need will
normally be distributed across those children who are currently accessing
NHS dental services.
The three models are as follows:
Model 1
Table 5 takes a liberal view and assumes that 35% of 12 year olds need
treatment, of whom all will attend a dentist, (although based upon figures in
table 3, this does not appear to be the case), with a further assumption that
90% of those offered orthodontic care will accept it.
Model 2
Table 6 uses the assumption described in the 2015 Orthodontic
Commissioning Guide1, population need will be based on an estimate of a
third (33%) of the 12 year old population, within the NHSE locality, will require
treatment.
Model 3
Is the outcome for Stephen’s formula6.
Draft orthodontic needs assessment Page 15Table 5
Estimation of the number of 12 year olds in C&M in need of orthodontic
treatment, applying model 1
Local Authority Number of 12 Number needing 90%
year olds in treatment with of those with need
C&M 35% prevalence expressing
ONS demand
combined
years average
2017-2021
Cheshire East 4,431 1,551 1,395
Cheshire West 3,842 1,345 1,210
and Chester
(includes Vale
Royal)
Halton 1,649 577 519
Knowsley 1,816 636 572
Liverpool 5,076 1,777 1,599
Sefton 3,089 1,081 973
St Helens 2,104 736 663
Warrington 2,646 926 833
Wirral 3,933 1,377 1,239
TOTAL 28,585 10,006 9,003
Table 6
Estimation of the number of 12 year olds in C&M (combined years average
2017-2027) in need of orthodontic treatment, applying model 2
Local Authority Number of 12 year Number needing treatment
olds in C&M with 33% prevalence
ONS
combined years
average
2017-2027
Cheshire East 4,431 1,462
Cheshire West and 3,842 1,267
Chester
Halton 1,649 544
Knowsley 1,816 599
Liverpool 5,076 1,675
Seton 3,089 1,019
St Helens 2,104 694
Warrington 2,646 873
Draft orthodontic needs assessment Page 16Local Authority Number of 12 year Number needing treatment
olds in C&M with 33% prevalence
ONS
combined years
average
2017-2027
Wirral 3,933 1,297
TOTAL 28,585 9,430
Model 3
Stephen’s formula calculation for C&M, using combined average data for
2017- 2027, 12 year old predicted data (table 1 section 5):
28,585 X 100 + interceptive factor (4) + adult factor(9)
3 100
9,528 X 1.13= 10,767.01
Table 7
Summary of comparison of methods showing estimated orthodontic need in
C&M:
Model Predicted need based on 12 year
age data
Model 1 Based on survey predictions 9,003
Model 2 Rule of a third 9,430
Model 3 Stephen’s formula 10,767
10.5. Table 7 illustrates that there is no precise way of estimating need. These
estimations are just that: it is therefore, crucial that these data are interpreted
with other local population and service data. These data alone are an
insufficient basis from which to commission services and must only be used in
the context of understanding the strengths and weaknesses of the wider
orthodontic system.
For the purposes of this needs assessment the figures obtained by using the
third rule are used in calculations in this document. This is to ensure that this
document is consistent with the NHS England orthodontic commissioning
guide. This method also gives and estimation of need which represents the
mid-range of the three methods.
Draft orthodontic needs assessment Page 1711. Perceived need and demand
Perceived need varies between individuals, is inconsistent even at the same
IOTN, and is difficult to predict with accuracy. Demand for orthodontic
treatment has increased substantially and continues to increase 1. Demand is
likely to be greater in females and children from higher socio-economic
groups12. It is therefore, not possible to predict demand by looking at levels of
normative need alone. Children with a more extreme malocclusion are more
likely to demand treatment than those without. That said, demand can be
absent in children with a high need and present in others with no objective
need. This means that there are groups in society who do not receive
orthodontic care but who may benefit from it. Further, within the North west
socio-economic gradients indicate inequity in orthodontic outcomes, with
children from disadvantage communities having poorer treatment uptake and
outcomes13.
12. Current commissioning for orthodontic treatment in primary
care
12.1. Using model 2 based on an estimate of a third of the 12 year old population
needing orthodontic treatment Table 8 shows that there are variations across
the C&M area for the proportion of treatment starts to the number of resident
children. Commissioned UOAs are much greater in some areas than others.
This is particularly noteworthy in Sefton, where there are low levels of
commissioned service in respect to 12 year old population data.
Draft orthodontic needs assessment Page 18Table 8
UOA commissioned in C&M by Local Authority areas in January 2018
Local Authority Commissioned Provider number Required need case
Number of of starts
UOAs case starts (based on 33% of
Jan 2018 (UOAs / 22.5) projected 12 year
olds populations
2017/21)
Cheshire East 35,592 1,581 1,462
Cheshire West and 39,431 1,752 1,267
Chester
(includes Vale Royal)
Halton Undefined-GDS 0 544
Knowsley 717 31 599
Liverpool 32,334 1,437 1,675
Sefton 5,911 262 1,019
St Helens 7,720 343 694
Warrington 18,212 809 873
Wirral 30,098 1,338 1,297
TOTAL 170,015 7,553 9,430
12.2. Using the previously defined weighted needs assessment ( and NHSE wishes
to calculate treatment starts at 22.5 UOAs per case) it could appear that
within primary care alone there is an under capacity of 2,206 case starts
(courses of treatment), however, the figures do not take into account:
Previous commissioning which based case start requirements on a
figure of 21.5 UOAs per patient (table 9).
All the activity which is provided in secondary care.
Cross border patient flows, which may distort the overall figure.
These confounders are discussed further in the section 13, which describe
patient flow and referral data.
Draft orthodontic needs assessment Page 19Table 9
UOAs commissioned in C&M Local Authority areas
Local Authority Number of Provider number Required need case
UOAs of starts
case starts (based on 33% of
(UOAs / 21.5) projected 12 year
olds populations
2017/21)
Cheshire East 35,592 1695 1,462
Cheshire West and 39,431 1878 1,267
Chester
(includes Vale Royal)
Halton Undefined-GDS 0 544
Knowsley 717 31 599
Liverpool 32,334 1540 1,675
Sefton 5,911 281 1,019
St Helens 7,720 368 694
Warrington 18,212 867 873
Wirral 30,098 1433 1,297
TOTAL 170,015 8,093 9,430
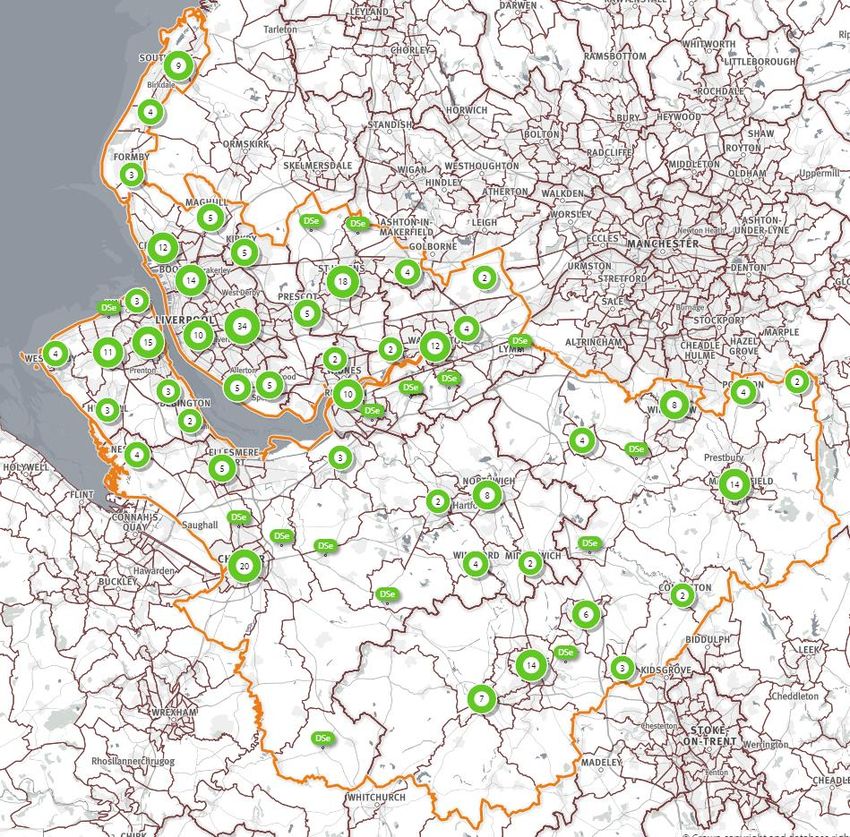
13. Current primary care service location
The map in appendix 2 depicts the location of orthodontic primary care
service providers, within Local Authority boundaries and against the level of
deprivation. If the map is laid over the individual local authority population
density maps3, it can be seen that services in some areas are provided from
sites with a high level of population density, for example the areas of Wallasey
and Birkenhead, for Wirral LA. In other areas of Wirral LA the population
density is less, e.g. West Kirby. In addition, within some LAs a number of
contracts operate from the same site (Liverpool, Wirral and Warrington).
Access to the primary care orthodontic services is via a General Dental
Practice referral, using the NHSE commissioned and MCN developed e-
referral service, which came into effect on 6th Feb 2017. Appendix 3 shows
the location of General Dental Practices, across C&M, who will refer into the
orthodontic services.
Draft orthodontic needs assessment Page 2014. Patient flows for Cheshire & Merseyside
14.1. Data suggest that the majority of C&M residents receive orthodontic treatment
in C&M. However, patients are prepared to travel further for specialist
treatment and it is known that there is some cross boundary flow for
orthodontic treatment in and out of C&M.
14.2. Table 10a/b and Table 11a/b show data in and out flows from BSA data set.
These data are taken from the contract year 04/2015- 03/2016 and broken
down into historic residential health areas of Merseyside and Cheshire.
(The latter includes Cheshire, Warrington and Wirral.)
14.3 BSA data, determines patients’ residence by the postcode recorded on the
FP17 form. In addition the BSA data shown in the tables, relates to the
historic NHSE team structure where there was separate commissioning for
Cheshire and Merseyside respectively. Further the BSA data does not collect
referral to secondary care.
Table 10a
Merseyside resident patient outflow for primary care orthodontic dental
treatment during the period April 2015 to March 2016
Merseyside Number of patients treated
Area where patient resides and receives
treatment
Merseyside 5,291
Lancashire 1,294
Cheshire, Warrington and Wirral 1,221
Greater Manchester 364
Betsi Cadwaladr University Health Board 1
Cumbria, Northumberland, Tyne and Wear 1
Kent and Medway 1
Total 8,173
5
BSA data Set
Draft orthodontic needs assessment Page 21Table 10b
Merseyside resident patient inflow for primary care orthodontic dental
treatment during the period April 2015 to March 2016
Merseyside
Area where patient resides and receives Number of patients treated
treatment
Merseyside 5,289
Unknown 334
Lancashire 152
Cheshire, Warrington and Wirral 51
Greater Manchester 28
Durham, Darlington and Tees 1
Shropshire and Staffordshire 1
Surrey and Sussex 1
Betsi Cadwaladr University Local Health 1
Board
Total 5,858
5
BSA data Set
14.4 BSA data in table 10a/b shows that in the contract year 2015-2016,
Merseyside had 2,315 outflow of resident population for orthodontic treatment,
the majority of residents received primary care orthodontic treatment in
Lancashire.
Table 11a
Cheshire, Warrington and Wirral resident patient outflow for primary care
orthodontic dental treatment during the period April 2015 to March 2016
Cheshire, Warrington, Wirral
Area where patient resides and receives Number of patients treated
treatment
Cheshire, Warrington and Wirral 12,940
Greater Manchester 441
Shropshire and Staffordshire 62
Merseyside 51
Betsi Cadwaladr University Health Board 14
Lancashire 7
South Yorkshire and Bassetlaw 3
Durham, Darlington and Tees 1
Cumbria, Northumberland, Tyne and Wear 1
Derbyshire and Nottinghamshire 1
Hertfordshire and the South Midlands 1
North East London 1
Thames Valley 1
Total 13,524
5
BSA data Set
Draft orthodontic needs assessment Page 22Table 11b: Cheshire, Warrington, Wirral- resident patient inflow for primary care
orthodontic dental treatment during the period April 2015 to March 2016
Cheshire, Warrington, Wirral
Area where patient resides and receives Number of patients treated
treatment
Cheshire, Warrington and Wirral 12,940
Merseyside 1,220
Shropshire and Staffordshire 1,001
Betsi Cadwaladr University Local Health
Board 491
Unknown 491
Greater Manchester 437
Derbyshire and Nottinghamshire 306
Lancashire 13
Other 10
Totals 16,909
14.5 BSA data in table 11a/b, shows that in the contract year 2015-2016, Cheshire
Warrington and Wirral had 3,385 inflow, of patients for primary care
orthodontic treatment, the majority of whom were residents from Merseyside,
Shropshire.
14.6 E-referral data (described further in section 15) provides a more accurate
picture than the BSA data. The e-referral data is based upon the current
NHSE C&M area and includes both primary and secondary referrals. Table 12
is used to depict the Local Authority areas in which patients reside, and who
were managed through the e-referral system, during 2017-2018.
Table 12
E-referral data showing resident Cheshire & Merseyside Local Authority for
patients inflow primary and secondary care orthodontic treatment in C&M
period Feb 2017 to January 2018
Resident Local Authority Numbers Referred
Central and Eastern Cheshire 2,425
Liverpool 2,748
Wirral 2,392
Halton 780
Cheshire West and Chester 2,364
Warrington 1,348
Sefton 1,041
Knowsley 792
St Helens 1,079
Other LAs in England 1,103
Welsh Local Health Boards 234
Total 14,969
NHSE C&M e-referral data
Draft orthodontic needs assessment Page 2314.7. Further e-referral data is provided in Appendix 4. It depicts patient flows via
the CCG area, from which the referred patient resides, and the legacy PCT
area.
14.8. The data show that C&M receive referrals for patients residing within its own
area, across NHSE boundaries e.g. Greater Manchester, Shropshire and
across boarders from North Wales.
14.9 These data need to be considered, during reviews of patient flows for service
planning. It should be accepted, that not all patients will be referred for or
receive care in the area related to their CCG or LA boundaries.
15. Referral management system to underpin the commissioning
approach
15.1. In February 2017 C&M developed an electronic referral management system.
It covers the entire population of C&M (almost three million) and 350 + dental
practices.
15.2. The e-referral system undertakes a validation of all orthodontic referrals using
a secure, web-based system. The orthodontic MCN have developed a
proforma that requires GDPs to confirm a patient being referred, needs, wants
and is suitable for orthodontic treatment. They are guided through the process
to describe the orthodontic need and can add an IOTN as well. Again, this
does not replace a full orthodontic assessment by a specialist – it seeks to
filter those referrals requiring assessment for complexity and urgency, prior to
directing patients to a specialist orthodontist for a case assessment. There are
upwards of 1500-2000 orthodontic referrals received each month in C&M. and
a total of 16,306 were referred in the period January 2017-January 2018.
15.3. The data sets from e-referral can further be analysed at level for gender /age
of referral, social economic status against referral postcodes. For the purpose
of this document, the data have are described currently against referral
numbers and providers only.
15.4 Table 13 shows the e-referral system data for total number of referrals,
17,363, for orthodontic provision in C&M for the period February 2017- 2018.
In addition the numbers of referrals forwarded to providers of orthodontic care,
together with the numbers of primary care referrals waiting to be sent to be
accepted by primary care providers.
Draft orthodontic needs assessment Page 24Table 13
Numbers of referrals sent to primary and secondary care from validate e-
referral system for the period: 01 Feb 2017 and 28 Feb 2018
Care Type Number of referral
Primary care 9006
Secondary care 2262
Primary care (Priority) 323
Tertiary care 50
Waiting for onward 5722
Total 17,363
16. Referral numbers and patients waiting for orthodontic
treatment
16.1 The e-referral data report that at Feb 28th 2018, 5,722 patients were awaiting
to be accepted for assessment, the majority of these were awaiting to enter
primary care services.
16.1. In January 2018, the MCN undertook a waiting list exercise with all providers,
requesting details of numbers of patients waiting for assessment and those
assessed waiting for treatment, pre introduction of the e-referral system.
Table 14 shows the results of the MCN self-reported number of patients
waiting for an initial assessment at January 2018.
Table 14
MCN self- reported numbers of children waiting for orthodontic assessment
and treatment in C&M up to January 2018
Local Authority Self-reported number of Self-reported number of
patients assessed on patients waiting for initial
review for future assessment Jan 2018
treatment Jan 2018
Wirral 872 34
Warrington 466 1,102
Cheshire East 860 184
Cheshire West and Chester 1,232 53
(includes Vale Royal)
Liverpool 639 5,304
St Helens 441 1,647
Knowsley - -
Halton GDS
Sefton - 0
Cheshire and Merseyside
TOTAL 4,570 8,324
Draft orthodontic needs assessment Page 2516.2 The MCN audit reported an excess of 8,000 invalidated referrals sitting on
practice waiting lists which are unevenly distributed across specialist
providers.
16.3. The waiting list for orthodontic treatment vary between the orthodontic
providers, with Liverpool having the largest self- reported waiting lists.
16.4. It is accepted that within these self -reported waiting lists, there is a possibility
of multiple referrals for the same patient further there is also the issue of
historical overhangs in the system, patient cohorts from times prior to the
establishment of sufficient capacity to meet population needs.
16.5. The MCN audit and the patients waiting to be accepted into primary care via
the e-referral system suggest an inequity of access to services for patients
and a possible inefficient use of resources across C&M.
17. What orthodontic treatment is provided in primary care?
17.1. Orthodontic needs assessment and reviewing existing service provision to
meet the need is part of the process and, as a minimum, should also include:
a review of current providers and their service and contract delivery
performance. Table 15 provides details of contact sizes currently held by
providers commissioned by NHSE within C&M.
Table 15
Current commissioned capacity and the number of providers at January 2018
Providers ranked at current commissioning *number of providers
of 22.5 UOAs per case start
1. >601 case starts 1
(>13,501 UOAs)
2. 401- 600 case 7
(9,001-13,500 UOAs)
3. 301-400 case starts 5
(6,501-9,000 UOAs)
4. 201-300 case starts 4
(4,522-6,500 UOAs)
5. 101- 200 case starts 5
(2,273-4,521 UOAs)
6.17.2. In 2015-2016, NHSE held one to one engagement meetings with all providers
and discussed a number of the variables found in the BSA quality data
dashboards. In-particular these included variation in delivery of assess and
accept by contract address and variation in the proportion of courses of
treatment that are abandoned or discontinued.
17.3. The engagement meetings and contract reviews held by NHSE reported that
some of these contracts do not operate efficiently, with orthodontic activity
being used for assessments of patients, sometimes on more than one
occasion, without any provision of treatment.
17.4 Appendix 5 shows the quality dashboards for all orthodontic contract holders
within C&M for the years 2015-16 and 2016-17. These data are submitted by
practices to the BSA. Data are not independently verified.
17.5 The data show there is a range in the quality reporting for the various primary
care providers. This is most evident in the domain for “% of all assessment
that were assess and fit”, range in 2016-17 was 19.1-80.4%. There was an
overall percentage of 61% in Merseyside and 63.1% in Cheshire .These total
percentages for all providers within NSHE C&M, is however, better than the
English average of 58%
17.6. The local variations in quality outcome data have been further analysed at a
Northwest level.by Price et al13 They found evidence of inefficiencies in the
NHS orthodontic service, with 7.6% and 5.2% of NHS primary care
orthodontic treatments in North West England ending in discontinuation and
residual need, respectively. In addition, 38.3% of treatments had missing
outcome data, highlighting the need to improve the outcome monitoring
systems.
17.7. It should be noted that in order to provide a reasonable and acceptable
standard of care to 21st century quality assurance measures, clinicians who
are not on a specialist list in orthodontics would, for a proportion of their
cases, have to secure advice and support from individuals who are on the
specialist list in orthodontics. In addition the specialist should complete 50 or
more cases per year, which is the level suggested as the minimum need to
maintain an appropriate level of skill 1.
Draft orthodontic needs assessment Page 2718. Secondary / tertiary care provision
18.1. The hospital services provide complementary services to specialists who are
providing the majority of the treatment. They will, however, provide a
significant number of specialist type cases for training purposes as they have
an intake of specialist orthodontic trainees every 3 years and each one of
these will require a couple of hundred cases each in order to complete
training. Additionally they will provide care for individuals with complex
orthodontic needs, often requiring a multi-disciplinary approach. These cases
are particularly resource-intensive but will form part of the third of the
population who need and demand orthodontic treatment.
18.2. Secondary care data is challenging to access. It is also difficult to interpret as
each trust records the orthodontic activity in a different way. It was possible
however, to access Secondary User Service (SUS) data on spend by provider
for 2015/16 and 2016/17. The SUS data obtained does not contain
information on types of treatment but focusses on financial reporting.
Tables 16 and 17
Demonstrates the number of first appointments and follow ups from each
major acute provider, with associated costs for the financial years 2015/16
and 2016/17:
Table 16
2015/16: SUS data for acute trusts providing the majority of Orthodontic Care
for C&M residents
Provider Number of Tariff revenue
patients under PBR
seen
Alder Hey Children's NHS Foundation Trust 141 £36,742.89
Countess Of Chester Hospital NHS Foundation
Trust 2058 £956,507.04
East Cheshire NHS Trust 243 £87,298.91
Royal Liverpool and Broadgreen University
Hospitals NHS Trust 2340 £1,361,298.60
St Helens and Knowsley Hospitals NHS Trust 374 £239,914.22
Warrington and Halton Hospitals NHS
Foundation Trust 1332 £603,196.23
Wirral University Teaching Hospital NHS
Foundation Trust 765 £440,455.48
Southport and Ormskirk Hospital NHS Trust 872 £355,824.78
TOTAL 8125 £4,081,238.14
Draft orthodontic needs assessment Page 28Table 17
2016/17: SUS data for acute trusts providing the majority of Orthodontic Care
for C&M residents
Provider Number Total
of cost
patients
seen
Aintree University Hospital NHS Foundation Trust 264 £112,413
Alder Hey Children's NHS Foundation Trust 142 £37,102
Countess Of Chester Hospital NHS Foundation Trust 1960 £735,984
East Cheshire NHS Trust 163 £38,173
Royal Liverpool and Broadgreen University Hospitals
NHS Trust 2123 £1,230,050
Southport and Ormskirk Hospital NHS Trust 541 £191,172
St Helens and Knowsley Hospitals NHS Trust 319 £207,599
Warrington and Halton Hospitals NHS Foundation
Trust 636 £619,200
Wirral University Teaching Hospital NHS Foundation
Trust 1252 £367,339
TOTAL 7400 £3,539,032
18.3. Table 16 and 17 show that there are changes in both secondary care
providers, within the 2 year period from 2015-2017. Further, there would
appear to be a difference in the treatment cost per patient. The data for
secondary care, requires further clarification before conclusions are made.
18.4 An attempt was made to source specific data, in relation to orthognathic cases
currently this was not possible, due to the complexities of how activity is
recorded in these cases.
19. Secondary vs. primary care provision
19.1. In many cases secondary care is the appropriate setting for orthodontic
treatment, especially for those who will need surgical intervention to secure
treatment eg orthognathic cases.
19.2. There is a need to ensure that only those cases especially suited to
secondary care are referred to those providers. The development of the e-
referral management system will facilitate the process to enable patients to be
seen in the most appropriate settings.
19.3. Secondary care data in particular requires additional context, prior to the
patient data being included in the overall commissioned activity.
Draft orthodontic needs assessment Page 2920. Stakeholder feedback and engagement
20.1. Stakeholder feedback has been sought at both a local and national level.
NHSE C&M have undertaken a pilot patient engagement questionnaire to
inform the draft service specification, with 5 specific questions. A wider survey
to a representative sample of patients (over 3800) is scheduled for completion
(by 23/3/18). This feedback can be taken into account for the future
orthodontic procurement.
20.2. As part of developing the national commissioning guide for orthodontics, NHS
England ran a combination of digital engagement and face-to-face focus
groups involving children, young people and their parents/carers in a dialogue
about Orthodontics1.
21. Knowledge gaps
There are a number of areas where it has not been possible to obtain data or
information to inform this needs assessment, these include:
Public/patient views (full survey results were not ratified in time for
publication).
Professional stakeholder views (LDC and full orthodontic MCN members
views were not obtained in respect to this current document).
Uptake of NHS primary care by socio-economic status.
Validation of waiting lists, acquired prior to the implementation of the e-
referral system.
Secondary care data.
o Standardised data collection for all acute trusts.
o Workforce data.
o Orthognathic data.
Draft orthodontic needs assessment Page 3022. Key Issues
22.1. Orthodontic need is commonly assessed by estimating the need in the 12-
year-old population. The location and capacity of current providers is largely
historic and there has been little active commissioning of orthodontic services
since the advent of the new contract in 2006.
22.2. Children of 12 years old population estimates figures, are derived from Office
of national Statistics projections from the census in 2014. They are not
forecasts of the future population and do not attempt to predict the impact of
changes in government policy, economic circumstances and other factors
which may impact on demographic behaviour.
22.3. It is important to note that the number of UOAs needed is used as a proxy for
need across the system. UOAs are not the currency used in secondary care
and this must be taken into account when planning services otherwise there is
a risk that the budget is spent on primary care UOAs only and orthodontic
services may be over-commissioned
22.4. The data show that there are some areas where services are limited and
some areas where capacity is greater than need.
22.5. Numbers waiting for either assessment or treatment in primary care are
variable.
22.6. Since February 2017 referrals are submitted electronically, as recommended
in national guidance. There are agreed referral criteria, and the e-referral form
is used to triage referrals.
22.7. Validation of historic waiting lists, in both primary and secondary care would
provide further beneficial data, for future commissioning of services
22.8 Reduction of historic e.g. pre-e referral, waiting lists will require a non-
recurring increase in contact volumes or change in service delivery models.
22.9. Future commissioning should ensure the location and capacity of service
commissioned meets the local need and takes into account natural patient
flows.
22.10. To maximise NHS resources, there should be a strategy in place to monitor
and maximise the proportion of assessments leading to treatments. In
particular the high level of “concluded” cases where treatment has been
“abandoned” or “discontinued” should be minimised.
Draft orthodontic needs assessment Page 3122.11. .Work with HEE, LDN and MCN to support further dentists when referring
patients for orthodontic treatment.
22.12. Work towards agreeing service specifications for secondary care services
including minimum data set.
22.13. Reach consistent agreement, under which circumstances over 18s receive
orthodontic treatment in secondary care.
22.14. Ensure commissioning of orthodontic treatment planning to support services
treating:
Special care patients
Extractions under GA
23. Needs assessment summary
23.1. Any paper based needs assessment will make a number of assumptions,
accepting that there are inherent inaccuracies within estimates.
23,2 This paper reviews the epidemiological and service activity data for
orthodontic treatment in C&M area. No attempt is made to assess the relative
efficiency of the current providers or whether alternative commissioning
arrangements could deliver improved value for money or quality of service.
23.3. In this paper we have tended to adopt a more liberal view of need from a
primary care context. It is important to note that UOAs are not the currency
used in secondary care and this must be taken into account when planning
services otherwise there is a risk that the budget is spent on primary care
UOAs only and orthodontic services may be over-commissioned.
23.4 It is accepted that there is always a risk that further increased demand will
develop over the next 3-10 years leading to pressure on the system.
Draft orthodontic needs assessment Page 3224. References
1. NHS England Guides for Commissioning Dental Specialities - Orthodontics
2015
2. Health and Social Care Information Centre. 2015 Children’s Dental Health
Survey 2013 Report 4: The Burden of Dental Disease in Children England,
Wales and Northern Ireland.
3. Local Government Association Inform Plus accessed Dec 2017
4. Mid-year estimates: Population Estimates by single year of age and sex for
local authorities in the UK, mid-2014 ONS data.
5. NHSBSA. Clinical monitoring and reporting. Accessed 2015, 2016 2017 and
February 2018.
Holmes R. The prevalence of orthodontic need. British Journal of
Orthodontics 1992; 177-182.
6. Stephens C.D. Standing Dental Advisory Committee – Report of an Expert
Group 1992 Department of Health – Unpublished.
7. Brook PH, Shaw WC. The development of an index of orthodontic treatment
priority. European Journal of Orthodontics 1989; 11 :309-320.
8. Holmes A. The Prevalence of Orthodontic Treatment Need. British Journal of
Orthodontics 1992; 19:177-182.
9. Wang G, Hagg U, Ling J. The orthodontic treatment need and demand of
Hong Kong Chinese children. Chinese Journal of Dental Research 1999; 2(3-
4):84-92.
10. Abdullah MS, Rock WP. Assessment of orthodontic treatment need in 5,112
Malaysian children using the IOTN and DAI indices. Community Dental Health
2001; 18(4):242-248.
11. Abu Alhaija ES, Al-Nimri KS, Al-Khateeb SN. Orthodontic treatment need and
demand in 12-14-year-old north Jordanian school children. European Journal
of Orthodontics 2004; 26(3):261-263.
Draft orthodontic needs assessment Page 33You can also read