RAISING CURIOSITY ABOUT OPEN DATA VIA THE 'PHYSIRADIO' MUSICALIZATION IOT DEVICE - DATA SCIENCE JOURNAL
←
→
Page content transcription
If your browser does not render page correctly, please read the page content below
Trentini, A and Scaravati, S. 2020. Raising Curiosity about Open Data
                                                     via the ‘Physiradio’ Musicalization IoT Device. Data Science Journal,
                                                     19: 39, pp. 1–8. DOI: https://doi.org/10.5334/dsj-2020-039

PRACTICE PAPER

Raising Curiosity about Open Data via the
‘Physiradio’ Musicalization IoT Device
Andrea Trentini and Simone Scaravati
Università degli Studi di Milano, Dipartimento di Informatica, Via Celoria, Milano, IT
Corresponding author: Andrea Trentini (andrea.trentini@unimi.it)

Open data is a technical concept and a political movement since datasets (e.g., on environment
and business) can be used to verify/falsify (ex ante and ex post) governmental policies. But data
analysis is not for the masses and non-experts may not even know the existence of open data.
Here the challenge is to raise interest, curiosity and the need for knowledge in the average
person. Data physicalization may be of some help: by creating a familiar device (e.g., a radio)
that ‘physicalizes’ some publicly available data, the authors are trying to raise curiosity about
the source and availability of open data and the techniques underlying data access, extraction
and analysis.
  This paper presents the prototype of a desktop ‘Physiradio’ that plays internet streams
according to a mapping between weather conditions and musical genre, i.e., a musicalization
process. The association (weather → musical genre) is subjective but understandable by most
people: this device internal workings can be almost fully grasped by the non-experts, thus it
can be used as a conversation starter.
  Physiradio was field-tested among coworkers, students and other people through a quanti-
qualitative information gathering process. The field test data presented here can be useful to
measure the efficacy in:

    • raising curiosity about internals and open data techniques
    • conveying information (i.e., verifying the mapping)

Keywords: data physicalization; open data; Internet Of Things; musicalization

1 Data Physicalization may help open data
Open data (OD) has become a worldwide movement involving governmental and non-governmental
actors. Berners-Lee (2009) and Davies (2010) defined OD ratings to highlight the importance of technical
aspects of openness such as the use of open standards and non-proprietary file formats for publishing.
OD is also becoming a political movement since datasets (e.g., on environment and business) can be
used to verify/falsify (ex ante and ex post) governmental policies: anyone with enough knowledge can
retrieve data from public servers and study the effect of laws such as tobacco taxation change on number
of smokers, vehicle banning on air quality (Trentini 2014) and initiatives to lower the number of unem-
ployed people.
  But data analysis is not for the masses (Puussaar 2018): non-experts either do not know the existence
of OD, or they are not able to extract information from a dataset (Frank et al., 2016). Here the challenge is
to raise interest, curiosity and thus the need for knowledge in the average person. Even if the less-tech-savvy
will eventually decide not to learn how to analyse datasets, at least they will have had the chance to reason
about the possibility to leverage (with the help of a data scientist) their right to civic accountability.
  Data Physicalization (DP) is a recent research area based on the physical representation of any nature and
kind of data. While physical data representations have existed for centuries (Dragicevic and Jansen, n.d.),
the availability of actuated tangible interfaces, advanced pervasive technologies and the increasingly wide-
spread distribution of embedded systems and components, led to the development of DP: creating “modern”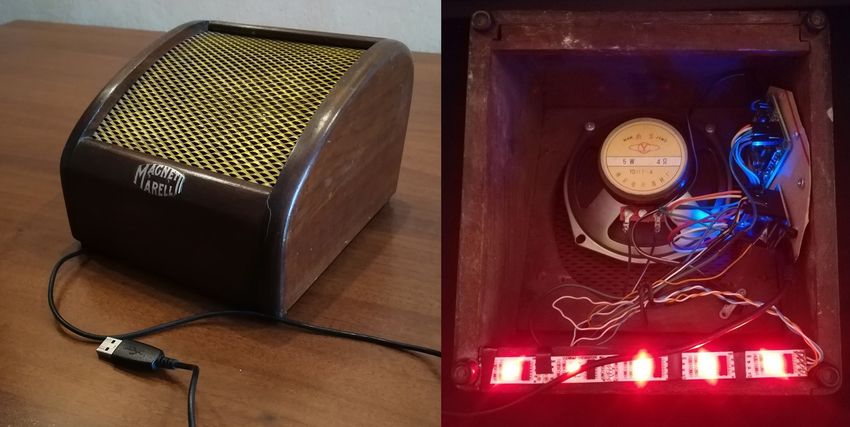
Art. 39, page 2 of 8                                     Trentini and Scaravati: Raising Curiosity about Open Data
                                                                       via the ‘Physiradio’ Musicalization IoT Device

ways to (often dynamically and interactively) represent data through informatics tools coupled with sensors
and actuators. The authors wonder if DP may be of some help spreading OD awareness by creating familiar
and unthreatening physicalizing device, which may increase the curiosity about the source and availability
of some data.
  According to (Jansen et al., 2015) DP may:

  • “help people explore, understand and communicate data using computer-supported physical data
    representations”
  • make data more accessible/reachable
  • foster cognitive benefits
  • democratize data into the real world
  • engage people

The democratization aspect is proposed in (Verweij et al., 2019) where ‘Domestic Widgets’ are used to suc-
cessfully support household creativity and co-creation of data representations. IoT (Internet of Things)
devices are exploited in (Houben et al., 2016) with respect to “the potential to democratize the access, use,
and appropriation of data”, since “most of the data is ‘black box’ in nature: users often do not know how to
access or interpret data”. These devices, “blended into homes”, can be used to engage users.
   For their project, the authors were intrigued by data representations not mainly based on visualization
(i.e., sight-based), that is the most used and maybe natural choice in the technical context, but also through
physicalizations relying on other human senses. A preliminary analysis of the papers listed on the official DP
website (Jansen, n.d.) was completed to extract the ones describing a physical prototype/product that could
give a real implementation of the DP concept. Three main qualitative factors were analysed, listed below side
by side with the corresponding quantitative implementation in the dataset (Scaravati, 2020a):

  1. human senses exploited → SENSES, boolean flags for every human sense (SIGHT, TOUCH, HEAR-
     ING, TASTE, SMELL) where 1 = exploited and 0 = not exploited
  2. interactivity level → INTERACTION, described by 3 values:
       • 0 = no interaction
       • 1 = interaction changes physicalization parameters (data remains the same)
       • 2 = interaction changes the dataset or updates the physicalization
  3. data dynamicity level → DYNAMICITY, a boolean flag (STATIC=0, DYNAMIC=1), where DYNAMIC
     means there is a constant connection between physicalization and data (real time), i.e., if data
     changes the physicalization is updated

Results (Figure 1) show that the most used senses are sight and touch; while hearing, taste and smell are
seldom exploited. Thus the authors wondered if there was a way to take advantage of these “minor” senses.

Figure 1: Frequencies of senses usage in the 51 DP papers analysed.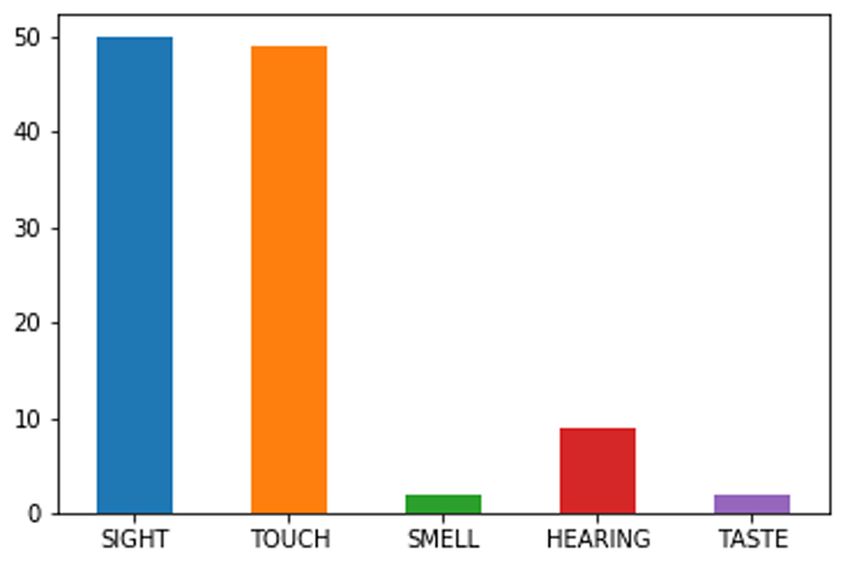
Trentini and Scaravati: Raising Curiosity about Open Data Art. 39, page 3 of 8
via the ‘Physiradio’ Musicalization IoT Device
Avoiding the technological difficulties in using smell and taste as senses for a physicalization, the authors’
choice fell on hearing: i.e., using music, and genre in particular. In fact, music is part of everyone’s life: will-
ing or unwilling we all listen to it, it stimulates emotions and moods which may be useful to convey data.
Although the perception of every song, of any genre and artist, is different for each one of us and brings
subjectivity in the interpretation, the thought of using music as a means of “physicalizing” data, obviously
through hearing, was sound (pun intended).
Finally, object interactivity and data dynamicity were considered: the papers analysis shows low levels for
both aspects. Many devices use static data and allow little physical interaction. Thus the authors devised a
solution, named ‘Physiradio’, capable of managing data in real-time, where both the data to represent and
the experience with which to interact, are dynamic and continuously updated.
2 Blended Internet of Things
IoT (Internet of Things) refers to (often) small devices directly connected to a network. In particular, they
usually have the ability to transfer data back and forth without human intervention, they can be simple
sensors/actuators or more complex devices like personal assistants to manage environmental conditions
(e.g., air conditioning, kitchen, production lines, vehicles).
To implement a device to be accepted by many people, the Physiradio creators decided to build a couple
of IoT appliances inside vintage wooden Magneti Marelli speaker boxes.
Why going with IoT instead of developing other implementations? The authors thought about the use
cases of this specific physicalization, and realized that the best idea was to create something that every
person (regardless of age) could play with and represent data in the comfort of her/his own home/work-
space/car. A kind of blended1 “smart home” device, which, in future developments, may be adapted to
diverse situations.
Next, the problem of choosing an easy-to-grasp OD was addressed. The authors searched for some kind
of data that can be interpreted and understood by anyone, not only by people coming from scientific/tech-
nical studies. Weather conditions came out as the most natural choice because it is something within the
reach of all; while it may not seem the most useful information, nonetheless in the context of this experi-
ment it was just a starter for conversations and stimulus for suggestions that in fact came in quantities (see
below in 6). Physiradio relies on OpenWeatherMap,2 an OD platform that provides many standard meteoro-
logical services. In addition, it supplies an API (Application Programming Interface) to allow software access
to real-time meteorological data.
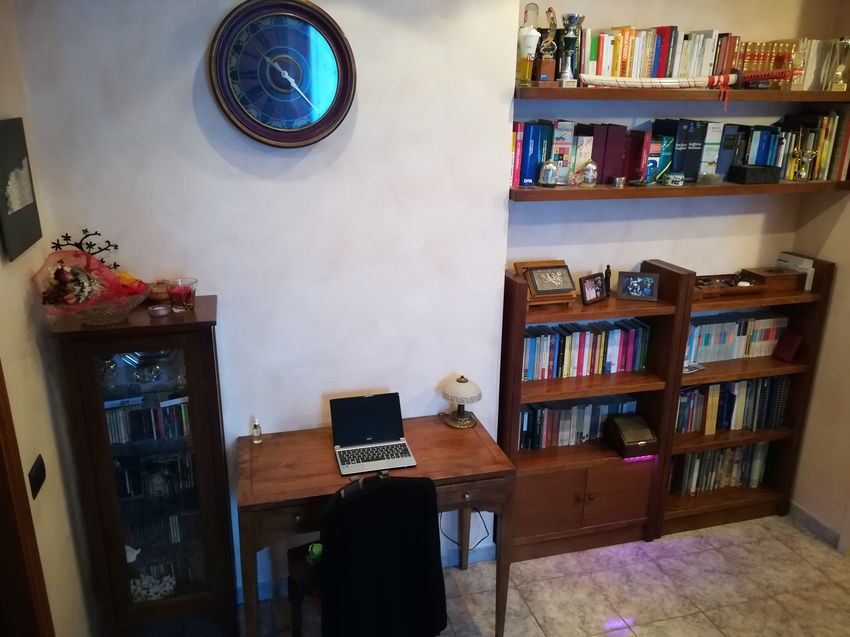
Figure 2: Can you spot the device? (hint: LEDs).
1
See Figure 2 and (Houben et al., 2016) to read about the importance of device blending.
2
https://openweathermap.org.Art. 39, page 4 of 8 Trentini and Scaravati: Raising Curiosity about Open Data
via the ‘Physiradio’ Musicalization IoT Device
3 Music physicalization (“Musicalization”)
When trying to analyze a music track, there are a lot of parameters to consider (e.g., tempo, mode, pitch,
loudness) and it is complicated to evaluate which song is more suited to a particular context. Another funda-
mental aspect is that the lyrics of a song can convey information to the listener (if the words are understood,
of course), but music and lyrics may be discordant for the mood that the song wants to convey (e.g., ‘Some
Nights’ by Fun is a good example of this feature, it sports sad lyrics with an upbeat tempo) thus causing
problems to any classification effort.
There are specific techniques to transfer information via simple sounds generation such as the so called
sonification,3 see for example (Bonafede et al., 2018) and (Ludovico and Giorgio, 2016) who present a face-
tracking and sound-synthesis techniques to sonify facial expressions in order to help people with visual
problems, and a reference system to interpret already-existing and future sonification models. A simple and
steady sound may fail to hold attention in the listener and may become unbearable so when a softer tech-
nique must be used, musification comes to help. Musification has been defined as the musical representa-
tion of data. It is designed to go beyond direct sonification and includes elements of tonality and the use of
modal scales to build music compositions (see Coop, 2016). The resulting musical structures take advantage
of higher-level musical features such as polyphony and tonal modulation in order to entertain the listener
more than in the case of sonification.
Musification and sonification have a feature in common, namely the fact of being monotonically deter-
ministic in the results: given the same input, the output sound/music sheet or track will always be the same.
Physiradio tries to reduce the degree of determinism by broadening the association ‘data → music’ intro-
ducing the concept of “musicalization”: instead of generating sounds (i.e., “sonification”) “musicalization” is
the act of selecting music according to data. In particular, Physiradio chooses and plays categorized streams
available on the Internet, these streams are genre tagged.
4 How to map weather conditions?
Physiradio gets weather conditions values of a configured city (through the OpenWeatherMap APIs), it
elaborates them by extracting the main description and the relative humidity level only, and then it “physi-
calizes” them into a combination of music genre and colour, i.e., the mapping function is:
map(WeatherConditionDescription, Humidity) → (MusicGenre, Colour)
To implement an initial mapping to experiment with, a reference study was examined: in (Karmaker et al.,
2015) many parameters are taken into account to create a model of a music selector based on weather
condition: mode, tempo, pitch, rhythm, harmony, and dynamics for music; temperature, humidity, pres-
sure, wind, sunshine, cloudiness and precipitation for weather. But the main goal of Physiradio is just
to increase curiosity about OD and DP, so there is no need for a perfect mapping. Moreover, there is not
enough metadata available through the freely usable Internet radio streams. So the authors tried to reduce
the number of information needed, and searched for previous studies on how musical genres inspire
specific moods to people, such as (Worlu, 2017). In the papers examined for this work, modern musical
genres, such as LoFi, ChillOut, Smooth Jazz and various types of extreme metal, were not found. Nonethe-
less, these genres are very suggestive and extremely specific: most of the songs belonging to those genres
will sound very similar to each other, which is useful if they want to convey the same information but with
different songs, so the authors chose to use them in the final mapping.
During prototype development, the authors thought about adding an option to display coloured light
(using RGB LEDs) to help device readability. Sight is the most used sense in data representation and this
could be an interesting factor that, mixed with music, could bring semantics and help the user interacting
with the device, to better interpret the data. To introduce colours, the authors relied on Robert Plutchick’s
model (Plutchik, 2001), in particular the wheel of emotions, because even if it is a dated work (1980) it is still
considered one of the most important psychological study on human emotions, with its useful mapping to
colours, which is now part of this project.
To pair genre and colour values in the mapping function, the authors applied studies such as (Worlu, 2017)
that analyse how musical genres trigger specific moods and emotions in people. Moreover, during develop-
ment, interventions on genre choice based on cultural association were applied, such as the ‘Xmas mood’
and specific music genres cited above.
3
https://spdf.gsfc.nasa.gov/research/sonification.Trentini and Scaravati: Raising Curiosity about Open Data Art. 39, page 5 of 8
via the ‘Physiradio’ Musicalization IoT Device
The field tested mapping is presented in Table 1, L# refers to the listening order played during experiments.
5 The Physiradio prototype
Physiradio (see Figure 3) is a desktop streaming-based IoT radio built around the following components:
1. an ESP8266 (Wemos4 D1 mini, an Arduino compatible MCU)
2. a VS1053 MP3 codec (LC Technology)
3. a WS2801 RGB LED strip with 5 LEDs
4. a “Vintage” (circa 1940) Magneti Marelli wooden speaker box mounted with a modern 4Ω
loudspeaker
The prototype is built around an ESP8266 MCU (Micro Controller Unit) board sporting an integrated WiFi
chip that can easily connect to a local network.
The software, developed in ArduinoIDE, inside Physiradio is GPL5 licensed (since the authors believe
in the verifiability and reproducibility of Free Software) and can be downloaded at https://github.com/
simoneScaravati/Physiradio.
Physiradio is an IoT device, it supports a popular interaction protocol adopted for those kind of appliances,
i.e., MQTT (Message Queue Telemetry Transport). Supporting this protocol is essential to add (remote) inter-
action with Physiradio: through MQTT commands it is possible to control the behaviour of the device, such
as changing the volume or switching to another station (stream).
Table 1: The mapping table. L# is the listening order used during the field tests. (*) relative humidity ≥ 85%.
L# Mood Genres Weather Colour
1 Annoyed, frustated, Classical Smoke, haze, sand (annoying Magenta
irritated and polluted weather)
2 Angry, aggressive Metal Clear and high humidity (*) Red
3 Sleepy, bored, tired Smooth jazz Rain, clouds, fog, mist, drizzle Blue violet
4 Happy (feeling good, Summer hits (mix of Clear Yellow
delighted…) sun and popular music)
5 Fear Heavy/extreme metal Thunderstorm, tornado, squall, Dark green
ash, dust (dangerous weather)
6 Sad, depressed lo fi Rain, clouds, fog, mist, drizzle Dark blue
and high humidity (*)
7 Xmas is coming Christmas songs Snow White
Figure 3: The Physiradio prototype: outside and inside.
4
http://wemos.cc.
5
https://www.gnu.org/licenses/gpl-3.0.en.html.Art. 39, page 6 of 8 Trentini and Scaravati: Raising Curiosity about Open Data
via the ‘Physiradio’ Musicalization IoT Device
At present, Physiradio connects to the OpenWeatherMap APIs, gets the weather data (in JSON format) of
the given city, maps them to a web radio stream, plays the stream and, at the same time, waits for commands
(through serial port or MQTT).
The stream is buffered and sent to the VS1053 codec (to convert byte packets into sound) to be played
through the speaker. At the same time, the WS2801 strip will light its LEDs with specific colours, according
to the mapping explained in section 4.
6 Field test, analysis and conclusions
Physiradio is a working prototype of an IoT device playing radio streams according to a mapping between
weather conditions (accessed via open APIs) and musical genres. The main goal of this experiment is to test
if such a device can be a conversation starter to raise curiosity about the OD world, the secondary is to test if
musical genre can be used in a data mapping through a data physicalization process.
The device was field-tested among colleagues, students, friends and frequenters of a local library. Subjects
filled a questionnaire during live presentations of Physiradio. Sample selection is biased because most sub-
jects work in the computer science field. As for the ethical aspect of the questionnaire, the authors did not
ask for a formal approval since they gathered only anonymous data, all fields were optional and all subjects
were informed of the goals of research and that the resulting dataset would have been published on the
web. All gathered data is available on Zenodo (Scaravati, 2020b).
Results show that Physiradio is well accepted (remarks such as “what a beautiful object!” were common)
and that it effectively stimulates curiosity about the “internals” and OD: 64% of the subjects declared high
or very high “curiosity raising” effect, without age correlation (i.e., on all ages). A high percentage of users
who found it interesting also assigned high effectiveness (correlation: 0.49). Only 43.6% of the subjects
declared the mapping between weather condition and musical genre coherent. This evaluation is confirmed
by analyzing the actual matchings in Figure 4 where four (namely 4, 5, 6, 7) listenings out of seven were
often (between 56% and 80% of the times) guessed right while the remaining three (namely 1, 2, 3) where
rarely (between 0% and 8% of the times) guessed right.
One problem emerged very soon: ‘musical genre’ is a definition too wide to be usefully inverted, i.e.,
extrapolate the original weather condition. E.g., a “latin american” webradio may play “salsa”, “bachata”,
“reggaeton”, “chacha”, … (very different subgenres). In fact, in musical terms, there is no universally accepted
definition of specific genres. In addition, the association between music, mood and weather is, of course,
subjective. While this mapping satisfies the precondition to be a formal ‘sonification’ (i.e., same weather
condition in → same genre out) it is also true that genre may not be enough for everyone to associate to a
specific weather condition, even with the help of colour.6 In fact, any webradio available on the Internet may
even be genre-centric but nonetheless it usually plays a vast range of songs belonging to the genre itself, so
the actual experimental sessions were somewhat influenced by the song currently playing. A very impor-
tant suggestion received from a colleague is: “instead of using a genre-centric webradio for every streaming
HBbi2MBM; R yXy
HBbi2MBM; k yXyjj
HBbi2MBM; j yXy8
HBbi2MBM; 9 yXdNe
HBbi2MBM; 8 yX8Nj
HBbi2MBM; e yXdNe
HBbi2MBM; d yX8de
Figure 4: Relative matches per listening. The left box shows the listening order during the field tests and
the relative matching rates, namely when the user guessed the right mapping, plotted on the right box.
Number of subjects: 58.
6
Not every subject noticed/used the coloured LEDs, sometimes because the environment had not proper lighting (e.g., too much
ambient light) and sometimes because the subject decided (and declared) not to pay attention to both music and light.Trentini and Scaravati: Raising Curiosity about Open Data Art. 39, page 7 of 8
via the ‘Physiradio’ Musicalization IoT Device
channel it would be better to create specific playlists, best if user-defined”. Physiradio users, in the long
term, should be able to customize configuration in terms of:
• what data should be taken as input, mapping to an enumeration of values;
• creating playlists;
• associating playlists to values.
In fact Physiradio can be fully controlled via an MQTT API with commands such as ‘volume’, ‘station’ and ‘city’
(to get specific weather data). This way, even a less-tech-savvy user7 could implement a suitable customization.
Of course, the simplest solution to the ‘subjectivity problem’ would be to describe the mapping in the
documentation (or via a small display) so that once assimilated any user would not need to look at the device
later. More suggestions (to address the subjectivity) received were:
• using music from ‘formal’ dancing (e.g., ‘salsa’, ‘tango’, ‘can can’, ‘tarantella’, not general dance/disco
music), these are more canonized and recognizable
• exploiting lights better, e.g., by pulsating the LEDs according to tempo
Anyway, the primary goal of Physiradio was achieved since during experimental sessions many subjects were
genuinely inspired by the device and started suggesting other mappings/musicalizations based on their
work and life experience, this is a list of their feedbacks:
• overall CPU load (in a server farm);
• network traffic, not only in terms of volume but also in terms of type of traffic (denial of service at-
tacks, mail spamming with many repeated messages);
• city traffic conditions;
• train timings/delays (“If you need to get out of your home at the right time, but you’re shaving/bath-
ing or having breakfast”);
• cooking times (“If you fancy a musical oven timer.”);
• call center waiting times (music representing the time to wait for an operator to answer);
• an outsourced (i.e., probably very far away) call centre operator could “listen” (in background) to the
current weather condition at the caller’s location thus adapting the style of the call according to the
weather experienced by the caller;
• in general, any situation where the need to continuously monitor a ‘variable’ (data) cannot be rep-
resented with simple and very annoying tone/sound, to take advantage of the “superior” discerning
(in terms of change recognition) power (Rabenhorst et al., 1990) of hearing over sight;
• in general, contexts where children may be involved, they are more sensitive to music and colours.
These field experiments were very satisfying: subjects became very talkative and asked many questions, the
mapping is far from perfect but Physiradio succeeds in stimulating curiosity and imagination and that was the
authors’ main goal. During questionnaire sessions, genre mapping was soon shaded by the brainstorming about
other data mapping, showing that a device that does not look like a computer can be appreciated better and is
less frightening, above all for less technology oriented people. In conclusion, the authors think that this kind of
data physicalization – the musicalization process combined with a non-frightening device (i.e., a software-only
solution would have been less effective) – could be a useful starting point to develop new ways to raise interest
in data and OD in particular. Next step will be to use the device as a soft leverage to introduce mini seminars
on OD: will subjects be more keen on listening to technical content after having been exposed to Physiradio?
Competing Interests
The authors have no competing interests to declare.
References
Berners-Lee, T. June 2009. Linked data. http://www.w3.org/DesignIssues/LinkedData.html. Accessed 2019.
Bonafede, D, Ludovico, LA and Presti, G. 2018. A proposal for the interactive sonification of the
human face. In: International Conference on Computer-Human Interaction Research and Applications.
SCITEPRESS. pp. 163–169. DOI: https://doi.org/10.5220/0006957001630169
7
Systems such as IFTTT (http://ifttt.com) and NodeRED (http://nodered.org) may be used, they are very easy-to-use and user-friendly.Art. 39, page 8 of 8 Trentini and Scaravati: Raising Curiosity about Open Data
via the ‘Physiradio’ Musicalization IoT Device
Coop, AD. July 2016. Sonification, musification, and synthesis of absolute program music. In: Proceedings
of the 22nd International Conference on Auditory Display – ICAD 2016. The International Community for
Auditory Display. DOI: https://doi.org/10.21785/icad2016.030
Davies, T and Practical Participation. 2010. Open data, democracy and public sector reform: A look at open
government data use from data.gov.uk. Practical Participation.
Dragicevic, P and Jansen, Y. Official list of data physicalizations: List of physical visualizations and related
artifacts. http://dataphys.org/list. Accessed 2019.
Frank, M, Walker, J, Attard, J and Tygel, A. Sep. 2016. Data literacy – what is it and how can we make it
happen? The Journal of Community Informatics, 12(3).
Houben, S, Golsteijn, C, Gallacher, S, Johnson, R, Bakker, S, Marquardt, N, Capra, L and Rogers, Y.
2016. Physikit: Data engagement through physical ambient visualizations in the home. In: Proceedings
of the 2016 CHI Conference on Human Factors in Computing Systems. ACM. pp. 1608–1619. DOI: https://
doi.org/10.1145/2858036.2858059
Jansen, Y. Data physicalization wiki: Bibliography. http://dataphys.org/wiki/Bibliography. Accessed 2019.
Jansen, Y, Dragicevic, P, Isenberg, P, Alexander, J, Karnik, A, Kildal, J, Subramanian, S and Hornbæk,
K. 2015. Opportunities and challenges for data physicalization. In Proceedings of the 33rd Annual
ACM Conference on Human Factors in Computing Systems. ACM. pp. 3227–3236. DOI: https://doi.org/
10.1145/2702123.2702180
Karmaker, D, Al Imran, MD, Mohammad, N, Islam, M and Mahbub, MDN. 2015. An automated music
selector derived from weather condition and its impact on human psychology. GSTF Journal on Computing
(JoC), Global Science and Technology Forum, 4: 13. DOI: https://doi.org/10.7603/s40601-014-0014-8
Ludovico, LA and Giorgio, P. 2016. The sonification space: A reference system for sonification tasks.
International Journal of Human-Computer Studies, 85: 72–77. DOI: https://doi.org/10.1016/j.ijhcs.
2015.08.008
Plutchik, R. 2001. The nature of emotions: Human emotions have deep evolutionary roots, a fact that may
explain their complexity and provide tools for clinical practice. American scientist, 89(4): 344–350. DOI:
https://doi.org/10.1511/2001.4.344
Puussaar, A, Johnson, IG, Montague, K, James, P and Wright, P. 2018. Making open data work for civic
advocacy. Proceedings of the ACM on Human-Computer Interaction, 2(CSCW): 143. DOI: https://doi.org/
10.1145/3274412
Rabenhorst, DA, Farrell, EJ, Jameson, DH, Linton, TD, Jr and Mandelman, JA. 1990. Complementary
visualization and sonification of multidimensional data. In: Farrell, EJ (ed.), Extracting Meaning from
Complex Data: Processing, Display, Interaction, 1259: 147–153. International Society for Optics and
Photonics, SPIE. DOI: https://doi.org/10.1117/12.19981
Scaravati, S and Trentini, AM. 2020a. Phisicalization state of the art analysis dataset. DOI: https://doi.
org/10.5281/zenodo.3612806
Scaravati, S and Trentini, AM. 2020b. Physiradio questionnaire responses dataset. DOI: https://doi.
org/10.5281/zenodo.3627829
Trentini, A. 2014. Lombardy EPA Obtorto Collo data and anti-pollution policies fallacies. Journal of
e-Learning and Knowledge Society, 10(2).
Verweij, D, Kirk, D, Rogage, K and Durrant, A. 2019. Domestic widgets: Leveraging household creativity
in co-creating data physicalisations. Newcastle upon Tyne, United Kingdom: Northumbria University.
Worlu, C. 2017. Predicting listener’s mood based on music genre: An adapted reproduced model of Russell
and Thayer. Journal of Technology Management and Business, 4(1): 20, 06.
How to cite this article: Trentini, A and Scaravati, S. 2020. Raising Curiosity about Open Data via the ‘Physiradio’
Musicalization IoT Device. Data Science Journal, 19: 39, pp. 1–8. DOI: https://doi.org/10.5334/dsj-2020-039
Submitted: 11 June 2020 Accepted: 30 September 2020 Published: 21 October 2020
Copyright: © 2020 The Author(s). This is an open-access article distributed under the terms of the Creative
Commons Attribution 4.0 International License (CC-BY 4.0), which permits unrestricted use, distribution, and
reproduction in any medium, provided the original author and source are credited. See http://creativecommons.org/
licenses/by/4.0/.
Data Science Journal is a peer-reviewed open access journal published by Ubiquity
Press.
OPEN ACCESSYou can also read