Feasibility Study for the Diversion of Airport Operations - at East Hampton Airport
←
→
Page content transcription
If your browser does not render page correctly, please read the page content below
Feasibility Study for the Diversion of Airport
 Operations
 at East Hampton Airport

 HMMH Report 312040.001
 September 6, 2021

 Prepared for:

 Cooley LLP
 1144 15th Street
 Suite 2300
 Denver, CO 80202-2686
Feasibility Study for the Diversion of Airport
 Operations
 at East Hampton Airport

 HMMH Report No. 312040.001
 September 6, 2021

 Prepared for:

 Cooley LLP
 1144 15th Street
 Suite 2300
 Denver, CO 80202-2686

 Prepared by:

 Sarah C. Yenson, Senior Consultant

 Kurt M. Hellauer, Supervisory Airspace Consultant

 HMMH
 700 District Avenue, Suite 800
 Burlington, MA 01803
 T 781.229.0707
 F 781.229.7939
Contents
 Feasibility Study for the Diversion of Flight Operations at HTO

Contents
1 Background and Purpose of Study................................................................................................. 1

2 Data Collection and Processing ..................................................................................................... 3
2.1 Aircraft Operations Data .................................................................................................................................... 3
2.2 Aircraft Data ....................................................................................................................................................... 5
2.3 Airfield-Specific Data .......................................................................................................................................... 5
2.4 Meteorological Data........................................................................................................................................... 7
2.5 Other Data .......................................................................................................................................................... 8

3 Analysis .............................................................................................................................................. 9
3.1 Airport and Airfield Restrictions ....................................................................................................................... 10
3.1.1 fRunway length ................................................................................................................................................ 10
3.1.2 Operational restrictions ................................................................................................................................... 11
3.1.3 Aircraft parking and services ............................................................................................................................ 12
3.1.4 Airfield usage.................................................................................................................................................... 13
3.2 Weather Limitations ......................................................................................................................................... 13
3.2.1 Weather conditions .......................................................................................................................................... 13
3.2.2 Wind limitations ............................................................................................................................................... 14
3.3 Operational Feasibility ..................................................................................................................................... 15

4 Results .............................................................................................................................................. 17
4.1 Historical Flight Operations at East Hampton Airport...................................................................................... 17
4.2 Montauk Airport (MTP) .................................................................................................................................... 19
4.3 Francis Gabreski Airport (FOK) ......................................................................................................................... 22
4.4 Mattituck Airport (21N) ................................................................................................................................... 24
4.5 Southampton Heliport (87N) ........................................................................................................................... 26
4.6 East Hampton Diversion Options ..................................................................................................................... 27

5 Summary and Conclusions ........................................................................................................... 32

6 Acronyms ........................................................................................................................................ 35

 v
Contents
 Feasibility Study for the Diversion of Flight Operations at HTO

Figures
Figure 1: East Hampton Airport and the Diversion Airfields ......................................................................................... 9
Figure 2: Historical Operational Peaks at East Hampton Airport ................................................................................ 19

Tables
Table 1: Aircraft Operations at HTO (2015, 2017, 2019, Jan-June 2021) ...................................................................... 3
Table 2: Aircraft Operations Categorizations ................................................................................................................ 4
Table 3: Inventory of Airport Operations Data Sources ................................................................................................ 4
Table 4: Inventory of Aircraft-Specific Data Sources ..................................................................................................... 5
Table 5: Inventory of Airfield Data Sources ................................................................................................................... 5
Table 6: Airfield-Specific Data for East Hampton Airport and the Diversion Airfields ................................................... 6
Table 7: Inventory of Weather Data Sources................................................................................................................. 7
Table 8: Airport and Airfield Restrictions for the Diversion Airfields .......................................................................... 10
Table 9: Runway Operation Eligibility Matrix for the Diversion Airfields .................................................................... 11
Table 10: Parking Analysis Criteria for the Diversion Airfields..................................................................................... 13
Table 11: Ceiling and Visibility Limitations for VFR and IFR Conditions ....................................................................... 14
Table 12: Example Crosswind Estimation, MTP ........................................................................................................... 14
Table 13: Historical Operations at East Hampton Airport by Engine Type .................................................................. 18
Table 14: Top Twenty Aircraft Operations at East Hampton Airport .......................................................................... 18
Table 15: Operational Counts for Feasible East Hampton Operations at Montauk Airport ........................................ 20
Table 16: Estimated Prior Permission Operational Counts at Montauk ...................................................................... 21
Table 17: Instrument Approach Procedure Ceiling and Visibility Minima at Gabreski Airport ................................... 22
Table 18: Operational Counts for Feasible East Hampton Operations at Gabreski Airport ........................................ 23
Table 19: Operational Counts for Feasible East Hampton Operations at Mattituck Airport ....................................... 25
Table 20: Operational Counts for Parking Restrictions for Feasible East Hampton Operations at Mattituck Airport 25
Table 21: Counts for Potential East Hampton Airport Operational Restrictions ......................................................... 27
Table 22: Potential Estimated Impacts of Operational Restrictions at East Hampton ................................................ 30

 vi
Background and Purpose of Study
 Feasibility Study for the Diversion of Flight Operations at HTO

1 Background and Purpose of Study
Public use airports receiving Federal funding for the purpose of airport development and improvement
are obligated to comply with Federal grant assurances and other laws for several years after receiving
these funds. The East Hampton Airport’s (HTO) obligations to comply with these grant assurances and
other such laws expire in September 2021. With the expiration of these grant assurances, the Town of
East Hampton is considering closing or otherwise modifying airport use by certain categories and classes
of aircraft. Closure or other modifications of the availability of the airport would foreseeably result in
redistribution of some fraction of aircraft operations that would have otherwise occurred at East
Hampton to other airports and landing areas in the region.

This study identifies the number and types of aircraft that could be expected to divert to one of four
airfields in proximity to East Hampton so that the Town of East Hampton can understand the potential
impact on aircraft operations at these diversion airfields, and to provide information for why these
aircraft may choose to divert to these airfields. This assessment is based on the characteristics and
capabilities of existing and historical air traffic at East Hampton Airport, the characteristics and
capabilities of the potential diversion airfields, and general assessments of operator and/or user
decision-making. These airfields—Francis S. Gabreski Airport (FOK), Montauk Airport (MTP), Mattituck
Airport (21N), and Southampton Heliport (87N) – were selected because they are the four closest
airports to East Hampton and presumably the most likely airports to be used if East Hampton were not
an option.

The analysis for this study primarily focused on whether each flight operation could feasibly operate at
any of the four diversion airfields. This feasibility assessment included a review of airport restrictions,
facilities, and characteristics, aircraft performance characteristics, and weather data. The result of that
assessment provided a total number of East Hampton operations that could operate at each airfield.
Following that, we estimated the number of additional operations on a monthly, daily, and hourly basis
that would be needed to support this number of operations, then discussed specific factors that could
motivate passenger or pilot choice for choosing or not choosing to utilize that airfield.

In the remainder of this document, Section 2 identifies the data sources and the purpose for which they
are used. Section 3 describes the analytical process used for this analysis, including the methods used to
identify operations and categorize and filter the data. Section 4 provides a summary of the historical
operations at East Hampton Airport and the results of the feasibility of diverting operations for each of
the airfields. Lastly, Section 5 summarizes the overall effort.

 1
Background and Purpose of Study
 Feasibility Study for the Diversion of Flight Operations at HTO

This page intentionally left blank

 2
Data Collection and Processing
 Feasibility Study for the Diversion of Flight Operations at HTO

2 Data Collection and Processing
To fully determine which aircraft operations could reasonably move to one or more of the proposed
diversion airfields, HMMH has obtained several types of data. These data include East Hampton’s flight
operations data, Federal Aviation Administration (FAA) aeronautical data for diversion airfield
characteristics and facilities, National Oceanic and Atmospheric Association (NOAA) meteorological data,
and other supplemental data, including aerial imagery and airport information.

2.1 Aircraft Operations Data

HMMH used airport operations data from the Vector Noise and Operations Management System
(VNOMS) to identify the types and number of operations at East Hampton Airport. Data were obtained
for the full calendar years of 2015, 2017, and 2019, as well as for January through June of 2021, totaling
98,373 aircraft operations at HTO. Table 1 summarizes the number of operations during the specified
periods.

 Table 1: Aircraft Operations at HTO (2015, 2017, 2019, Jan-June 2021)
 Year Operations Count
 2015 26,010
 2017 28,310
 2019 31,464
 2021 (Partial) 12,589
 Total 98,373
 1
 Source: VNOMS, HTO

These years were selected to compare current operations to historical operations. In 2015, East
Hampton implemented several restrictions and curfews that limited operations at the airport. These
restrictions were subsequently removed in November 2016. Thus, calendar year 2015 represents
operations under such restrictions. Calendar year 2017 and 2019 represent historical operations prior to
the COVID-19 pandemic; 2019 in particular was selected to avoid the presumed anomalous traffic levels
of 2020. Lastly, the first half of 2021 is included to capture air traffic operations in the latter stages of
the pandemic as air traffic presumably returns to more expected levels.

These aircraft operations data are classified by aircraft category, class, and engine type, with the
subcategories for each shown in Table 2. Classifying the aircraft operations by these categories provides
a general proxy for the number of operations that could be diverted to one of the diversion airfields, as
this grouping generally corresponds to airfield requirements such runway length, airport services (e.g.,
instrument approaches, fuel services, etc.), and other relevant airport characteristics.

1 https://airport.vector-us.com/Reports/AngularReports/index.aspx#!/activityReport. Accessed July 2021.

 3
Data Collection and Processing
 Feasibility Study for the Diversion of Flight Operations at HTO

 Table 2: Aircraft Operations Categorizations
 Aircraft Categorization Subcategories
 Fixed wing
 Aircraft Category
 Rotorcraft
 Single-engine land
 Aircraft Class Multi-engine land
 Single-engine sea
 Jet
 Engine Type Turbine propeller
 Piston
 Source: Code of Federal Regulations, Title 14, Part 61

For this analysis, in addition to the aircraft category, class, and engine type, we also used operation date
and time, aircraft model type, and landing and takeoff weights. These data are obtained from VNOMS
and are listed, along with their uses, in Table 3.

 Table 3: Inventory of Airport Operations Data Sources
 Data Source Data Type Used For
 VNOMS Aircraft operation date and time Weather estimation at potential
 diversion airfields
 Identification of day/night operations
 Aircraft model type Determination of aircraft types that are
 allowed to and can safely operate at an
 airport
 Aircraft landing and takeoff Determination of aircraft types that can
 weights safely land and take off at an airport
 Aircraft engine type Determination of aircraft types that are
 allowed to and can safely operate at an
 airport
 NOAA Historical sunrise and sunset times Determination of day or night operations

Each operation was classified as a daytime or nighttime operation based on historical sunrise and sunset
data obtained from NOAA. According to the FAA, nighttime is defined as the time between the end of
evening civil twilight and the beginning of morning civil twilight.2 Morning civil twilight begins when the
geometric center of the sun is six degrees below the horizon and ends at sunrise. Evening civil twilight
begins at sunset and ends when the geometric center of the sun reaches six degrees below the horizon.3
The time between sunrise and morning civil twilight or sunset and evening civil twilight varies depending
on the time of year and airfield latitude, but generally ranges between 15 and 60 minutes before sunrise
or after sunset.4 As historical civil twilight times are not as readily available as sunrise and sunset times,
we approximated morning civil twilight as 30 minutes prior to sunrise and 30 minutes after sunset.

2FAA Airplane Flying Handbook, Chapter 10. FAA-H-8083-3B.
https://www.faa.gov/regulations_policies/handbooks_manuals/aviation/airplane_handbook/media/12_afh_ch10.pdf.
Accessed August 18, 2021.

3 14 CFR Part 1.1, Definitions

4 The Air Almanac, U.S. Naval Observatory. 2020. https://apps.dtic.mil/sti/pdfs/AD1090313.pdf. Accessed August 28, 2021.

 4
Data Collection and Processing
 Feasibility Study for the Diversion of Flight Operations at HTO

2.2 Aircraft Data

Several types of aircraft-specific data were obtained and used in this analysis. These data include the
maximum takeoff weight (MTOW), wingspan, tail height, and stall speed. We used all these
characteristics to determine whether an aircraft could feasibly operate using an airport’s runways. We
also used stall speed to estimate an aircraft’s approach speed and crosswind limitations. These data are
detailed in Table 4.

 Table 4: Inventory of Aircraft-Specific Data Sources
 Data Source Data Type Used For
 FAA Airport Characteristics Database5 Aircraft maximum takeoff weight Determination of aircraft types that can
 safely land and take off at an airport
 FAA Advisory Circular (AC) 150/5300- Aircraft wingspan
 13A, Airport Design, Appendix 16 Aircraft height
 Aircraft stall speed Estimation of approach speed and
 crosswind component to determine if
 aircraft can safely land and take off at
 an airport given certain weather
 conditions
 Aircraft approach speed and category Determination of aircraft types that can
 safely land and take off at an airport
 Estimation of runway length
 requirements

2.3 Airfield-Specific Data

HMMH obtained several types of data to assist in determining the types and level of traffic that each of
the diversion airfields could support. These data types and their uses are summarized in Table 5.

 Table 5: Inventory of Airfield Data Sources
 Data Source Data Type Used For
 FAA Form 5010 Airport FAA Office of Airport Runway length and Determination of aircraft types that
 Master Records (FOK, HTO, Safety and Standards width can safely land and take off at an
 MTP, 87N, 21N) airport
 Runway weight Determination of aircraft types that
 bearing capacity can safely land and take off at an
 airport
 Airport restrictions Determination of aircraft types that
 and limitations are allowed to operate at an airport
 Airport ownership Determination of aircraft types that
 (public vs. private) are allowed to operate at an airport

5FAA Airport Characteristics Database, October 2018.
https://www.faa.gov/airports/engineering/aircraft_char_database/media/FAA-Aircraft-Char-Database-v2-201810.xlsx.
Accessed July 23, 2021.

6FAA Advisory Circular AC 150/5300-13A, February 26, 2014.
https://www.faa.gov/documentLibrary/media/Advisory_Circular/150-5300-13A-chg1-interactive-201907.pdf. Accessed July 23,
2021.

 5
Data Collection and Processing
 Feasibility Study for the Diversion of Flight Operations at HTO

 Data Source Data Type Used For
 Runway heading Crosswind component estimation
Coded Instrument Flight FAA Aeronautical Decision height Determination of whether an
Procedures (FOK, HTO, Information Systems, and visibility operation could safely land at an
MTP, 87N, 21N) June 17 – July 15, requirements by airport under given and/or estimated
 2021 (published on a aircraft approach weather conditions
 28-day cycle) speed
 Limitations and Determination of whether an
 availability of operation could safely land at an
 approach airport under given operational
 procedure conditions (e.g., approach speed,
 time of operation)

Runway length, width, and weight constraints were obtained from the FAA’s Form 5010 Airport Master
Records and determine if an operation could safely land and/or depart from the diversion airfields. Form
5010 also provides ownership information and remarks for each airport, including curfews, restrictions
on aircraft categories or classes, and other information that could contribute to a determination of
whether an operation could use a diversion airfield.

 Table 6: Airfield-Specific Data for East Hampton Airport and the Diversion Airfields
 Driving
 Elevation Runway
 Facility Ownership Acreage Distance from Runways
 (ft MSL) Length/Width (ft)
 HTO (miles)
East Hampton Public: Town of 10/28 4,255 x 100
 55 570 N/A
(HTO) East Hampton 16/34 2,060 x 75
 Private: Montauk
Montauk (MTP)* 7 40 23 6/24 3,246 x 75
 Airport Inc.
 1/19 5,100 x 150
Francis S. Public: County of
 66 1,451 26 6/24 9,002 x 150
Gabreski (FOK) Suffolk
 15/33 5,002 x 150
 Private:
Mattituck (21N) Mattituck 30 18 35 1/19 2,200 x 60
 Airport SD, LLC
Southampton Public: Village of
 5 0 17 H1 44 x 44
Heliport (87N) Southampton
* Montauk requires prior permission for helicopter and jet traffic.
Source: FAA Form 5010, Google Maps

Prior to the advent of the air traffic control system, aircraft operators separated themselves from other
aircraft and obstacles by visually identifying such impediments and altering course to avoid them. This
method is known as “see-and-avoid” and forms the basis of Visual Flight Rules (VFR) separation.
However, operations in clouds or during periods of limited visibility require Instrument Flight Rules (IFR)
separation, which uses different separation techniques, relying on air traffic control personnel, detailed
procedures, and supplemental equipment to ensure safe separation between aircraft and from terrain.
Such procedures include Coded Instrument Flight Procedures (CIFPs), which are charted and/or textual
descriptions of a course or route to be flown, minimum and/or maximum altitudes to be observed, and
similar procedural information that, when followed by pilots, facilitates separation of aircraft from other
aircraft and from terrain while operating with limited visibility and or in clouds.

 6
Data Collection and Processing
 Feasibility Study for the Diversion of Flight Operations at HTO

These procedures use satellite and ground-based navigational aids to provide lateral and sometimes
vertical guidance to a runway in the absence of adequate visibility for pilots to visually navigate to a
runway. Depending on the type of navigational aid used, IFPs have different usability limitations
associated with the cloud altitude (known as the ceiling), forward visibility, and aircraft speed.

We obtained the CIFPs for the diversion airfields and reviewed them to determine the feasibility of
landing at each airfield in weather conditions with limited visibility on a day-by-day basis.

Lastly, we estimated an approximate driving distance between East Hampton Airport and the diversion
airports using Google Maps.

2.4 Meteorological Data

HMMH obtained hourly meteorological data for East Hampton Airport, Gabreski Airport, Montauk
Airport, Groton Airport (GON), and Block Island Airport (BID) to characterize weather conditions at the
diversion airports. These datasets allowed us to estimate weather conditions for a specific operation if it
were to be diverted to one of these diversion airports on the same date and time as it originally
occurred at East Hampton. These estimations of weather conditions allowed us to determine if the
operation would have been able to occur at the diversion airport, given each airport’s capabilities and
facilities. Table 7 summarizes these weather data types and their uses.

 Table 7: Inventory of Weather Data Sources
 Data Source Data Type Used For
Integrated Surface Data NOAA National Hourly wind direction and Active runway
(FOK, HTO, MTP, BID, GON; Centers for speed determination, crosswind
2015, 2017, 2019, 2021) Environmental component estimation
 Information Hourly ceiling and cloud Determination of instrument
 cover status approach procedure
 selection
 Hourly visibility range Determination of instrument
 approach procedure
 selection

Southampton Heliport and Mattituck Airport do not have their own weather observation stations;
instead, pilots operating at these fields rely on weather data from Gabreski Airport and East Hampton
Airport to inform their decision-making. In accordance with this, we used the same data to estimate
weather conditions at Southampton and Mattituck. We compared wind speed and direction, ceiling, and
visibility data for Gabreski and East Hampton, selecting the more liberal value (e.g., lower wind speed,
smaller crosswind, and higher ceilings and visibilities) for the weather conditions at Southampton and
Mattituck. The more liberal weather conditions were chosen to provide a more conservative (e.g.,
higher) estimate of operations that could potentially occur at these airfields if East Hampton were to
restrict some or all its operations.

The historical weather data from Montauk only included wind speed and direction and did not include
ceiling or visibility data. To determine approximations for ceiling and visibility at Montauk, we used
historical data from Groton Airport, in CT, and Block Island Airport, in RI. As in the process for
Southampton and Mattituck, we used the more liberal value between the two airports.

 7
Data Collection and Processing
 Feasibility Study for the Diversion of Flight Operations at HTO

2.5 Other Data

In addition to a data-based assessment of the capability of operations to occur at the diversion airfields,
we also wanted to assess the likelihood that pilots and/or passengers would choose to potentially
operate out of one or more of the diversion airfields if East Hampton Airport was not available. Some of
the considerations included the location of the airfield, its services and facilities, and the purpose and/or
final destination of the trip. For the purpose of this study, services and facilities generally refers to
passenger pick-up/drop-off areas, passenger waiting areas, and transportation services, including rental
car facilities.

We obtained satellite photographical data from Google Maps, using them to estimate the area available
for potential aircraft parking, as well as drop-off/pick-up areas for passengers. These estimates allowed
us to assess the reasonableness of overnight and transient parking at each airfield. Additionally, we
were able to estimate the accessibility of each airfield based on its geographical location and distance to
city centers and to East Hampton Airport.

In May 2021, HR&A Advisors presented an economic impact analysis of the East Hampton Airport to the
Town of East Hampton. In this report, they stated that in 2019, the terminal destination of
approximately 60 percent of passengers arriving at the airport was the Town of East Hampton, while the
remaining 40 percent departed the area for Southampton and points farther west.7 We used this
information to provide a general assessment of how each diversion airfield would affect the passengers
remaining in East Hampton compared to those traveling farther west. This presentation did not
specifically address passengers departing the East Hampton area for more easterly locations.

7 East Hampton Airport Preliminary Economic Impact Analysis, HR&A Advisors, Inc. May 11, 2021.

 8
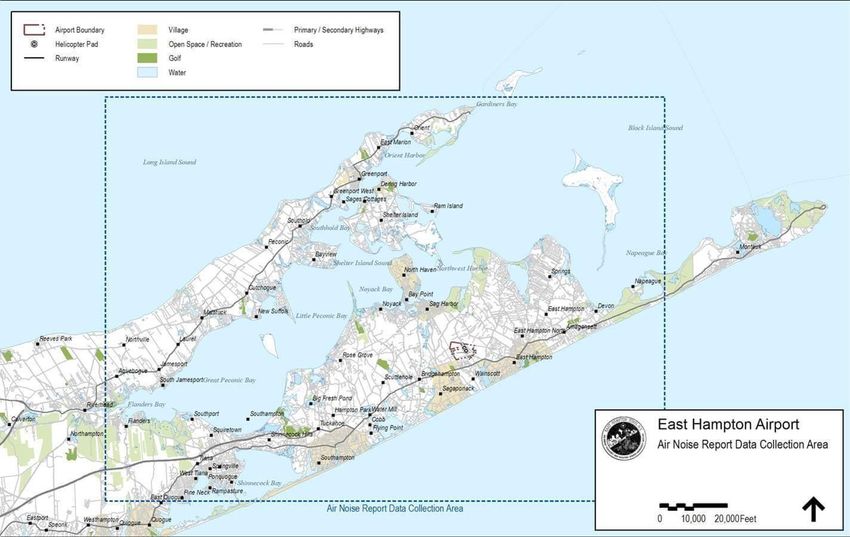
Analysis
 Feasibility Study for the Diversion of Flight Operations at HTO

3 Analysis
The purpose of this analysis is to estimate the number and types of aircraft operations that could
feasibly be diverted to Montauk Airport, Gabreski Airport, Southampton Heliport, and Mattituck Airport
if East Hampton Airport were to close or otherwise modify its aircraft operations, and to also identify
the reduction or change in operations that could occur if East Hampton Airport were to restrict certain
types of operations. This analysis provides a conservative (e.g., worst case) estimate of the number of
operations that might occur at each diversion airfield.

Figure 1 shows the approximate locations of East Hampton Airport in blue and the diversion airfields in
orange.

 Figure 1: East Hampton Airport and the Diversion Airfields
To accomplish this, we first reviewed East Hampton’s aircraft operations to define past and current
operational usage and demand at the airport. We then assessed the ability of the selected diversion
airfields to support these operations by reviewing and categorizing the airfields’ facilities and
characteristics against the flight operations categories. We then cross-referenced the operations against
the airfield capabilities to determine the number and type of operations originally occurring at East
Hampton that might feasibly operate at each airfield. Generally, this review defined the number and
types of operations that, as standalone operations, could reasonably be expected to occur at each
airfield based on the airfields’ limitations, restrictions, and characteristics.

Lastly, we considered the possible increase in operations and operation rate at each airfield that would
be required to support the total number of feasible operations and reviewed the possible effects that

 9
Analysis
 Feasibility Study for the Diversion of Flight Operations at HTO

the airfields’ locations and other factors might have on the likelihood that an operation would opt to use
that particular airfield in lieu of East Hampton.

The following sections discuss the data processing and analysis used to accomplish these objectives.

3.1 Airport and Airfield Restrictions

We first identified flight operations that would be able and/or allowed to operate at each diversion
airfield. Runway length, surface, and weight limits restrict the operations that could be diverted to each
airfield. Additionally, Montauk and Mattituck are privately owned, which allows them to place
restrictions on flight operations that occur. Table 8 summarizes these restrictions, and Sections 3.1.1
and 3.1.2 describe how we processed the data to identify the operations affected by these restrictions.

 Table 8: Airport and Airfield Restrictions for the Diversion Airfields
 Airport Ownership Restrictions
 Montauk (MTP) Private No touch and go operations
 No night operations
 Closed to helicopters between sunrise and sunset
 Closed to jets and helicopters except by prior permission
 Runway length (3,246 ft) limits aircraft to MTOW < 12,500 lbs.
 Gabreski (FOK) Public None
 Southampton Public Helicopter operations only
 Heliport (87N) Closed at night
 Mattituck (21N) Private No night operations
 No touch and go operations
 No training operations
 Runway length (2,200 ft) limits aircraft to MTOW < 12,500 lbs.
 Source: FAA Form 5010, AC 150/5325-4B

3.1.1 Runway length

Runway length requirements depend on the specific aircraft type, which are found in aircraft operating
handbooks, and whether the flight and pilot are operating as a general aviation, noncommercial flight, a
charter flight, or an air carrier flight. A detailed analysis of these requirements is beyond the scope of
this analysis. Instead, we used airport design standards to provide a generic estimation of aircraft that
could operate at each airfield. Runway length requirements were determined using the FAA Advisory
Circular (AC) 150/5325-4B, Runway Length Requirements for Airport Design. This AC provides guidelines
for the determination of recommended runway lengths based on airfield elevation, temperature, and
expected fleet mix.

According to this document, small aircraft8 with approach speeds of under 30 knots (kts) have a
recommended runway length of 300 feet (ft) for airports located at sea level and small aircraft with
approach speeds greater than or equal to 30 kts and less than 50 kts have a recommended runway
length of 800 ft at sea level. The four diversion airports are all located at approximately sea level, as

8As defined in AC 150/5325-4B, Runway Length Requirements for Airport Design, and elsewhere by the FAA, a small aircraft is
one whose maximum certificated takeoff weight (MTOW) is less than or equal to 12,500 pounds (lbs.).

 10
Analysis
 Feasibility Study for the Diversion of Flight Operations at HTO

noted in Table 6, so for small aircraft with these approach speeds, we used these runway length
estimates.

For small aircraft with approach speeds of 50 kts or more, AC 150/5325-4B provides guidelines on how
to approximate runway length based on aircraft seating capacity and the mean daily maximum
temperature during the hottest month of the year at an airport. For an airfield with an average
temperature of 75 degrees Fahrenheit and an elevation of approximately sea level, small aircraft with
fewer than ten passenger seats9 require a runway approximately 2,900 ft long. Small aircraft with ten or
more passenger seats require approximately 3,900 ft of runway. In addition to having elevations of
approximately sea level, all four airfields considered in this study have mean daily maximum
temperatures for the hottest month of approximately 75 degrees Fahrenheit.

For aircraft with a MTOW of more than 12,500 lbs. and less than 60,000 lbs., runway requirements are
between 4,550 ft and 4,950 ft for a sea-level airfield with a mean temperature of 75 degrees Fahrenheit.

Table 9 summarizes the aircraft by size and/or weight that, according to AC 150/5325-4B, could be
expected to operate at each of the potential diversion airports and at East Hampton Airport.
Southampton Heliport is not included since it only serves helicopter traffic and does not have or need a
runway per se, simply requiring a designated landing area or pad.

 Table 9: Runway Operation Eligibility Matrix for the Diversion Airfields
 MTOW ≤ 12,500 lb
 12,500 <
 Runway 30 ≤
 Airport Runway Approach < 10 ≥ 10 MTOW ≤
 Length (ft) Approach
 spd < 30 kt passengers passengers 60,000 lb
 spd < 50
 East 10/28 4,255 X X X X X
 Hampton
 16/34 2,060 X X
 (HTO)
 Montauk
 6/24 3,246 X X X
 (MTP)
 6/24 9,002 X X X X X
 Gabreski
 1/19 5,100 X X X X X
 (FOK)
 15/33 5,002 X X X X X
 Mattituck
 1/19 2,200 X X
 (21N)
 Source: FAA AC 150 5325-4B, FAA Form 5010

3.1.2 Operational restrictions

As privately-owned airports available for public use, Montauk Airport and Mattituck Airport can restrict
the type of aircraft and type of operations. Montauk does not allow night operations or touch and go
operations.10 Additionally, jet and helicopter operations are allowed by prior permission only. Mattituck

9 Passenger seats do not include pilot and co-pilot seats.

10A touch-and-go operation is when a pilot performs a landing at an airfield, then, without coming to a full stop, takes off again.
Touch and go operations are often conducted as part of flight training and proficiency flights.

 11
Analysis
 Feasibility Study for the Diversion of Flight Operations at HTO

does allow helicopter operations but not night or touch and go operations. As a heliport, Southampton
Heliport only allows helicopter operations. These restrictions are specified in Table 8.

Aircraft category (fixed-wing, rotary wing) and engine types (jet, turboprop, piston) were provided in the
flight operations data, and daytime/nighttime operations were identified using the process described in
Section 2.1.

We identified touch and go operations by calculating the time difference between operations for each
unique aircraft identifier (tail number or call sign). An operation pair where the first operation was an
arrival and the second a departure and where the time difference was three minutes or less was
considered a touch and go operation. Using these criteria, 6,180 operations in the entire data sample
were identified as possible touch and go operations.

3.1.3 Aircraft parking and services

The availability of aircraft ramp areas, used for parking and movement not associated with runway
operations, and other aircraft services could affect the operations that would occur at each of the
diversion airfields. The absence of adequate parking necessarily excludes some operations that would
require overnight or transient parking. Similarly, the lack of fuel, maintenance, and other services at all
airfields except for Gabreski Airport could disincentivize certain types of operations at those airfields.

As noted by the acreage provided in Table 6, Montauk and Mattituck Airports have limited space
available for aircraft parking, and Southampton Heliport has no space for parking. A review of satellite
imagery confirmed these assessments. From this review, we estimate that Montauk Airport could have
space for potentially up to 20 aircraft, though this number may be less depending on aircraft size and
airport policies and restrictions. Similarly, eight hangars are visible at Mattituck, though hangars are
usually reserved for aircraft based at an airport and are unavailable for transient aircraft. The area
around the hangars away from the runway could provide unpaved space for aircraft parking, though the
visual inspection could not confirm the extent to which this area is used for this purpose. Lastly, the
visual examination indicates that no parking spaces available at Southampton; its paved area consists
solely of the helipad.

Based on these reviews, we determined that any aircraft operations that require overnight or short-
term transient parking would not be feasible at Southampton or Mattituck. However, overnight and
transient parking at Montauk would be feasible but only for a small fraction of potential diversion
operations.

To identify operations that would require parking, we calculated the time difference between
operations for each unique aircraft identifier. Operation pairs where the first operation was an arrival
and the second a departure were evaluated for overnight parking, short-term parking, or long-term but
not overnight parking. Additionally, since Southampton Heliport cannot support more than one
helicopter at a time and any helicopter parking there would prevent other operations from occurring, it
received its own parking category. Table 10 describes the criteria for each parking classification.

 12
Analysis
 Feasibility Study for the Diversion of Flight Operations at HTO

 Table 10: Parking Analysis Criteria for the Diversion Airfields
 Parking Classification Time Difference for Arrival/Departure Operations Pair
 Touch and go < 3 minutes
 Southampton parking > 20 minutes
 Short-term parking between 1 and 3 hours
 Long-term but not overnight parking ≥ 3 hours but not overnight
 Overnight parking Date difference > 1 and time difference > 0

3.1.4 Airfield usage

Aside from this section, Sections 3.1 and 3.2 discuss factors that determine whether a flight operation
could, as a standalone operation, reasonably physically occur at a diversion airfield. These factors simply
assess if the operation meets criteria at each airfield and allows us to quantify the total number of
operations that could occur at an airfield. They do not address the feasibility of operations in aggregate.
In this section, we describe the method used in this analysis to provide a general estimate of the
possible impact on an airfield resulting from the operations that could feasibly be shifted to another
airfield from East Hampton Airport.

While we obtained detailed operational data for East Hampton Airport for 2015, 2017, 2019, and half of
2021, similar data were not obtained for the other airfields, and a capacity analysis for the diversion
airfields is beyond the scope of this effort. However, we did want to provide an assessment of the
effects of the possible additional operations on each airfield. To accomplish this, we first identified the
number of operations that could potentially occur at each airfield based on quantifiable airport, airfield,
and weather conditions as described in the rest of Section 3. We then identified the month(s) with the
greatest number of operations and calculated the number of daily and hourly operations that would be
required to support these additional operations.

Additionally, we used estimates of annual operations provided in the airports’ Form 5010s. We first
estimated the percent of operations that occurred during the peak month of operation in each year and
obtained an average of the operational percentage for that month. We then estimated the number of
operations for that peak month based on the Form 5010 data and used this estimate as a basis for
assessing the operational increase associated with the relocated East Hampton operations.

3.2 Weather Limitations

We calculated estimates of daily weather conditions at each airfield based on the data described in
Section 2.3. These data consisted of hourly records of temperature, pressure, wind direction and speed,
visibility, and ceiling measurements. For each day, we calculated the average daily value for each
available metric at East Hampton Airport, Gabreski Airport, Block Island Airport, and Groton Airport. As
noted in Section 2.3, weather conditions for Southampton Heliport and Mattituck Airport were
estimated from conditions at East Hampton and Gabreski Airports, and ceiling and visibility metrics for
Montauk Airport were estimated from the same metrics at Block Island and Groton Airports.

3.2.1 Weather conditions

To provide a high-level metric to identify daily weather conditions at each diversion field, we classified
each day according to the categorical outlook definitions provided in the FAA’s Aeronautical Information

 13
Analysis
 Feasibility Study for the Diversion of Flight Operations at HTO

Manual11 using the daily averages and estimates of ceiling and visibility at each airfield. These
classifications and their definitions are provided in Table 11.

 Table 11: Ceiling and Visibility Limitations for VFR and IFR Conditions12
 Categorical Outlook Ceiling (ft AGL) Logic Visibility (statute miles)
 Low Instrument Flight Rules (LIFR) < 500 OR 3,000 AND >5
 Source: FAA FAR/AIM Section 7-1-7

These classifications were used to identify operations that could be restricted at the diversion airfields
due to weather. Each day was identified as having Low IFR (LIFR), IFR, Marginal VFR (MVFR), or VFR
weather; the ceiling and visibility criteria listed in Table 11 were cross-referenced against the ceiling and
visibility minima for each airfield’s CIFPs. East Hampton, Gabreski, Montauk, and Southampton have
CIFPs that allow aircraft to land in reduced visibility and thus would be able to accommodate operations
in conditions of limited visibility; however, Mattituck has no such procedures. Though a limited number
of operations could occur at Mattituck under IFR conditions, for this analysis we assumed this airport
would only support operations under VFR weather conditions.

3.2.2 Wind limitations

We also approximated the minimum crosswind component at the diversion airports for each day. For
each runway, we subtracted the wind direction from the runway heading provided in Section 2.3 to
determine the crosswind angle, then selected the minimum angle from the absolute values of the
crosswind angles. We then calculated the crosswind speed using the formula

 = sin( ). Table 12 provides an example of this calculation.

 Table 12: Example Crosswind Estimation, MTP
 Wind Crosswind
 Wind Crosswind
 Date Speed (vw) RW6 RW24 Speed (vxw)
 Direction Angle (Θxw)
 (kts) (kts)
 1/13/2021 303.0 4.0 -241.0 -61.0 61.0 3.5
 1/14/2021 247.3 1.7 -185.3 -5.3 5.3 0.2
 1/15/2021 81.1 5.1 -19.1 160.9 19.1 1.7
 1/16/2021 162.7 8.3 -100.7 79.3 79.3 8.2

11FAA FAR/AIM Section 7-1-7, Categorical Outlooks. https://www.faraim.org/faa/aim/473/aim-473.html. Accessed August 31,
2021.

12The definitions and operating rules for VFR and IFR operations are complex and depend on airspace classification and aircraft
category. The information presented in this table assume Class D and E airspace.

 14
Analysis
 Feasibility Study for the Diversion of Flight Operations at HTO

The calculation ( ) = 0.2 = 0.2 13 was used to estimate the maximum crosswind
component for each fixed-wing aircraft. Although certain aircraft and/or operators may be able to
accept higher crosswind limitations, this estimation was used to provide a general formula for crosswind
limitations across all aircraft. In practice, several aerodynamic factors determine an aircraft’s maximum
demonstrated crosswind; however, this estimation provides an adequate proxy for this study.

We then compared the estimated daily crosswind at each airport against the estimated maximum
crosswind for each flight that occurred on that day. If the estimated crosswind exceeded the aircraft’s
maximum crosswind, that flight was excluded from consideration for diversion to that airport.

Since, as noted in Section 2.3, Mattituck Airport does not report weather and instead references the
weather stations at Gabreski, East Hampton, and Brookhaven, we calculated the crosswind component
for Mattituck using the wind direction and speed from both Gabreski and East Hampton. We then
selected the more liberal (e.g., weaker) crosswind estimate as the Mattituck crosswind estimate, again
to err towards a worst-case scenario with respect to diversion traffic volumes.

Since helicopters are not subject to crosswind limitations like fixed-wing aircraft are, we only looked at
the overall estimated wind speeds at each airfield to determine if any helicopter operations would be
restricted due to wind. At East Hampton Airport, the maximum daily average windspeed was
approximately 20 kts; values for this metric were similar at Gabreski (20.4 kts) and Montauk (18.8 kts).
Generally, windspeeds at Gabreski and Montauk were within six knots of the windspeeds at East
Hampton. Since all helicopter operations in this dataset occurred at East Hampton under these wind
conditions, and since the wind speeds recorded at Gabreski and Montauk and estimated at Montauk
and Southampton during the same period are similar to the windspeeds at East Hampton, we
determined that the wind conditions at the proposed diversion airfields would not restrict any
helicopter operations.

3.3 Operational Feasibility

The prior sections discussed the process used to determine if a specific operation could, as a standalone
operation, physically occur at each diversion airfield. Those sections focused on quantifiable data.
However, several non-quantifiable factors also could affect the likelihood that certain operations would
occur at a diversion airfield. These factors can apply to the flight operator or to the passenger.

Airport fees may incentivize one airport or airfield over another. Most of these facilities, aside from
Mattituck Airport, charge fees. East Hampton Airport charges landing fees based on MTOW; these fees
range from $20 to $700.14 Southampton also charges based on MTOW, with fees either $150 or $200.15
Gabreski Airport’s fees are based on weight, time of day, commercial/noncommercial, overnight, and
other factors.

Passengers’ destinations and the distance and time associated with reaching this destination may affect
whether a flight operation would occur at a specific diversion airfield. Though specific information
regarding passenger destinations and trip purposes were not available, HR&A’s economic impact

13FAA AC 23-8C, Flight Test Guide for Certification of Part 23 Airplanes.
https://www.faa.gov/documentlibrary/media/advisory_circular/ac_23-8c.pdf. Accessed August 28, 2021.

14 http://ehamptonny.gov/DocumentCenter/View/1545/Landing-Fee-Schedule-PDF?bidId=

15 FAA Form 5010, Southampton Heliport, FAA Site 16205.1*H. Accessed August 25, 2021.

 15
Analysis
 Feasibility Study for the Diversion of Flight Operations at HTO

analysis stated that in 2019, 60 percent of East Hampton Airport passengers traveled to the Town of
East Hampton or otherwise remained near East Hampton, while the other 40 percent continued to
Southampton and points west.

Availability of airport facilities and other services could outweigh proximity to the destination.
Availability of rental car and other transportation services may also influence whether a trip would occur
at a diversion airfield. As the Hamptons are a vacation and tourist destination, we would expect that
passengers would require car rental facilities, access to public transportation (including rideshares), or
ground vehicle parking. In the absence of these facilities, some subset of operations may not occur at a
given location. Similarly, if adequate waiting areas, drop-off/pick-up locations, food and hygiene
facilities, and other amenities are not available, some passengers may opt to forego their trip or utilize
alternate means of transportation.

 16
Results
 Feasibility Study for the Diversion of Flight Operations at HTO

4 Results
This section first discusses the dataset with respect to operations at East Hampton Airport, defining the
number, category, and engine types of the operations over the years, including identification of the top
20 aircraft types at East Hampton. We also discuss the historical monthly operational trends seen during
these years.

After characterizing the operations in the context of East Hampton Airport, we then assess the full
dataset to determine which of the East Hampton operations could feasibly be expected to operate at
each of the diversion airports. For the quantitative analyses, we treat each operation as essentially a
standalone operation, asking whether this particular operation, in the absence of any other operations,
could occur at each diversion airport. This quantitative analysis does not look at all operations in
aggregate, but instead provides a total count of all operations that, by themselves, could reasonably
operate at an airport given all the constraints and restrictions associated with that airport.

Following the quantitative analysis, we then provide a general discussion of the increase in operations
that would be required to support the number of operations identified from the quantitative analysis.
Though this discussion does not specifically discuss capacity numbers, it provides a general idea of how
much operations would increase at that airport if all feasible East Hampton operations were to be
conducted at the diversion airport instead. A brief discussion of other factors, such as airport facilities
and services and airfield location, is provided to further identify factors influencing a pilot’s or
passenger’s choice to make or abandon a trip if it could not occur at East Hampton.

Finally, after identifying several restrictions and limitations at the diversion airfields, we identify some
potential restrictions and limitations that might be feasible to implement at East Hampton. These
limitations were chosen for several reasons, but a key reason for selecting these was that, as discussed
in the sections for each diversion airfield, the operations that would be eliminated or reduced at East
Hampton could reasonably be expected to be absorbed by the other airfields.

4.1 Historical Flight Operations at East Hampton Airport

This analysis used flight operations data from East Hampton Airport for calendar years 2015, 2017, and
2019, as well as the first half of calendar year 2021. This data sample contained 98,373 flight operations
as indicated in Table 1, distributed among 351 distinct aircraft types. Fixed-wing piston aircraft
represent the majority of operations in this sample, ranging between 35 and 44 percent of annual
operations, followed by helicopters, which represent 24 to 30 percent of operations. Turboprop
operations comprise 12 to 20 percent of operations and jets represent 14 to 20 percent. Table 13
provides the distribution of operations by engine type and year.

 17
Results
 Feasibility Study for the Diversion of Flight Operations at HTO

 Table 13: Historical Operations at East Hampton Airport by Engine Type
 Engine Type 2015 2017 2019 2021 (Partial) Total
Piston 10,217 39.3% 9,977 35.2% 11,228 35.7% 5,498 43.7% 36,920 37.5%
Turboprop 5,147 19.8% 5,227 18.5% 6,140 19.5% 1,606 12.8% 18,120 18.4%
Jet 3,832 14.7% 4,459 15.8% 4,505 14.3% 2,415 19.2% 15,211 15.5%
Helicopter 6,706 25.8% 8,539 30.2% 9,577 30.4% 3,060 24.3% 27,882 28.3%
Unknown 108 0.4% 108 0.4% 14 0.0% 10 0.1% 240 0.2%
Total 26,010 100% 28,310 100% 31,464 100% 12,589 100% 98,373 100%

Of the 351 aircraft types included in this data sample, 20 of them conducted nearly 70 percent of all
operations, with the top ten covering approximately 50 percent of all operations. Table 14 shows these
top 20 aircraft, their engine types, operational counts, and overall operational percentages for the data
sample.

 Table 14: Top Twenty Aircraft Operations at East Hampton Airport
 Aircraft 2021 Total
 Engine Type 2015 2017 2019 Total
 Type (Partial) Percent
S76 Helicopter 2,632 3,521 3,889 1,443 11,485 11.7%
C208 Turboprop 2,728 2,856 3,455 643 9,682 9.8%
C172 Piston 1,219 1,438 2,612 1,563 6,832 6.9%
B407 Helicopter 974 1,319 2,255 783 5,331 5.4%
SR22 Piston 1,135 1,058 1,676 564 4,433 4.5%
PC12 Turboprop 906 1,031 1,295 519 3,751 3.8%
P28A Piston 719 907 1,128 556 3,310 3.4%
C182 Piston 793 733 749 280 2,555 2.6%
C680 Jet 496 583 764 442 2,285 2.3%
PA34 Piston 481 640 664 205 1,990 2.0%
BE58 Piston 646 667 442 161 1,916 1.9%
BE36 Piston 635 750 343 145 1,873 1.9%
E55P Jet 318 465 694 318 1,795 1.8%
AS55 Helicopter 511 468 564 214 1,757 1.8%
B430 Helicopter 778 482 390 4 1,654 1.7%
CL30 Jet 321 442 500 332 1,595 1.6%
C56X Jet 472 472 432 153 1,529 1.6%
A139 Helicopter 205 445 536 313 1,499 1.5%
B350 Turboprop 469 441 462 122 1,494 1.5%
AS50 Helicopter 535 630 138 18 1,321 1.3%
Total 16,973 19,348 22,988 8,778 68,087
Total Percent 65.3% 68.3% 73.1% 69.7% 69.2%

Over the years, between 77 and 80 percent of East Hampton Airport’s annual operations occurred
during the May to September period, with operations per month peaking in July and August. As defined
and discussed in other reports on East Hampton Airport, the summer season begins the weekend before
July 4th and ends after Labor Day, while the shoulder season covers all of September and October. Figure
2 illustrates the cyclical nature of the operations over the study years.

 18
Results
 Feasibility Study for the Diversion of Flight Operations at HTO

 9000

 8000

 7000
 Operations Count

 6000

 5000 2015

 4000 2017
 2019
 3000
 2021
 2000

 1000

 0
 Jan Feb Mar Apr May Jun Jul Aug Sept Oct Nov Dec
 Month

 Figure 2: Historical Operational Peaks at East Hampton Airport
 Source: VNOMS

The information presented in this section provides the basis for various assumptions and estimates that
we make later in this report; for example, Figure 2 allows us to identify the historical peak traffic months
and to estimate the percent of operations that occur during these months. These data also provide
insight into the operational character of the airport, allowing us to predict what types of modifications
are likely to be most impactful for East Hampton.

4.2 Montauk Airport (MTP)

Montauk Airport, privately owned by Montauk Airport Inc., is a public-use airport approximately three
miles northeast of Montauk. It is located on 40 acres and has one runway that is 3,246 ft long and 75 ft
wide. The owner requires that jet and helicopter operations obtain prior permission to operate at the
airport. Satellite photos of the airport show limited aircraft parking; a visual inspection estimated that
under 20 aircraft could potentially park on the available non-movement area. Additionally, the airport’s
Form 5010 states that only four aircraft are based at the field.

As a privately-owned airport, Montauk’s owner chooses to prohibit touch and go and nighttime
operations; neither type is allowed at the airport. Additionally, the available runway length limits the
type of operations that can occur at the airport. As indicated in Table 8, per AC 150/5325-4B, Montauk’s
runway length generally allows for aircraft with MTOW less than 12,500 lbs. and fewer than 10
passengers. Since the limitations in AC 150/53525-4B focus on airport design and do not include a
detailed discussion of aircraft operators and their runway requirements and limitations, we also
reviewed aircraft with MTOW greater than or equal to 12,500 lbs. and 10 or more passengers to
determine if any of them could potentially operate at Montauk. This review indicated that the King Air
Model 100 and the Britten-Norman BN-2 Islander’s takeoff distances would likely allow them to operate
at the airport.

 19
Results
 Feasibility Study for the Diversion of Flight Operations at HTO

Montauk has two Instrument Approach Procedures (IAPs); the RNAV16 GPS to Runway 6 requires a
ceiling of 540 ft or higher, and the RNAV GPS to Runway 24 requires a ceiling of at least 520 ft. Both IAPs
specify one mile visibility for aircraft with approach speeds of 120 kts or less and 1.5 miles visibility for
aircraft with higher approach speeds. Given these requirements, IFR operations could occur at this
airfield. However, as LIFR conditions involve ceilings of less than 500 ft and visibility of less than one
mile, neither could be used in LIFR.

We also identified operations where estimated crosswinds exceeded estimated aircraft crosswind
capabilities. We used the estimated daily crosswind calculations for Montauk for each day and
compared them to the estimated maximum crosswind limits for the aircraft operating at the airport that
day. If the Montauk crosswind estimate was greater than an aircraft’s crosswind limitation, we assumed
that such an operation could not occur at Montauk.

With all these restrictions in place, a total of 55,644 operations would be eligible to occur at Montauk,
with an average annual operations count of 15,898. In 2015, 13,290 operations would have been able to
operate at the airport; 17,027 operations could have occurred in 2017 and 18,429 in 2019. Through the
end of June 2021, 6,898 East Hampton operations could have occurred at Montauk.

Table 15 summarizes the types and number of operations that meet the above criteria.

 Table 15: Operational Counts for Feasible East Hampton Operations at Montauk Airport
 Year Piston and Turboprop Jet operations Helicopter Total
 2015 8,100 252 4,938 13,290
 2017 9,114 356 7,557 17,027
 2019 9,858 361 8,210 18,429
 2021 (Partial) 4,185 127 2,586 6,898
 Total 31,257 1,096 23,291 55,644
 Average 8,931 313 6,655 15,898

The airport also limits jet and helicopter operations; it is closed to helicopter operations between sunset
and sunrise and prior permission is required for jet and daytime helicopter operations. The
sunrise/sunset restriction is accounted for under the daytime-only operations restriction already
applied. However, as shown in Table 15, on average, 313 jet operations and 6,655 helicopter operations
annually could potentially shift to Montauk and thus would require prior permission to do so.

For this part of the analysis, we reviewed the distribution of aircraft engine types at Montauk for the
analysis years as provided by the FAA’s Traffic Flow Management System Counts (TFMSC)17 data for the
years cited in this study. The TFMSC data include flights that file flight plans with the FAA and/or are
tracked by radar.

According to the available data, during these years, jets represent less than 0.5% of existing operations
at the airport. Similarly, helicopters represent approximately 4 percent of existing operations. Though

16 Area navigation, or RNAV, procedures allow aircraft to operate on any flight path within a network of ground-based or space-
based navigational aids, rather than navigating specifically between land-based navigational aids. RNAV not only allows for
increased accuracy and precision in identifying aircraft position when compared to land-based navigational aids, but also allows
the use of routes that use space-based navigation points in addition to land-based navigational aids, which provides greater
flexibility and efficiency in flight routing.

17 FAA Traffic Flow Management Counts for Airports. https://aspm.faa.gov/tfms/sys/Airport.asp. Accessed August 2021.

 20
You can also read


