An Interactive Dashboard Using a Virtual Assistant for Visualizing Smart Manufacturing
←
→
Page content transcription
If your browser does not render page correctly, please read the page content below
Hindawi
Mobile Information Systems
Volume 2021, Article ID 5578239, 9 pages
https://doi.org/10.1155/2021/5578239

Research Article
An Interactive Dashboard Using a Virtual Assistant for Visualizing
Smart Manufacturing

          Jung-Sing Jwo,1,2 Ching-Sheng Lin ,1 and Cheng-Hsiung Lee1
          1
              Master Program of Digital Innovation, Tunghai University, Taichung 40704, Taiwan
          2
              Department of Computer Science, Tunghai University, Taichung 40704, Taiwan

          Correspondence should be addressed to Ching-Sheng Lin; cslin612@thu.edu.tw

          Received 19 February 2021; Revised 5 April 2021; Accepted 21 April 2021; Published 3 May 2021

          Academic Editor: Emmanuel O. C. Mkpojiogu

          Copyright © 2021 Jung-Sing Jwo et al. This is an open access article distributed under the Creative Commons Attribution License,
          which permits unrestricted use, distribution, and reproduction in any medium, provided the original work is properly cited.
          In the era of Industry 4.0, manufacturing sites are becoming more sophisticated and connected with the aid of Information
          Technology (IT) and Industrial Internet of Things (IIoT) infrastructure. What makes a smart manufacturing enterprise as opposed
          to a traditional one is the ability to solve existing problems and predict issues to fix them before they occur while creating
          advantaged value. Dashboards, assisting decision-makers in business markets, can organize data from machines, sensors, and
          workers into a real-time visual representation. They provide a quick overview of how your entire business is operating and where
          you stand in relation to the key performance indicators for supporting the development toward more resource-efficient and
          sustainable processes. However, if users need more information related to the indicators shown on the dashboard, current
          approaches mainly rely on human effort to search and retrieve the information. The lack of interaction between the dashboard and
          users often results in inconvenient operations and limits the usage of the tool, especially in the manufacturing industry. In this
          study, an interaction design is developed to resolve the issue. The proposed dashboard is developed by a three-layer structure
          including data layer, processing layer, and presentation layer. A virtual assistant is introduced to play the role of a mediator
          between the dashboard and the user. It provides users with a natural language interface to communicate, directly interacts with the
          dashboard on users’ behalf, and actively reminds relevant personnel to expedite data collection. Compared with the traditional
          human-machine interface, the adoption of this lightweight and easy-to-use design can not only create a frictionless and intuitive
          experience but also ensure that data is displayed in a timely manner.

1. Introduction                                                         what’s going on to ensure the entire business is operating
                                                                        efficiently, comprehensive information provision on the
The manufacturing industry faces increasingly immense                   shop floor is necessary.
challenges in a dynamic and highly competitive global                       According to the definition [3], “a dashboard is a single-
marketplace [1]. The growth of data is exceeding the capacity           screen display that shows this important information about a
of traditional approaches to accommodate. For example, in a             company so that the whole situation, for example, in a factory
Consumer Packaged Goods company, one product line for                   or on a production line, can be quickly understood.” The
producing a personal care product is able to generate 5000              dashboard concept is not something new in business and has
data samples every 33 milliseconds, resulting in 152,000                been developed in the high-tech industry for decades to
samples per second or four trillion (i.e., 4 Tera) samples per          analyze and display key performance indicators (KPIs).
year [2]. This fact has introduced the industrial big data              Dashboards are able to be customized in order to meet the
epoch and the question becomes how do we handle these                   specific requirements for different purposes and across
data sources and convert the results to usable formats? Since           different industries. However, in the manufacturing in-
operators could monitor the status of the process for                   dustry, it is only recently that the gathering and analysis of
reacting to the rising issues and leadership has to see exactly         data from different sources are becoming more available.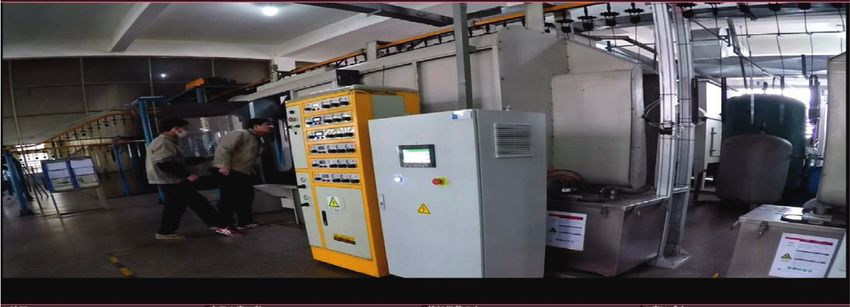
2                                                                                                 Mobile Information Systems

Subsequently, the desire to turn data into valuable insights      this paper. The proposed design and system architecture are
and action makes manufacturing dashboards increasingly            described in Section 3. Example scenarios and the imple-
attractive, even in small and medium-sized enterprises            mentation are discussed in Section 4. Section 5 presents
(SMEs). In general, dashboards have a number of advantages        conclusions and summarizes future research directions.
which include a visual display of key information, real-time
information display, and customization and personalization        2. Related Work
[4–6].
    In the manufacturing sites, there are two main challenges     Dashboards in this paper are the main interface between the
in the usage of dashboards. First, the interaction with the       backend systems and users. They, first appearing in the early
dashboard generally means viewing the visualization results       1990s and having been of interest to researchers, provide a
generated from the data. Any other requests for the dash-         means of summarizing important information and visual-
board may need to use a touchscreen or a mouse to control         izing with graphical components such as charts, graphs,
[7]. Furthermore, if the user has questions about the content     diagrams, and maps [9]. From the perspective of design
shown on the dashboard and needs more detailed infor-             philosophy, there is a visual genre of dashboards and a
mation of a specific indicator, it may need an assistant or a      functional genre. In general, the visual genre represents data
technician to help execute tasks. These will cause inconve-       and information by a tiled layout with simple graphs and
nience and require extra human involvement. Second, data          numbers, whereas the functional genre involves an inter-
availability and integrity is another issue to be considered      active display to enable real-time monitoring and support
[8]. For example, due to its special culture, operators often     infographic elements or narrative visualizations [10].
tend to input data altogether until their duties are complete         Dashboards were mainly developed for business man-
in order to save more time. Often, this could lead to missing     agement and decision support but gradually have been
values and result in inaccurate visualizations. Our research      employed to resolve the needs for various domains and
questions for this study are as follows.                          purposes. As modern cities are increasing in multiple di-
                                                                  mensions (e.g., population, geographical size, and economic
     RQ1: How to develop an effective and intuitive in-
                                                                  activities), it is important to provide real-time awareness
     teraction method for users to communicate with the
                                                                  applications with the incorporation of sensor data and
     dashboards to reduce human efforts and burden?
                                                                  network infrastructure. Urban dashboards are used to vi-
     RQ2: How can the data collection process be improved         sualize the information of the city’s current state and offer
     in order to provide more real-time data for the              communication between city operators and citizens [6, 9].
     dashboards?                                                  The health-related issue is a major concern nowadays.
    In this paper, a virtual assistant (VA) is proposed to play   COVID-19 is the latest threat which becomes the major
the role of a mediator between the dashboard and the user.        health concern and changes the behavior of human, business
The VA provides a natural language interface for users to         and, most importantly, the way of life. The adaptation of
communicate with the dashboard. The user could directly           dashboards to track COVID-19 makes the information more
ask the VA to perform some operations on the dashboard,           accessible to the public for providing greater clarity and to
such as switching to the view of “the real-time equipment         the decision-makers for monitoring health surveillance
status.” Moreover, it is able to receive commands from users      [11, 12]. In the manufacturing industry, the rapid devel-
about the information inquiry and then drill down into the        opment of the Internet of Things (IoT) has produced a
data in response to the input question. To resolve the missing    massive volume of data. Although dashboards are able to
data issue, the VA could proactively contact the relevant         visualize the business performance information, research of
personnel to remind them to enter data on humans’ behalf.         what information should be on dashboards is less discussed.
The contribution of this paper is twofold:                        Tokola et al. [4] conducted a comprehensive survey to in-
                                                                  vestigate the preferred KPIs and usage on different hierarchy
    (1) A human-centered design methodology using a VA            levels (workers, managers, and executives). Based on the
        is described. As the VA is easily accessible, employees   feedback from the survey, three manufacturing dashboards
        in the manufacturing industry are capable of in-          are designed, respectively: an operational dashboard for
        stalling and using it to interact with the dashboard      workers, a tactical dashboard for managers, and a strategy
        for the information inquiry without requiring a steep     dashboard for executives. Although dashboards have been
        learning curve.                                           designed for a range of stakeholders to support insight into
    (2) Instead of relying on human labor to deal with the        learning data, the research of interaction design on the
        data collection activities, the VA plays an active role   dashboard still needs to be addressed.
        in making requests to related personnel when                  The VA is a mediator between the dashboard and the
        missing data are found. In this way, even SMEs can        user in this study. Due to the increasing prevalence of
        save time and reduce the human cost to guarantee          smartphones, the VA is widely involved in human daily life
        the data quality and gradually move toward smart          ranging from scheduling wake-up calls to managing ap-
        manufacturing.                                            pointments. It is an intelligent agent with a natural language
                                                                  interface to execute tasks or services for users. Natural
    The remainder of this paper is organized as follows.          language processing is the key technique of the VA, and
Section 2 reviews advanced techniques related to the work of      there is a need to leverage its classical components pipelines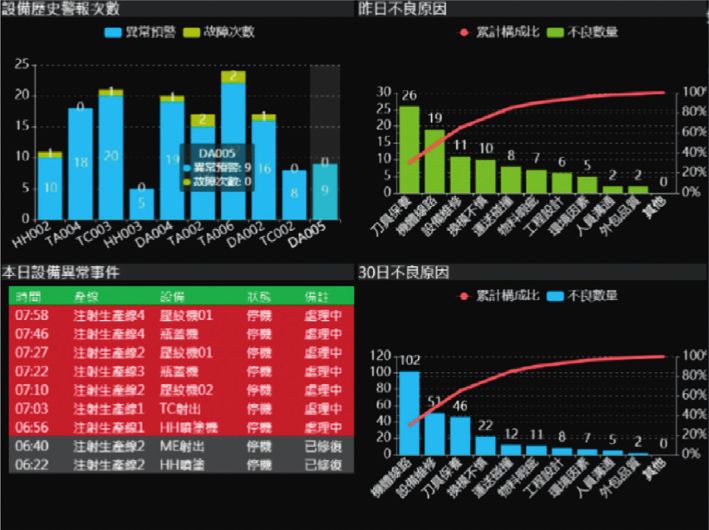
Mobile Information Systems                                                                                                    3

such as automatic speech recognition (ASR), natural lan-          enhance the interaction between users and the dashboard
guage understanding (NLU), and natural language gener-            and give users a more natural interface to obtain insights
ation (NLG) [13, 14]. ASR is the process of translating           while driving the data collection in a novel and productive
human speech into texts. NLU aims at recognizing the intent       way with the adoption of the virtual assistant. In the fol-
of user utterances by performing text preprocessing and           lowing subsections, we will describe more details about the
analyzing semantics. Subsequently, once the task of the given     architecture, components, and workflow of each module.
intent has been executed and the answer of the user inquiry
is obtained, NLG will produce meaningful context in re-
sponse to the user. In the early stages, these three research     3.1. Dashboard. The proposed dashboard architecture (top
areas generally focus on feature based approaches and re-         dashed rectangle in Figure 1) using a bottom-up design
cently have shifted to deep neural network methods with           approach consists of three layers: (1) data layer, (2) pro-
growing interest in models which are trainable in an end-to-      cessing layer, and (3) presentation layer. The data layer
end manner [15–17].                                               aggregates data from different sources and is a crucial re-
    Because of the accessibility and ease of use, more and        quirement for a dashboard to function. The processing layer
more organizations have launched VAs for business and             analyzes the data acquired from the data layer and prepares
professional needs. In order to integrate machines and            for the visualization. The presentation layer displays the
devices into the existing manufacturing IT systems, the           important indicators for users and reflects the results of user
concept of Manufacturing Integration Assistant (MIALinx)          queries.
is proposed to address the issue [18]. It provides a light-            As data is the main factor in creating information, data
weight solution to simplify the integration procedure by          layer plays a fundamental role in the dashboard architecture.
reusable “IF-THEN” rules which are defined by domain               It is responsible for providing large volumes of data to be
experts for the industry 4.0 environment. In the health care      processed for the visualization. In the manufacturing en-
field, many AI applications have been adopted to improve           vironment, we categorize the data sources into two types
medical services and the VA is no exception. Based on the         which are real-time data and historical data. During the
survey to know how physician time is spent, physicians            manufacturing process, there is a large amount of real-time
spend about half of the office time dealing with electronic         data generated and needed to be properly stored. Various
health record (EHR) but less than one-third of clinical face      IoT devices such as Radio Frequency Identification (RFID)
time engaging with patients [19]. Several virtual medical         and smart sensors are used for collecting data in real-time
assistants such as Nuance [20] and Robin Healthcare [21] are      [23]. RFID technology has been generally applied in
proposed to facilitate and automate the process of clinical       manufacturing shop floors to facilitate data capture and
documents. A Medical Instructed Real-time Assistant               identification automatically. Smart sensors are an integral
(MIRA) is introduced to diagnose a disease by listening to        part of many manufacturing applications to help collect data
the users’ complaints and refer them to an appropriate            and monitor the manufacturing process about sound,
medical specialist nearby as a final recommendation [22].          temperature, vibration, pressure, and operational status, etc.
Although the VA has been employed in firms, its application        Meanwhile, historical data are stored in the database and
in the interaction design and data collection still lacks study   information systems such as Enterprise Resource Planning
and needs to be researched in detail.                             (ERP), Manufacturing Execution Systems (MES), and
                                                                  Supply Chain Management (SCM) [24]. These legacy sys-
3. System Design and Architecture                                 tems make data exchange easier within the organization and
                                                                  possess a variety of data that could be analyzed for failure
Since human is the most valuable asset in the manufacturing       prediction, quality monitoring, and shop-floor production
industry, it is urgent to consider human operations an in-        management.
tegral part of the manufacturing process and take into ac-             While data are collected and stored in the data layer,
count the human-in-the-loop for the interaction design.           other specific procedures are required to extract the data and
Based on this design principle, we employ the virtual as-         generate suitable representations for the visualization. The
sistant as a means to aid interaction between humans and          processing layer is the middle layer of the three-layer ar-
dashboards and also accelerate the data collection. The           chitecture to connect the data layer and the presentation
proposed architecture is presented in Figure 1, consisting of     layer. For the structured data from manufacturing infor-
two components, namely, the dashboard module and the              mation systems like ERP, MES, and CRM, it needs to define
virtual module. The dashboard module, designed by a three-        the way for an external program to interact with these
layer structure, controls the visualization task where the data   systems. An Application Program Interface (API) is the
layer is responsible for the data exchange, the processing        middleman between the system and a program to control the
layer focuses on the data organization and the presentation       data to be requested and returned. In addition to data stored
layer governs the display of key information. The virtual         in information systems, the manufacturing industry would
assistant module primarily handles the requests from users,       collect large amounts of data from sensors and store it in the
manipulates the display of the dashboard, and contacts the        database. As real-time data are frequently updated, pre-
relative personnel for data input. The user sits in between the   processing is an important step to save time and effort. Once
two modules, thereby managing the data flow between the            the data are ready, we process and analyze them to extract
two ends. The ultimate goal of the proposed work is to            valuable information for the key indicators. Then, the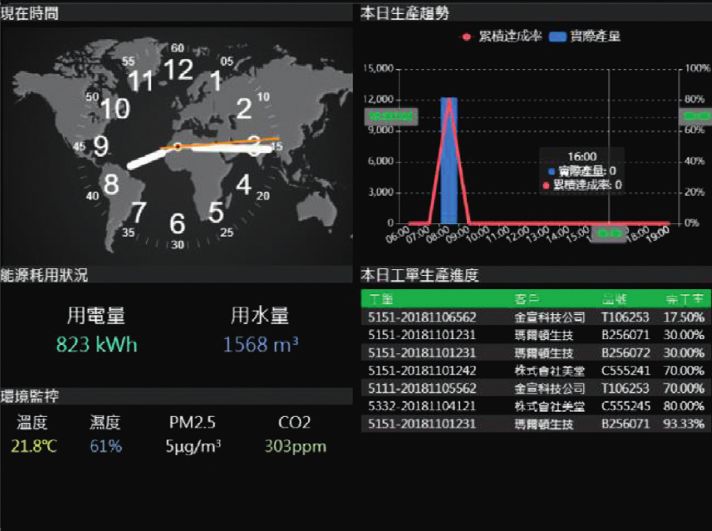
4                                                                                                                  Mobile Information Systems

                                                      Presentation layer:
                                                      Display the KPIs and reflect the results of
                                                      user queries.

                                                       Processing layer:
                                                       Analyze the data acquired from the data
                                                       layer and prepare for the visualization.

                                                         Data layer:
                                                         Aggregate data from different sources.

                             A new dialogue
                                                                     N
                              Y                A new
                                              dialogue
                                              session?

                                      NLG:                                                  SUI:
                                         (i) Language generation                             (i) Speech input
                                        (ii) Text-to-speech                                 (ii) Speech recognition

                                      DM:
                                                                                            NLU:
                                         (i) State tracking
                                                                                             (i) Utterance analysis
                                        (ii) Action execution
                                                                                            (ii) Intent identification
                                       (iii) Representative output

Figure 1: The system architecture of our approach where the top dashed rectangle is the dashboard module and the bottom dashed rectangle
is the virtual assistant module.

presentation layer and the VA have direct access to these                  layout should be intuitive and self-explanatory. It is,
analytics data through APIs.                                               therefore, imperative for design experts and users to co-
    Data visualization is an aspect to model the core un-                  operate with each other to achieve agreement on appearance
derstanding of the data and provides an overview of selected               and presentation standards before the implementation.
KPIs status for users with real-time monitoring. The pre-                  Visual components for conveying important information
sentation layer aims at mapping processed information to a                 contain traditional graphs (such as line graphs, bar charts,
visual representation enabling the management of industrial                pie charts, and histograms, etc.), tables, images (pictures and
production. Identifying important and appropriate KPIs                     videos), and diagrams (such as trees, graphs, networks) [25].
that should be used in the dashboard is crucial to the success             Colors and geometric symbols could be used to indicate the
of the technology. For those indicators and information                    number, amount, and statistics, demonstrating the severity
which are not suitable for display, other tools, such as the               of the problems or the progress of execution [26].
VA, are required to offer further inquiries. Moreover,
flexible usage of the user interface is necessary for the in-
teraction and we reserve a panel that is able to show the                  3.2. Virtual Assistant. The proposed VA is designed to re-
corresponding content in response to users’ requests. Since                ceive commands from users, execute the corresponding
the target users of the dashboard are generally without                    actions, and interact with the dashboard and the related
strong information technology professionals, the design and                personnel. The architecture of this part contains four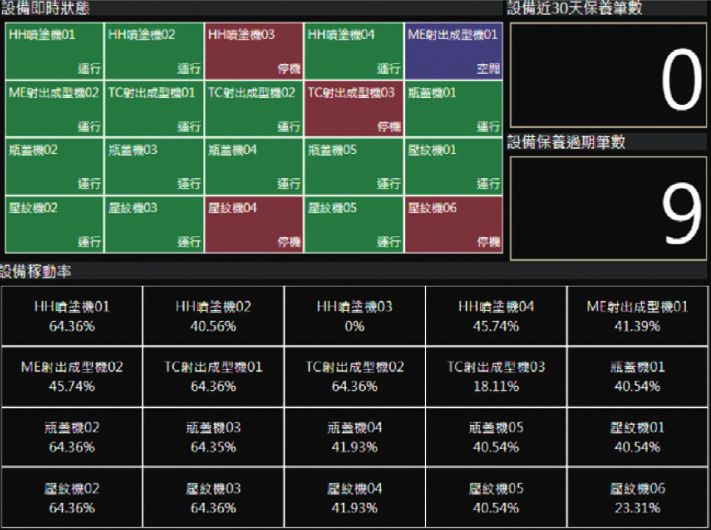
Mobile Information Systems 5
components which are speech user interface, natural lan- approaches to predict sentence meaning and extract relevant
guage understanding, dialogue management, and natural detailed information. We train the LUIS model for the NLU
language generation (bottom dashed rectangle in Figure 1). module, mainly for the intent prediction.
The speech user interface (SUI) module is becoming the
primary way for users to control a machine and its backend
assistant. Because of the rising popularity of smartphones, 4.2. Result. The manufacturing-based dashboard has a long
we develop our VA as an application and use SUI as the main and narrow shape with resolution 8192 × 768 and contains
input channel. The speech recognition engine, which sup- seven views as shown in Figure 2. Our design concept is to
ports natural communication, automatically transforms place similar indices closer and arrange the interactive region
user’s voice input into text format. The natural language in the central area. For further discussion of each view, we
understanding (NLU) module identifies the intent of the decompose the dashboard into seven views from left to the
user’s input by mapping the utterance to a predefined class. right in Figure 2 and demonstrate in Figure 3. The 1st
The dialogue management (DM) module is responsible for (Figure 3(a)) is about the indices of equipment which include
conversation understanding, state tracking, and output the real-time equipment status, availability of the equipment,
generation. This module initially assigns an identifier for number of equipment maintenance past the due date, and
each dialogue. For each turn in a dialogue, it estimates the number of equipment maintenance in the past 30 days.
user’s goal, maintains the dialogue state, takes the corre- Hereafter, the index arrangement of each view is from the top
sponding action to satisfy the user’s request, and generates left, counterclockwise. Tables are presented to track the de-
the relevant response as an input for the natural language tailed status of the equipment and counter tiles are used to
generation (NLG). Our action types include calling an API indicate the amount of equipment maintenance. The 2nd
to retrieve data/information, interacting with the dashboard (Figure 3(b)) is related to the abnormal data of the equipment
to change the content and initializing a new dialogue to for users to monitor the equipment health and review the
communicate with the other user for the purpose of data historical situations. There are four indices in this view, a
collection. While viewing the dashboard, users may want to number of alarms for each device, today’s abnormal events,
drill down into further details. We implement APIs to fulfill abnormal reasons in the past 30 days, and yesterday’s ab-
the functions and provide access to available resources. To normal reasons. Bar Charts are useful for making compari-
directly control the content of the dashboard, we also le- sons between abnormal reasons and displaying the historical
verage APIs to achieve objectives, as discussed in Section 3.1. abnormal events of each device. The 3rd view (Figure 3(c)) is
A common situation in manufacturing is incomplete data. concerning the production progress consisting of the de-
Once the user asks a question where the answer is not fective rate in the past three months, daily production this
unavailable, the VA will start a new dialogue session to month, today’s actual production, and actual production of
proactively reach out to the relevant individual, who is this month. By observing these components, users are able to
responsible for the answer, to give a reminder. This is a very know the up-to-date production data and the quality infor-
important step toward data-driven smart manufacturing mation. The 4th (Figure 3(d)) placed in the middle of the
[27]. Therefore, the VA is playing not only an information- dashboard is the primary view and is twice larger than other
providing role but also an information-collecting role. The views. It is essentially dedicated to displaying the interaction
NLG module is in charge of generating natural language text result between users and the dashboard such as showing the
given by the response information from the DM module. In live scenes of the shop floor and enlarging the “yesterday’s
this study, we employ the template-based approach to abnormal reasons.” In this process, the user gives commands
produce candidate sentences that are finally fed to the text- to the VA which invokes the API to show the result on the
to-speech engine to make a voice response to the user. dashboard. The 5th view (Figure 3(e)) contains the current
time, energy consumption status, environment monitoring,
4. Implementation and Results today’s rate of work-order completion, and today’s detailed
production. This view is introduced to monitor environment
4.1. Development. The case study of the proposed approach and utility consumption and understand the work-order
is implemented for a machinery manufacturing company as performance. The 6th view (Figure 3(f)) relies on speed-
an illustration. The web front end of the dashboard is de- ometers to highlight the equipment and production evalua-
veloped by AngularJS and other standard technologies (i.e., tions including overall equipment availability, overall
HTML, CSS, and JavaScript) for data visualization. RESTful equipment effectiveness, production rate, and production
APIs are created to connect the front-end applications with yield rate. The 7th view (Figure 3(g)) focuses on the pro-
backend services. Node.js is chosen for building a web duction lines and equipment statistics containing production
application to control the process among the users, VA, and schedule, statistics of historical equipment status, historical
dashboard. status data of each equipment, and statistics of real-time
The virtual assistant is implemented as an app that could equipment status. Users are able to examine the analysis of
be installed on Android-based mobile devices. For speech production line and inspect the statistic of equipment status in
recognition and text-to-speech conversions, we use Google terms of real time and historical data. Finally, we create a
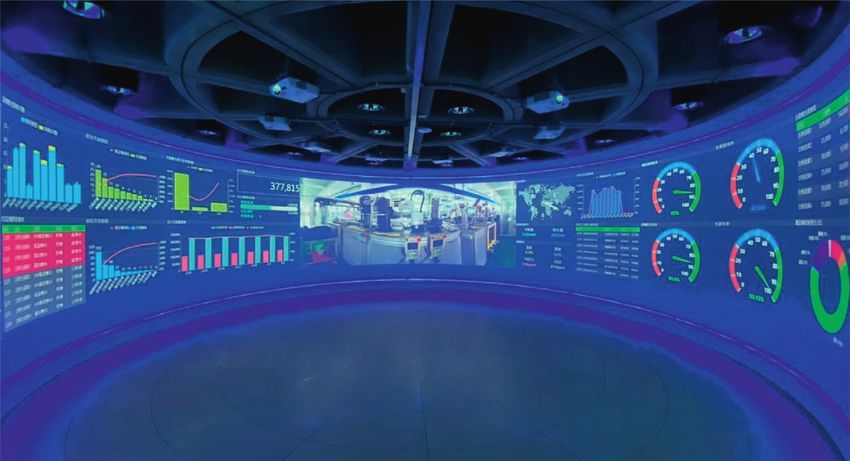
Cloud Speech API to accomplish these two tasks. Microsoft dashboard in a demonstration room which is a 300-degree
Cognitive Services Language Understanding service (LUIS) circular space and designed to give users a complete and
is a cloud-based service that uses machine learning interactive experience as shown in Figure 4.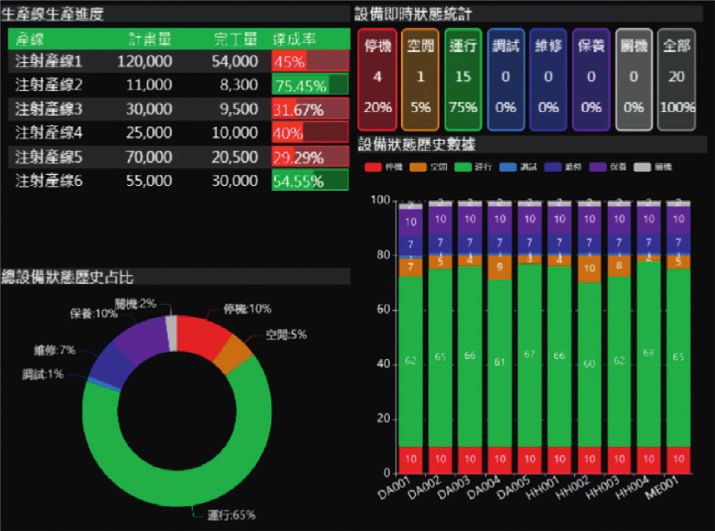
6                                                                                                Mobile Information Systems

                                 Figure 2: Implementation result of the proposed dashboard.

                      (a)                                                         (b)

                      (c)                                                         (d)

                      (e)                                                         (f )

                                                             (g)

                  Figure 3: Seven dashboard views (a) to (g) are decomposed from the dashboard in Figure 2.

   We implement the VA as an app on android-based smart            information and graphic results will be updated on the
phone and show the interface in Figure 5. The user has to          dashboard as well. In the following, we will discuss three
push the microphone button on the touch screen to talk and         typical types of scenarios that are developed. Note that
the VA will display the text results. The corresponding            Xiaodong is the name of our virtual assistant.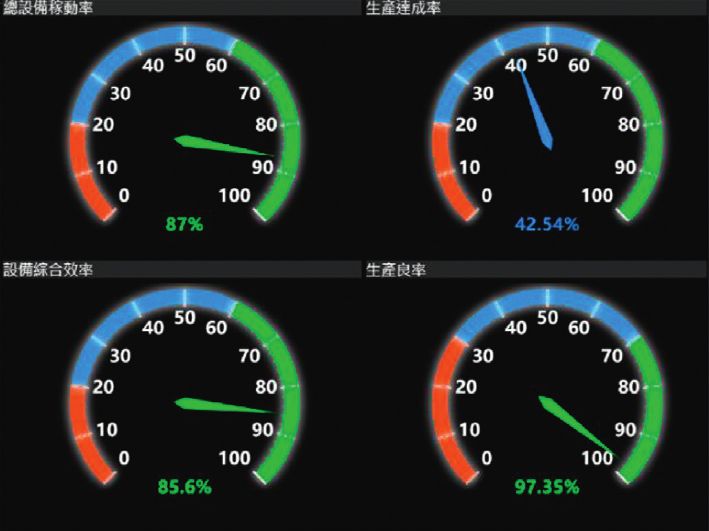
Mobile Information Systems                                                                                                                  7

                                  Figure 4: The implemented dashboard in a demonstration room.

Figure 5: App of the proposed virtual assistant. The VA utters, “Hello, I am Xiaodong and how may I help you?” The user then asks, “the
production of this month.”

    (1) Type 1: When users view the dashboard and require
        additional information, the VA is capable of the                       User:   Hello Xiaodong.
        voice commands and answering the question                              VA:     Hello boss, how may i help you?
        through APIs. In Scenario 1, the user asks the
                                                                               User:   Tell me the amount of yesterday’s defective items.
        number of yesterday’s defective items and the VA
        responds with the amount verbally                                     . VA:    Nineteen.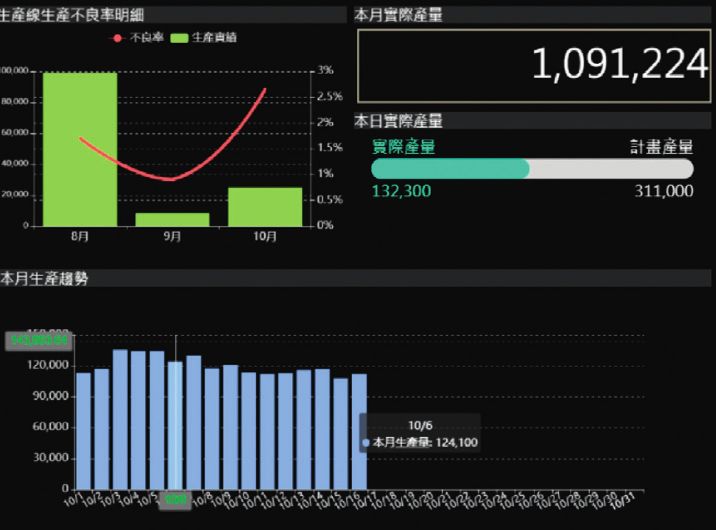
8                                                                                                                    Mobile Information Systems

                                                     Table 1: Comparison with the traditional HMI.
                              User interface             Input modality                Accessibility          Learnability        Data completeness
                                                 Control devices (keyboards and       Limited access          Necessity of           Passive data
Traditional HMI                    GUIs
                                                           mouse etc.)                   points              preknowledge             collection
The proposed                GUIs and mobile                                                                                          Active data
                                                         Voice commands              High portability     Easy learning curve
approach                        devices                                                                                               collection

         (2) Type 2: Interaction with the dashboard is an im-                    explores the interaction between the dashboard and humans
             portant function of the VA. Users can ask the VA to                 through the virtual assistant, which also plays a proactive
             control the dashboard by commands. Currently, the                   role in seeking missing and incomplete data. The proposed
             interaction modes contain showing the live scenes                   dashboard has a three-layer structure which is composed of
             and enlarging one of the specific views on the                       data layer, processing layer, and presentation layer. The
             dashboard. In Scenario 2, the user asks the VA to                   virtual assistant not only communicates with users to exe-
             show the scenes in the factory and the result is similar            cute the given tasks but also could actively contact the related
             to the one displayed in the middle view of Figure 4                 staff to ensure data completeness. We create a dashboard in a
                                                                                 demonstration room and implement a voice-based virtual
              User:   Hello Xiaodong.                                            assistant integrated into the smartphone app as the case
              VA:     Hello boss, how may i help you?                            study. By adopting this proposed approach, users can in-
              User:   Show the live scenes of the manufacturing processes.
                                                                                 teract with the dashboard and, most importantly, perform
                                                                                 in-depth queries with support from the virtual assistant.
             . VA:   Ok! It is shown on the dashboard.

         (3) Type 3: The last type of scenario is about the initiative           Data Availability
             of the VA. Once the user raises a question, but the                 The data used to support this study have not been made
             VA could not determine the answer due to the in-                    available yet, as the supplier prevents this.
             complete or missing data, it will then proactively
             reach out to the relevant personnel. In Scenario 3,                 Conflicts of Interest
             User_A inquires about today’s defective items, which
             need input from User_B. The VA will then initiate a                 The authors declare that they have no conflicts of interest.
             new dialogue to remind User_B on User_A’s behalf
                                                                                 Acknowledgments
    User_A: Hello Xiaodong.                    VA:       Hello boss, please
                                                         fill in the defective   The authors gratefully acknowledge the experimental sup-
    VA:         Hello boss, how may I                    items. Thank you.       port for this work from Tunghai University.
                help you?
                                               User_B: Ok!
    User_A: Tell me the amount of                                                References
            today’s defective items.
        VA:     One person does not fill                                          [1] S. Pfeiffer, “The vision of “Industrie 4.0” in the making-a case
                in yet and I will contact                                             of future told, tamed, and traded,” Nanoethics, vol. 11, no. 1,
                for you.                                                              pp. 107–121, 2017.
    .
                                                                                  [2] S. Yin and O. Kaynak, “Big data for modern industry:
    Since the proposed solution is primarily intended for use                         challenges and trends [point of view],” Proceedings of the
in the manufacturing industry, we compare it with human-                              IEEE, vol. 103, no. 2, pp. 143–146, 2015.
machine interfaces (HMIs) used in manufacturing systems                           [3] S. Few, Information Dashboard Design: The Effective Visual
and show in Table 1. The proposed approach has some                                   Communication of Data, O’Reilly Media, Inc., Newton, MA,
distinct advantages over the HMIs. First, it offers more                               USA, 2006.
flexibility in terms of interaction techniques and portability.                    [4] H. Tokola, C. Gröger, E. Järvenpää, and E. Niemi, “Designing
                                                                                      manufacturing dashboards on the basis of a Key Performance
Second, the mobile interface provides users with an easy-to-
                                                                                      Indicator survey,” Procedia CIRP, vol. 57, pp. 619–624, 2016.
learn and user-friendly environment. Third, regarding the                         [5] Y. Park and I.-H. Jo, “Factors that affect the success of learning
data collection, the virtual assistant could actively contact                         analytics dashboards,” Educational Technology Research and
users for the data input while the traditional HMIs do not                            Development, vol. 67, no. 6, pp. 1547–1571, 2019.
support this functionality.                                                       [6] G. McArdle and R. Kitchin, “The Dublin dashboard: design
                                                                                      and development of a real-time analytical urban dashboard,”
                                                                                      ISPRS Annals of the Photogrammetry, Remote Sensing and
5. Conclusions                                                                        Spatial Information Sciences, vol. 19, p. 25, 2016.
                                                                                  [7] A. Dingli and F. Haddod, “Interacting with intelligent digital
In this study, an interactive design is proposed to resolve two                       twins,” in International Conference on Human-Computer
practical issues in the manufacturing sites, which include                            Interaction, pp. 3–15, Springer, Cham, Switzerland, July 2019.
how to increase the communication between dashboards                              [8] J. S. Jwo, C. S. Lin, C. H. Lee, and C. Wang, “A lightweight
and users and how to improve data completeness. The design                            application for reading digital measurement and inputting
Mobile Information Systems 9
condition assessment in manufacturing industry,” Mobile (SMC), pp. 3317–3322, IEEE, Budapest, Hungary, October
Information Systems, vol. 2021, Article ID 5555833, , 2021. 2016.
[9] M. Farmanbar and C. Rong, “Triangulum city dashboard: an [26] M.-H. Tsai, H.-Y. Chan, and L.-Y. Liu, “Conversation-based
interactive data analytic platform for visualizing smart city school building inspection support system,” Applied Sciences,
performance,” Processes, vol. 8, no. 2, p. 250, 2020. vol. 10, no. 11, p. 3739, 2020.
[10] A. Sarikaya, M. Correll, L. Bartram, M. Tory, and D. Fisher, [27] F. Tao, Q. Qi, A. Liu, and A. Kusiak, “Data-driven smart
“What do we talk about when we talk about dashboards?” manufacturing,” Journal of Manufacturing Systems, vol. 48,
IEEE Transactions on Visualization and Computer Graphics, pp. 157–169, 2018.
vol. 25, no. 1, pp. 682–692, 2018.
[11] K. Thorlund, L. Dron, J. Park, G. Hsu, J. I. Forrest, and
E. J. Mills, “A real-time dashboard of clinical trials for
COVID-19,” The Lancet Digital Health, vol. 2, no. 6,
pp. e286–e287, 2020.
[12] B. D. Wissel, P. J. Van Camp, M. Kouril et al., “An interactive
online dashboard for tracking COVID-19 in U.S. counties,
cities, and states in real time,” Journal of the American Medical
Informatics Association, vol. 27, no. 7, pp. 1121–1125, 2020.
[13] J. Booth, B. Di Eugenio, I. F. Cruz, and O. Wolfson, “Robust
natural language processing for urban trip planning,” Applied
Artificial Intelligence, vol. 29, no. 9, pp. 859–903, 2015.
[14] S. Mennicken, R. Brillman, J. Thom, and H. Cramer,
“Challenges and methods in design of domain-specific voice
assistants,” in Proceedings of the 2018 AAAI Spring Symposium
Series, Palo Alto, CA, USA, March 2018.
[15] Y. Zhang, W. Chan, and N. Jaitly, “Very deep convolutional
networks for end-to-end speech recognition,” in Proceedings
of the 2017 IEEE International Conference on Acoustics, Speech
and Signal Processing (ICASSP), pp. 4845–4849, IEEE, New
Orleans, LA, USA, March 2017.
[16] L. Lugosch, M. Ravanelli, P. Ignoto, V. S. Tomar, and
Y. Bengio, “Speech model pre-training for end-to-end spoken
language understanding,” in Proceedings of the Interspeech,
pp. 814–818, Shanghai, China, October 2019.
[17] M. Chen, G. Lampouras, and A. Vlachos, “Sheffield at e2e:
structured prediction approaches to end-to-end language
generation,” E2E NLG Challenge System Descriptions, vol. 85,
2018.
[18] M. Wieland, P. Hirmer, F. Steimle et al., “Towards a rule-
based manufacturing integration assistant,” Procedia CIRP,
vol. 57, pp. 213–218, 2016.
[19] C. Sinsky, L. Colligan, L. Li et al., “Allocation of physician time
in ambulatory practice: a time and motion study in 4 spe-
cialties,” Annals of Internal Medicine, vol. 165, no. 11,
pp. 753–760, 2016.
[20] “Nuance AI-powered virtual assistants for healthcare,” 2021,
https://www.nuance.com/healthcare/ambient-clinical-
intelligence/virtual-assistants.html.
[21] “Robin healthcare,” 2021, https://www.robinhealthcare.com.
[22] U. U. Rehman, D. J. Chang, Y. Jung, U. Akhtar, M. A. Razzaq,
and S. Lee, “Medical instructed real-time assistant for patient
with glaucoma and diabetic conditions,” Applied Sciences,
vol. 10, no. 7, p. 2216, 2020.
[23] Y. Jeong, A. Singh, M. Zafarzadeh, M. Wiktorsson, and
J. B. Hauge, “Data-driven manufacturing simulation: towards
a CPS-based approach,” in Swedish Production Symposium
(SPS2020), Jönköping, Sweden, October 2020.
[24] K. Grevenitis, F. Psarommatis, A. Reina et al., “A hybrid
framework for industrial data storage and exploitation,”
Procedia CIRP, vol. 81, pp. 892–897, 2019.
[25] B. S. Nascimento, A. S. Vivacqua, and M. R. Borges, “A flexible
architecture for selection and visualization of information in
emergency situations,” in Proceedings of the 2016 IEEE In-
ternational Conference on Systems, Man, and CyberneticsYou can also read


