NETWORK AS A SERVICE (NAAS) DATA ANALYSIS, BUSINESS, AND OPERATIONAL EFFICIENCY METHODOLOGY TIP WHITE PAPER NETWORK AS A SERVICE (NAAS) SOLUTION ...
←
→
Page content transcription
If your browser does not render page correctly, please read the page content below
Network as a Service (NaaS) Data
Analysis, Business, and Operational
Efficiency Methodology
TIP White Paper

Network as a Service (NaaS) Solution
Project Group

June 2021                                       Document version: v1.0

 Confidentiality Level: Green [Public Access]
Network as a Service (NaaS) Data Analysis, Business and Operational Efficiency Methodology

Authors

Amit Dubey

          Facebook

          adubey@fb.com

Gustavo Castellanos

          Network Engineer, Connectivity Deployment, Facebook

          gustacaste@fb.com

                                                                                       Copyright © 2021 Telecom Infra Project   2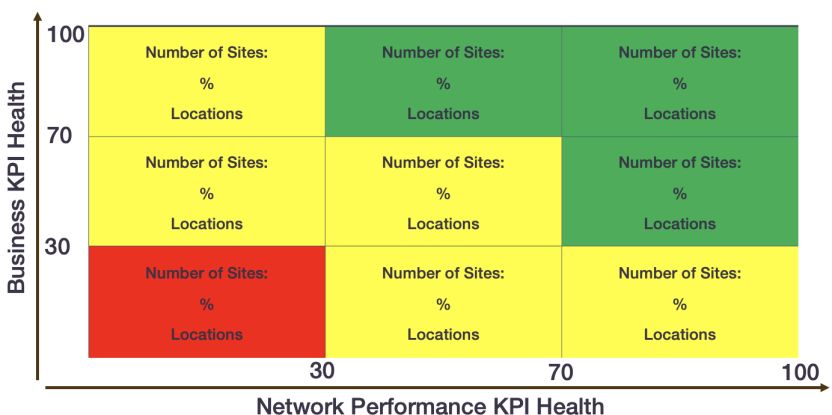
Network as a Service (NaaS) Data Analysis, Business and Operational Efficiency Methodology

TIP Document License
By using and/or copying this document, or the TIP document from which this statement is linked, you (the
licensee) agree that you have read, understood, and will comply with the following terms and conditions:

Permission to copy, display and distribute the contents of this document, or the TIP document from which
this statement is linked, in any medium for any purpose and without fee or royalty is hereby granted under
the copyrights of TIP and its Contributors, provided that you include the following on ALL copies of the
document, or portions thereof, that you use:

     1. A link or URL to the original TIP document.

     2. The pre-existing copyright notice of the original author, or if it doesn't exist, a notice (hypertext is
          preferred, but a textual representation is permitted) of the form: "Copyright © , TIP and
          its Contributors. All rights Reserved"

     3. When space permits, inclusion of the full text of this License should be provided. We request that
          authorship attribution be provided in any software, documents, or other items or products that
          you create pursuant to the implementation of the contents of this document, or any portion
          thereof.

No right to create modifications or derivatives of TIP documents is granted pursuant to this License. except
as follows: To facilitate implementation of software or specifications that may be the subject of this
document, anyone may prepare and distribute derivative works and portions of this document in such
implementations, in supporting materials accompanying the implementations, PROVIDED that all such
materials include the copyright notice above and this License. HOWEVER, the publication of derivative
works of this document for any other purpose is expressly prohibited.

For the avoidance of doubt, Software and Specifications, as those terms are defined in TIP's Organizational
Documents (which may be accessed at
https://telecominfraproject.com/organizational-documents/), and components thereof incorporated into

                                                                                       Copyright © 2021 Telecom Infra Project   3
Network as a Service (NaaS) Data Analysis, Business and Operational Efficiency Methodology
the Document are licensed in accordance with the applicable Organizational Document(s).
Disclaimers
THIS DOCUMENT IS PROVIDED "AS IS," AND TIP MAKES NO REPRESENTATIONS OR WARRANTIES, EXPRESS
OR IMPLIED, INCLUDING, BUT NOT LIMITED TO, WARRANTIES OF MERCHANTABILITY, FITNESS FOR A
PARTICULAR PURPOSE, NON-INFRINGEMENT, OR TITLE; THAT THE CONTENTS OF THE DOCUMENT ARE
SUITABLE FOR ANY PURPOSE; NOR THAT THE IMPLEMENTATION OF SUCH CONTENTS WILL NOT INFRINGE
ANY THIRD PARTY PATENTS, COPYRIGHTS, TRADEMARKS OR OTHER RIGHTS.
TIP WILL NOT BE LIABLE FOR ANY DIRECT, INDIRECT, SPECIAL OR CONSEQUENTIAL DAMAGES ARISING OUT
OF ANY USE OF THE DOCUMENT OR THE PERFORMANCE OR IMPLEMENTATION OF THE CONTENTS
THEREOF.
The name or trademarks of TIP may NOT be used in advertising or publicity pertaining to this document or
its contents without specific, written prior permission. Title to copyright in this document will at all times
remain with TIP and its Contributors.
This TIP Document License is based, with permission from the W3C, on the W3C Document License which
may be found at https://www.w3.org/Consortium/Legal/2015/doc-license.html.
Copyright © 2021 Telecom Infra Project 4Network as a Service (NaaS) Data Analysis, Business and Operational Efficiency Methodology
Table of Contents
Table of Contents 5
Abstract 8
Motivations, Challenges, Methodology, and KPIs 10
Motivation for NaaS and MNOs 10
Definitions and responsibility model 10
NaaS Challenges 10
Participating Teams 11
Methodology description 11
KPI Definition 12
Performance KPIs 12
Business KPIs 13
Data and Analysis 15
Data Collection 15
Cadence 15
Data Normalization 16
Data Disaggregation 16
Site Heatmaps 17
Analysis and Corrective Actions 17
Analysis 17
Classification 18
Root Cause Analysis and Corrective Action 18
Canary Deployment 20
Corrective Actions Implementation 20
Copyright © 2021 Telecom Infra Project 5Network as a Service (NaaS) Data Analysis, Business and Operational Efficiency Methodology
Pre and Post Corrective Action Analysis 21
Site Economics 22
Performance KPIs Corrective Actions 22
End to End Quality of Service Schema 22
Power Consumption 23
Radio Interference and coverage 23
Backhaul Traffic Engineering 24
Quality of Experience (QoE) 24
Reporting and Visualization Dashboards 25
Data Presentation 25
Reporting and Visualization Scope 26
Summary 28
References 29
Glossary 30
Copyright © 2021 Telecom Infra Project 6Network as a Service (NaaS) Data Analysis, Business and Operational Efficiency Methodology
1
Abstract
Copyright © 2021 Telecom Infra Project 7Network as a Service (NaaS) Data Analysis, Business and Operational Efficiency Methodology
Abstract
This whitepaper describes a practical methodology to help mobile operators collect, process, and extract
valuable information by mining statistical data from the RAN and Transport and management network.
Understanding this data will allow service providers to accelerate the integration of new network access
technologies and, at the same time ensure high levels of quality of experience (QoE) and optimal TCO of
Network as a Service (NaaS) offerings implemented with Site/RAN sharing technologies.
Copyright © 2021 Telecom Infra Project 8Network as a Service (NaaS) Data Analysis, Business and Operational Efficiency Methodology
2
Motivations, Challenges, Methodology,
and KPIs
Copyright © 2021 Telecom Infra Project 9Network as a Service (NaaS) Data Analysis, Business and Operational Efficiency Methodology
Motivations, Challenges, Methodology, and KPIs
Motivation for NaaS and MNOs
As service providers’ networks move to use newer technologies in the access, for example introducing 4G
or 5G (and ultimately Network Slices), network densification becomes a challenge. In order to operate
hundreds or even thousands of new sites in rural/ultra-rural (i.e., small communities) or urban areas (i.e.,
buildings, malls, airports), service providers need to adapt their operation and business to a more efficient
model.
Network as a service (NaaS) brings a new business model in the telecommunications ecosystem to help
Service Providers, not only to dramatically reduce the Time to Deploy (TTD) and to optimize CAPEX and
OPEX.
By sharing active and passive elements among multiple Service Providers (e.g., Site Sharing, MultiOperator
Radio Access Network - MORAN, MultiOperator Core Network - MOCN) NaaSCo can optimize the cost
structures by leveraging multi tenancy, site and RAN sharing technologies.
Definitions and responsibility model
NaaSCo: NaaS Company. Owns the access network and might include site, active, and passive components
also can provide backhaul network services.
MNO: Mobile Network Operator. This is the NaaSCo customer, own the customer and provide mobile
services to end users.
Service Provides: Any company providing telecommunication services to the NaaSCo and MNOs.
3rd Parties: Any company providing services (logistics, project management, consulting) to NaaSCo, MNOs
and Service providers.
NaaS Challenges
Even though NaaS fulfills a gap in the service ecosystem, it has its own challenges:
Copyright © 2021 Telecom Infra Project 10Network as a Service (NaaS) Data Analysis, Business and Operational Efficiency Methodology
Dealing with multiple access and backhaul networks, different Services Providers, variety of coverage areas,
multiple access and core network parameters, multiple service level agreements and having healthy
economics imposes their own goals to be satisfied.
This whitepaper describes a practical approach to help NaaSCo with the building blocks to succeed in this
market and allows MNOs to understand the main considerations while they are deploying networks via
Service Providers or 3rd parties as they are consumed as a service.
This document is based on a real NaaS Provider using MORAN sharing, currently offering rural neutral host
services in Latin America for major mobile network operators (MNOs).
Participating Teams
The methodology described in this document was developed in conjunction with the following teams at the
NaaS provider:
● Planning team. Responsible for all planning and forecasting activities such as site selection and
capacity planning.
● Deployment Team. Responsible for installing, configuring, and running the acceptance test
protocols to bring sites up and running in the network. NaaSCo can also use System Integrators to
fulfill this role.
● Operations team. Responsible for managing the network, implementing the operation changes or
corrective actions, and monitoring the network for data acquisition, testing and verification.
● Data Analysis team. Responsible for data analysis, summarization, and presentation via
dashboards.
● Project Management team. Responsible for tracking project evolution and defining milestones and
responsibilities.
Engaging the proper teams to execute the mentioned activities is key to guarantee the success of this
methodology.
Methodology description
The methodology used to support the technical and business aspects is based in the following three (3)
Copyright © 2021 Telecom Infra Project 11Network as a Service (NaaS) Data Analysis, Business and Operational Efficiency Methodology
phases to build a continuous improvement workflow:
1. KPI Definition and Data Collection
2. Analysis and Corrective Actions
3. Results observation via reporting and visualization dashboards
KPI Definition
Selecting the proper KPIs to measure business and performance KPIs not only is key but also challenging in
a NaaS environment.
In MORAN scenarios, when the MNO itself provides and owns the Core Network, NaaS provider doesn’t
have access to charging interfaces (i.e., Gy, Gz) available in the core, hence it is challenging to define
business KPIs that provide visibility to user level contribution since this depends on the user profile, service
packages and charging models (prepaid, postpaid), so a special set of KPIs must be selected in this case to
support Performance and Business KPIs/metrics for the network.
Performance KPIs
3GPP has defined user agnostic KPIs for performance such as:
● Integrity
● Utilization
● Retainability
● Mobility
● Energy efficiency
● Availability
● Quality of Experience (QoE) - End User QoE
● Voice Traffic
● Data Traffic
These KPIs can be used as a baseline but can be modified as required by the NaaS operator to fulfil
particular needs. Please refer to Reference [1] for further details about these KPIs. In Reference [3] there is
a comprehensive list of KPIs that can be used to expand the current selected KPIs.
Copyright © 2021 Telecom Infra Project 12Network as a Service (NaaS) Data Analysis, Business and Operational Efficiency Methodology
Performance KPIs are focused in measuring the health of the network characteristics internally and at user
level.
Business KPIs
The second part of the KPI definition is composed of Business KPIs. This set of KPIs is intended to provide
information about the business side of the operations giving insights about site economics and profitability
for the whole network.
The following KPIs can be used as a reference:
● Area covered
● Total Population Covered
● Number of voice calls
● Data Volume
● OPEX per sector
● Revenues per sector
● OPEX per technology per sector
● Revenues per technologies per sector
● Revenues per Data Traffic
● Revenues per Voice Traffic
● TCO per site (Capex, Opex Analysis) per Service Provider (customer MNO)
● Network TCO for a holistic approach
NaaS should establish well-defined, measurable Business and Performance KPIs to attract more Service
Providers to use their infrastructure, and this information should be shared with Commercial and
Marketing teams as a sales tool.
See also Reference [2].
Copyright © 2021 Telecom Infra Project 13Network as a Service (NaaS) Data Analysis, Business and Operational Efficiency Methodology
3
Data and Analysis
Copyright © 2021 Telecom Infra Project 14Network as a Service (NaaS) Data Analysis, Business and Operational Efficiency Methodology
Data and Analysis
Data Collection
Data Collection is the second component in the first step of the methodology and the goal is to define and
agree on the data to support and extract the selected Key Performance and Business Indicators to
characterize the network.
NaasCo should be able to gather raw data from the following sources:
● From their own management systems (e.g. via reports in NMSs)
● Directly from the Network Elements (e.g., via SNMP or syslog messages)
● From MNOs management systems (e.g., via reports)
Cadence
All supporting data should be collected in the selected cadence/frequency (Daily, weekly, monthly).
Cadency/Frequency can be increased as the network operation model gets more maturity, and the final
goal is to achieve real time data collection. For example, starting with a bi-weekly collection in the initial
phase of network operations and increasing to a daily or near real time collection in further stages. It is up
to the NaaS provider to select the cadence that adjusts to the maturity model.
So, as the methodology’s implementation evolves in its lifecycle, two data processing approaches can be
used:
● Batch processing. Since the origin for the different data is sourced from different management
systems in SPs and NaaS Networks, the data processing pipeline can be implemented in batch
mode and executed in the selected cadence.
● Realtime processing. In later stages, real time data processing pipelines can be implemented either
on premises or by using the latest services from Cloud providers.
For the NaaS Provider, where this methodology was developed, data collection was based on one (1) week
periods. This cadence is recommended when all Network Operation subsystems are in place. However, in
the initial phases of the project deployment batch processing with a cadence of (1) month was used.
During the writing of this document, a real time approach using a selected Cloud provider is being deployed
with a cadence of 5 mins.
Copyright © 2021 Telecom Infra Project 15Network as a Service (NaaS) Data Analysis, Business and Operational Efficiency Methodology
Data Normalization
This activity secures that the data to be processed follows the same format, units, formulas even if they
come from different network management systems (i.e., different vendors) so data redundancy and
inconsistency are avoided. The most important goal is to normalize the data to support each KPI, so the
units, periods, etc., are consistent across the network (same for each SP).
The following parameters should be normalized to use the same units:
● Data Collection Intervals. How often the data is collected.
● Data accuracy, outlier, and unavailable data detection.
● Calculation parameters. i.e., formula used to calculate the KPI.
● Data harmonization. Different equipment vendors might have similar KPIs, but they can be
calculated differently.
● Units in term on how the KPI is described. Another important component for data normalization is
to select the proper unit with the required granularity to provide meaningful information. For
example, KPIs per site can be misleading since bigger infrastructure footprint (higher CAPEX with
multiple technologies) trends to have better cumulative indicators than smaller sites (lower CAPEX
with single technology). In this case, this analysis suggest using the following normalization factors:
● Per technology per Sector level
● Per technology per Power level
● Per technology per Sector and power level
This will allow to have a fair comparison between sites and will support the classification algorithms more
accurately.
Data Disaggregation
Consolidated (Totals/Aggregated) and per-Service Provider (Disaggregated) statistical information should
be produced per each individual KPI. Since each Service Provider included in the Site/RAN sharing network
has independent life cycles for the technology adoption, starting with data disaggregated per technology
and service provider will help to understand the information better, also will allow to create different
Copyright © 2021 Telecom Infra Project 16Network as a Service (NaaS) Data Analysis, Business and Operational Efficiency Methodology
analysis activities and take different corrective actions per each technology independently in later stages of
this methodology.
Site Heatmaps
This methodology proposes to use a simple heatmap to classify the sites based on both Performance and
Business KPIs. These heatmaps can be used for each individual KPI or as a holistic view for an aggregated
summary for all KPIs.
Figure 1 - Network Heatmap
Heatmaps are a great tool to have a view on how the sites are performing and helps in selecting the
corrective actions to move the sites from one quadrant to another as the NaaS operator deploys corrective
actions depending on the observed distribution.
It is recommended to have heatmaps per technology, per service provider and overall/totals to visualize
different views for the KPIs.
Analysis and Corrective Actions
Analysis
The main activities for the analysis are:
Copyright © 2021 Telecom Infra Project 17Network as a Service (NaaS) Data Analysis, Business and Operational Efficiency Methodology
● Group the different network nodes per technology in the corresponding heatmap quadrants for
each KPI under review.
● Identify the root cause analysis and possible corrective action(s)
● Canary Deployment. Select a few sites to validate the selected corrective action(s).
● Corrective Action Implementation (Massive deployment)
Classification
Depending on the maturity level on implementing this methodology, manual and/or automated activities
can be used. It is up to the NaaS provider to select the most appropriate method. The end target of this
activity is to classify each site in its corresponding quadrant based on the current performance and
business KPIs.
The initial recommendation is to group the sites in two axis (performance and business) and distribute each
KPI in their groups (30% and 60 andNetwork as a Service (NaaS) Data Analysis, Business and Operational Efficiency Methodology
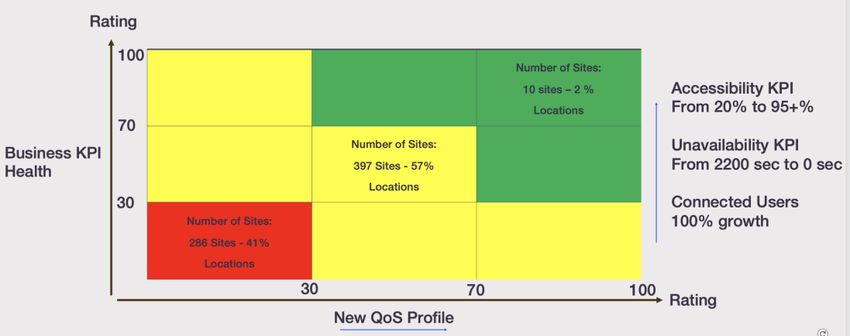
Figure 2 - Actual Heatmap for 3G Sites
Performing root cause analysis is a complex task and needs multiple iterations to identify and segregate the
core issue. Since there may be several factors contributing to the degradation on any particular site, we
have to consider a layered approach and define a methodology. Analytics helps us identify failures and
mapping failure signatures with related KPIs is what we plan as an end deliverable for an RCA.
The heatmap above highlights 286 sites in the lower left quadrant (shown in red). This data is an example
from a live NaaS network. The heatmap describes and implies the following:
● Problem: Accessibility and availability are severely degraded on several 3G sites, the majority of
them using satellite backhaul.
● A Temporary Workaround: The operations team had been resolving most of the issues by
restarting the VLANs. However, this was not a sustainable solution and the core issue diagnosis
remained out of reach.
● Strategy and RCA details: There were few transmission and energy issues to identify. But more
broadly, this was a network-wide problem on 3G sites. The analysis initially sought to understand
the 3G traffic flow and identify any bottleneck contributing to loss of traffic.
Control plane and user plane traffic distribution were evaluated, along with DSCP markings. Packets were
analyzed to be sure the RNCs were correctly marking them. Wireshark logs were captured and analyzed to
debug the issue. This captured and confirmed the volume of traffic being routed using different DSCP
markings. The mapping between PHB (Per Hop Behavior) to DSCP was verified. Finally, the packet
inspection revealed that DSCP48 was being used for signaling carrying more than 50% of total inbound
traffic.
Copyright © 2021 Telecom Infra Project 19Network as a Service (NaaS) Data Analysis, Business and Operational Efficiency Methodology
The analysis of the data determined that the same VLAN was being used for Control and User plane traffic
depending on the protocol. Control Plane (CP) traffic was using DSCP48 on COS1, and User Plane (GTP-U)
was also DSCP 48. Hence, the mixing of user and control plane traffic in the same traffic queue on COS1
resulted in destabilization of site availability and accessibility KPIs. There were 2 options proposed in the
solution statement:
1. Mark GTP-U used for UP with another DSCP
2. Create rule based on combination of IP, DSCP and VLAN ID to make the target Destination IPs in
CoS2
A new QoS profile was defined and validated to secure the proper QoS treatment for the 3G control traffic
in the network. This corrected the issue. This profile was designed to send higher priority traffic (3G Control
Traffic) to a higher priority queue and keep the lower priority traffic (3G User Plane Traffic) in the current
queue.
Canary Deployment
The proposed new QoS profile was fine-tuned and validated initially in a few sites. It is NaaS responsibility
selecting the number of sites for Canary deployment. This varies depending on the number of total sites in
the network or the technology mix where action will be taken.
Corrective Actions Implementation
Once the heatmap describing the current network state is defined, the next step is to implement the
corrective action and track how the heatmap changes during the implementation of the fix.
This phase will deploy the corrective action in the target population of nodes for the whole network.
Figure 2 above shows an actual heatmap for the mentioned 3G sites during the implementation of a
corrective action (applying a new QoS profile) indicating:
● Quadrant 1 - 41% (286) of the sites still to be migrated with the new QoS Profile having low
performance and business KPIs (30% - 60%)
Copyright © 2021 Telecom Infra Project 20Network as a Service (NaaS) Data Analysis, Business and Operational Efficiency Methodology
Target KPIs for nodes after the migration (Quadrant 9) will offer the following improvements:
● Accessibility KPI of 95+%
● Unavailability KPI of 0 sec
● Connected Users KPIs with an increase of 100%
The affected three KPIs are used as an example.
It is expected that after completion, all sites should be part of the top performing nodes for the specified
KPIs, in this case, accessibility, unavailability, and connected users.
If heatmap is not showing any improvement, a new root cause analysis would be required, and new
corrective actions would need to be implemented until the affected KPIs achieve the desired levels.
Pre and Post Corrective Action Analysis
Besides tracking the heatmaps, it is also important to track how the corrective action is impacting the
particular KPI. This can be executed in the following steps, and it is applicable to all affected KPIs:
1. Capturing current data (before implementing corrective action)
2. Implementing changes in a specific date and time
3. Capturing new data (after implementing corrective action)
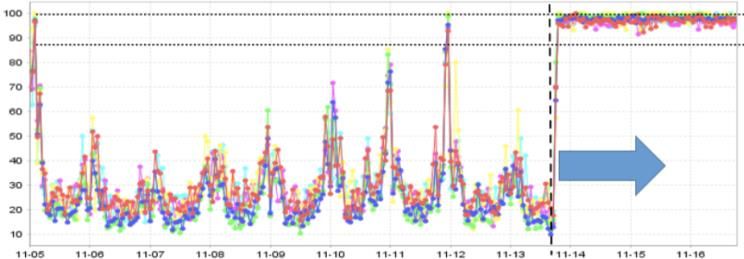
Figure 3 below shows an actual data capture and visualization for the availability KPI in a site with multiple
sectors (each sector with an specific color) before and after the recommended corrective action. The black
dotted line identifies the exact time when it was applied.
Figure 3 - Pre and Post Data analysis after corrective actions
By using these visualization dashboards, it is easy to identify the impact of the changes in the specific KPI
and translate a performance KPI into a business KPI to assess the economic impact in the TCO.
Heatmaps should be recalculated after a set of changes have been made in the network for tracking
Copyright © 2021 Telecom Infra Project 21Network as a Service (NaaS) Data Analysis, Business and Operational Efficiency Methodology
purposes, for example, during the implementation and after finishing the implementation.
Other factors considered in the analysis phase are:
● Site Economics
● Site Selection
Site Economics
Site economics cover all relevant aspects to improve Business KPIs and its impact on the TCO.
Given its extension, the authors have covered this topic in a different document [7], so this document has a
technical approach to Performance KPIs and its direct impact on Business KPIs. The reference document
explains in detail all business aspects considered in this methodology and how to improve Business KPIs.
Performance KPIs Corrective Actions
Degradation and Improvement of Performance KPIs are based mostly in how the packet network is
performing at radio and transport network levels.
Here the most relevant components that impact the Performance KPIs:
● End to End quality of service schema. [4]
● Power consumption.
● Radio Interference and coverage.
● Backhaul Traffic Engineering.
● Quality of Experience (QoE)
End to End Quality of Service Schema
One of the most significant challenges NaaS operators face is dealing with a very fragmented network
when it comes to end to end quality of service approach. Multiples backhaul and IP transport networks
(Microwave, Satellite, Fiber, NLOS) need to work together to guarantee all flows and their quality of service
are preserved and enforced in all interfaces and nodes as the frames/packets flow through the network.
Hence in this methodology the End to End Quality of Service Schema is treated as a separated item to take
care of, since it will require participation and agreement from different parties such as: vendors, backhaul
service providers and the service providers.
This methodology used the “Quality of Service Recommendations for Mobile Networks” [4] publication
Copyright © 2021 Telecom Infra Project 22Network as a Service (NaaS) Data Analysis, Business and Operational Efficiency Methodology
available in the TIP NaaS website as a reference design.
NaaS Providers can use this reference to develop their own E2E QoS Schema that fits a particular network
architecture and network segments.
Power Consumption
Power consumption affects the OPEX and site economics for the site and for the whole network and also
the Radio performance. During the development of this methodology the following alternatives were
considered to lower the power consumption on the sites to improve Business KPIs:
● Lowering radiated power over low utilization periods (i.e., from 10Watts to 1Watt)
● Turning the site off during zero utilization periods
Looking at the other side of the coin, some alternatives were considered to improve the network utilization
during these low utilization ranges such as:
● Working with Service providers marketing teams to create Service Plans to encourage network
utilization at nights or low utilization periods
● Transfer all collected statistical data during the day over these periods and avoid doing it during
high utilization periods to improve the capacity for the actual user traffic during rush hours
● Distribute new software images and network patches and other activities that can be scheduled on
during these periods
● Delay Smartphone/UE OS or App updates during low utilization periods
Radio Interference and coverage
After the RAN shared site is installed and all components are up and running, it is important to guarantee
all radio parameters (Power, Interference, antenna alignment and coverage) are properly validated so
optimal network KPIs can be achieved and monitored per site.
During the development of this methodology, two references main were used to secure the best radio and
backhaul performance, these are:
● Total Site Solution Site Installation Runbook (SIR) [5] and
● Total Site Solution - Field Trial Plan SSD, SSV and Soak testing [6]
Extract the relevant sections that are applicable to a particular use case and execute the site verification
Copyright © 2021 Telecom Infra Project 23Network as a Service (NaaS) Data Analysis, Business and Operational Efficiency Methodology
and drive test to achieve optimal performance and use this as baseline for future analysis.
These documents use 4G RAN and Satellite backhaul, but the testing and acceptance protocols can be
easily extrapolated to other technologies such as 2G, 3G and Microwave or Fiber among others.
Backhaul Traffic Engineering
Backhaul Network engineering is crucial for a NaaS operator to secure a good business case since it is one
of the most important components of the site’s OPEX.
Regardless the backhaul technology, here there is a list of major activities that NaaS need to develop:
● Capacity planning
● Fair Usage
● Bandwidth Throttling
● Peak allocation (CIR, EIR)
● Congestion Management
Once a NaaS provider is able to define the technical requirements to secure a proper capacity on their
transport networks, a fine granularity analysis should be done to correlate the traffic usage with the
different charging models offered by their transport service providers including:
● Flat rate charging (i.e., used for 2G or voice services)
● Volume based charging (i.e., used in 4G data services)
● Guaranteed and Excess charging (i.e., CIR and EIR volume costs)
Deeper review on this topic is out of the scope of the methodology and it is the responsibility of the Naas
to define it.
Quality of Experience (QoE)
All the corrective actions will have an impact on how the network is perceived from the user’s perspective.
This methodology also considers measurements for Quality of experience to track how the services are
impacted in a positive or negative way by the corrective actions.
Some of the parameters than can be measure at user level are:
● Average Throughput
Copyright © 2021 Telecom Infra Project 24Network as a Service (NaaS) Data Analysis, Business and Operational Efficiency Methodology
● Average latency
This information can be captured for the different planes in the network such as Control Plane (Signaling
Traffic) and Data Plane (User Data traffic).
The NaaS provider in this methodology used TEMS (Test Mobile System) devices to capture the relevant
information.
Reporting and Visualization Dashboards
Most of the time, providing a good idea of the meaning of the data in a visual form is challenging and in
some other cases can lead to misinterpretation, so selecting the proper data and visual representation is a
key factor to succeed when this methodology is used.
For example, when the data is changing often selecting the proper time scale will give a better
understanding of the collected data and the information behind it.
Data Presentation
Each NaaS provider will be interested in having different views of the collected data. After few iterations,
during developing this methodology the authors found relevant to segregate the data in the following main
groups:
● MNO View. It is ideal to have a view for each KPI for each individual Service Provider participating
in the RAN sharing model. This will allow each MNO to manage their own view about the network
and also will show to the NaaS operator, the particular contribution in the overall performance and
business KPIs. This information should be shared with the MNOs in periodic reviews.
● Consolidated View. This is an aggregated view mainly focused on summarizing, to the NaaS
provider, the overall network and business performance.
This cover the following areas:
● KPI visualization
● Heatmaps
● Pre/Corrective Action/Post dashboards
Copyright © 2021 Telecom Infra Project 25Network as a Service (NaaS) Data Analysis, Business and Operational Efficiency Methodology
Reporting and Visualization Scope
In the beginning of the methodology implementation, NaaS providers can be overwhelmed to get relevant
information for all available KPIs. To support a smooth process, it is recommended to start looking at the
data backwards and only for a selected group of KPIs.
By analyzing the data of the last week, last month, last quarter, the NaaS provider can execute the proper
network optimization activities and as the process goes, keep adding two or three new KPIs every month.
Depending on the resources available to implement the methodology, this process can take one or two
months or can be extended to a maximum recommended period of six (6) months.
In the final phase of the deployment of this methodology supported with a near real time data collection
cadence, new goals are being defined on the reporting and visualization scope to cover event prediction
and forecasting in the following areas:
● Near real time reaction (Closed loop management) to external events that impact the network
utilization such as special events, special dates, people gatherings, weather conditions, natural
disasters among others
● Site selection forecasting based on population growth
● Network Failures Prediction (Alarms, failures)
● Bandwidth growth planning (Capacity planning)
● Revenue growth
Copyright © 2021 Telecom Infra Project 26Network as a Service (NaaS) Data Analysis, Business and Operational Efficiency Methodology
4
Summary
Copyright © 2021 Telecom Infra Project 27Network as a Service (NaaS) Data Analysis, Business and Operational Efficiency Methodology
Summary
NaaS providers can achieve their business objectives by following a systematic approach to optimize the
network at performance and business.
This methodology is a foundation on implementing planning and operation activities between different
stakeholders to successfully manage a network deployment via Site and RAN sharing and it can be scaled
down or scaled up to meet the particular needs of a Service Provider interested in deploying an offering
with the NaaS concept.
Copyright © 2021 Telecom Infra Project 28Network as a Service (NaaS) Data Analysis, Business and Operational Efficiency Methodology
References
[1] 3rd Generation Partnership Project; Technical Specification Group Services and System Aspects;
Management and orchestration; 5G end to end Key Performance Indicators (KPI) (Release 16)
[2] 100 KPI’s for Mobile Telecom Operators
[3] The Ultimate Guide to Mobile App KPIs in 2021
[4] Quality of Service Recommendations for Mobile Networks. Telecom Infra Project NaaS. Jan 2021.
[5] Total Site Solution - Site Installation Runbook (SIR). Telecom Infra Project.
[6] Total Site Solution - Field Trial Test Plan SSD, SSV and Soak Testing. Telecom Infra Project.
[7] NaaS - Site Economics. Telecom Infra Project.
Copyright © 2021 Telecom Infra Project 29Network as a Service (NaaS) Data Analysis, Business and Operational Efficiency Methodology
Glossary
A EIR – Excess Information Rate
AAA – Authentication, Authorization and eNodeB – Evolved Node B in 3GGP 4G
Accounting architectures
APN – Access Point Name EPC – Evolved Packet Core
Apps – Applications EVPN – Ethernet Virtual Private Network
ACL – Access Control List EXP – Experimental Bits in MPLS Label
B F
BA – Behavior Aggregate FACH – Forward Access Channel
BGP – Border Gateway Protocol FCS – Frame Check Sequence
BTS – Base Transceiver Station FEC – Forward Error Correction
BW – Bandwidth
G
C 3GPP – 3rd Generation Partnership Project
CBH - Catalyzer Bed Heaters GBR – Guarantee Bit Rate Service
CBS – Committed burst size GGSN – Gateway GPRS Support Node
CP – Control Plane GPRS – General Packet Radio Service
CIR – Committed information Rate GRE – Generic Routing Encapsulation
CoS – Class of service GTP – GPRS Tunneling Protocol
CS – Circuit Switching GWCN – Gateway Core Network
CSC – Carrier Supporting Carrier
H
CSR – Cell Site Router
H-QoS – Hierarchical Quality of service
CSG – Cell Site Gateway
I
CSPF – Constrained Shortest path First
IETF – Internet Engineering Task Force
D
IMS – IP Multimedia Subsystem
DEI – Discard Eligibility Indicator bit
IP – Internet Protocol
DHCP – Dynamic Host Configuration Protocol
IpT – Internet Para Todos in Peru
DP – Data Plane
Ipsec – Internet Protocol Security
DSCP – Diff Service Code Point Field/Architecture
IS-IS – Intermediate System to Intermediate
System Protocol
E
EBS – Excess Burst Size
K
Copyright © 2021 Telecom Infra Project 30Network as a Service (NaaS) Data Analysis, Business and Operational Efficiency Methodology
Kbps – Kilobits per second PCRF – Policy Control and Resource Function
KB – Kilo bytes P Router – Provider Router in a MPLS
architecture (Core Node)
L
PE Router – Provide Edge Router in a MPLS
LDAP – Lightweight Directory Access Protocol
architecture (Edge Node)
LBM – Loopback Messages
P-GW – Packet Gateway
LBR – Loopback Replay Messages
PHP – Per Hop Behavior
LTM – Link Trace Messages
Prio – Priority
LTR – Link Trace Reply messages
PTP – Precision Time Protocol
LTE – Long Term Evolution (3GPP 4G
PQ – Priority Queueing
Architecture)
Q
M
QCI – QoS Class Identifier
MAC – Media Access Control
QoS – Quality of Service
MEP – Management End Point
QoE – Quality of Experience
MEF – Metro Ethernet Forum
MetroE – Metro Ethernet Network R
MME- Mobility Management Entity RAN – Radio Access Networks (3GPP 2G, 3G, 4G,
MOCN – Multi Operator Core Network 5G, IEEE Wi-Fi)
MORAN – Multi Operator Radio Access Network RACH – Random Access Channel
MPLS – Multiprotocol Label Switching RBS – Radio Base Station
Msec – Milliseconds RED – Random Early Discard
MSS – Maximum Segment Size RFC – Request for Comments
MTU – Maximum Transmit Unit RTN – Return Channel, Retro Television Network
RTC – Real time communications
N
RCS – Rich Communication System
NTP – Network Time Protocol
RSL – Radio Signaling Link
O RSVP – TE – Resource Reservation Protocol –
OSPF – Open Shortest Path First Protocol Traffic Engineering
O&M – Operations and Maintenance
S
OML – Organizational and Maintenance Link
SIP – Session Initiation Protocol
SIP-I – Session Initiation Protocol - Interworking
P S-GW – Serving Gateway
PCH – Paging Channel SGSN – Serving GRPS Support Node
PCP – Priority Code Point SFTP – Secure File Transfer Protocol
Copyright © 2021 Telecom Infra Project 31Network as a Service (NaaS) Data Analysis, Business and Operational Efficiency Methodology
SLA – Service Level Agreement VoQ – Virtual Output Queueing
Sync – Synchronization VLAN – Virtual Local Area Network
VPLS – Virtual Private Line Service
T
VSAT – Very Small Aperture Terminal
TCP – Transmission Control Protocol
3PP – Third Party Product W
Wi-Fi – Wireless Fidelity
U
WFQ – Weighted Fair Queuing
UE – User Equipment
WRED – Weighted Random Early Discard
UDP – User Datagram Protocol
WRR – Weighted Round Robin
V
X
VoD – Video on Demand
X2 – X2 3GPP Interface
VoIP – Voice Over IP Protocol
Copyright © 2021 Telecom Infra Project 32< Network as a Service (NaaS) Data Analysis, Business and Operational Efficiency Methodology > Copyright © 2021 Telecom Infra Project, Inc. A TIP Participant, as that term is defined in TIP’s Bylaws, may make copies, distribute, display or publish this Specification solely as needed for the Participant to produce conformant implementations of the Specification, alone or in combination with its authorized partners. All other rights reserved. The Telecom Infra Project logo is a trademark of Telecom Infra Project, Inc. (the “Project”) in the United States or other countries and is registered in one or more countries. Removal of any of the notices or disclaimers contained in this document is strictly prohibited. 33
You can also read