Community-scale Big Data Reveals Disparate Impacts of the Texas Winter Storm of 2021 and its Managed Power Outage - arXiv
←
→
Page content transcription
If your browser does not render page correctly, please read the page content below
Community-scale Big Data Reveals Disparate Impacts of the Texas Winter
 Storm of 2021 and its Managed Power Outage

 Cheng-Chun (Barry) Leea*, Mikel Maronb, and Ali Mostafavic
 a
 Postdoctoral Research Associate, Zachry Department of Civil and Environmental Engineering, Texas A&M
arXiv: 2108.06046v3 [physics.soc-ph] 13 Aug 2021

 University, 199 Spence St., College Station, TX 77840; e-mail: ccbarrylee@tamu.edu
 b
 Community Team, Mapbox, Washington, DC; e-mail: mikel@mapbox.com
 c
 Associate Professor, Zachry Department of Civil and Environmental Engineering, Texas A&M University,
 199 Spence St., College Station, TX 77840; e-mail: amostafavi@civil.tamu.edu

 Abstract
 Aggregated community-scale data could be harnessed to allow insights into the disparate
 impacts of managed power outages, burst pipes, and food inaccessibility during extreme weather
 events. During Winter Storm Uri in February 2021, Texas power-generating plant operators
 resorted to rolling blackouts to prevent wider collapse of the whole power grid when power
 demand overwhelmed supply. In this study, we collected community-scale big data (e.g., digital
 trace and crowdsourced data) in the context of the winter storm, which brought historically low
 temperatures, snow, and ice to the entire state of Texas. By analyzing this data, we can infer the
 extent of disparities in storm-related impacts on vulnerable populations. In addition to assessing
 disparate impacts of the managed power outage, this study also examined the extent of burst pipes
 and disrupted access to food. Using statistical and trend classification analyses, the results
 highlight the spatial and temporal patterns of impacts for subpopulations in Harris County, Texas,
 within which the city of Houston is located. In particular, findings show significant disparity in
 the extent and duration of power outages experienced by low-income and minority groups. This
 finding suggests that the existence of inequality in the management and implementation of the
 power outage. Also, the extent of burst pipes and disrupted food access were more severe for low-
 income and minority groups. These findings suggest implications for understanding the disparate
 impacts of extreme weather events on vulnerable populations; in particular, the findings could
 provide insights allowing infrastructure operators to enhance social equality considerations during
 managed service disruptions in such events. The results and findings demonstrate the value of
 community-scale big data sources for rapid impact assessment in the aftermath of extreme weather
 events.

 Keywords

 Power outages; Winter storm; Disparate impacts; Rapid impact assessment; Big data

 1
Introduction
 Extreme weather disasters, such as floods, hurricanes, earthquakes, and winter storms are
likely to become more frequent and more intense, leading to more life-threatening and economy-
damaging events. (1–3) Such events could cause severe damage of critical infrastructure systems
(e.g., power, water, and road networks), which will inflict severe impacts on human systems and
the environment. (4–7) Compounding infrastructure failures, socioeconomic and race inequality
can cause different levels of vulnerability to disasters. (8–10) Understanding the disparate impact
of the past events on minorities becomes critical when developing mitigation plans to reduce the
influence of extreme weather events on society and to prepare response strategies to adapt to other
disasters. (2, 11)
 Communities are not monolithic entities, meaning that people’s awareness, needs,
responses, and tolerance to a disaster can vary greatly. It has been known and shown in the
literature that inequalities in race, ethnicity, income, gender, and age exist during and in the
aftermath of disasters (12–15). In particular, extreme weather disasters can result in service
disruptions in critical infrastructures, such as transportation, electricity, water, and communication
systems (16). Elliott and Pais (13) examined the impacts of Hurricane Katrina by analyzing survey
data collected from more than 1,200 survivors and found strong differences in race and class.
Peacock et al. (15) used tax appraisal data to assess long-term trends in housing recovery for
Hurricanes Andrew and Ike and showed that low-income areas tend to suffer more damage and
recover more slowly. Coleman et al. (17) investigated empirical data after Hurricane Harvey to
assess the impacts of service disruptions on critical infrastructures. The results revealed that less
advantaged socioeconomic households, racial minorities, and households with younger residents
reported less ability to withstand disruptions. In sum, the literature has revealed existing
inequalities in the context of disaster management. Studies on extreme cold weather situations,
however, are scarce. The Texas winter storm, Winter Storm Uri, is a unique example affording the
opportunity to examine to what extent the impacts of power outages, burst pipes, and food
inaccessibility were disproportional across different races, ethnicities, and incomes.
 Due to climate change, the frequency and intensity of extreme weather events have been
increasing. Such extreme weather may necessitate that power infrastructure owners and operators
implement managed outages to cope with the surge in demand in the case of both winter storms
and extreme heat or to prevent wildfires to start. Despite the growing practice of managed power
outages during extreme weather events, little evidence exists regarding the extent to which these
managed outages are implemented in an equitable manner. This limitation is partly due to the
inability of researchers to access fine resolution data related to the extent and duration of outages
for different subpopulations. In this study, we address this limitation by harnessing and analyzing
digital trace data to obtain proxy measures to analyze the extent of power outages experienced by
subpopulations. In addition to the use of digital trace data for examining the extent of power
outages, we also utilized other community-scale data sources for rapid impacts assessment related
to burst pipes and disrupted access to food.
 Several methods have been proposed to evaluate the community impact of crisis events
using new technology that provides large-scale digital trace data. (10, 18) Detailed spatiotemporal
data offer unique insights into the interdependence of disaster problems, human activity, and urban
mobility. The new insights can help us assess the impact of disaster more accurately (19), respond
to disaster promptly (20), and enhance preparedness for future events (21). Researchers have relied
mainly upon social media platforms to evaluate disaster impact in recent years. For example, social

 2
media has been implemented to sense community disruptions impact (19), assess disaster
footprints and damages (22), categorize disasters for responses (23), and map disaster locations
(24). Social media data, however, can be affected by factors such as income, population size,
population composition, or minority ratio. (25) The evaluation results from social media may be
potentially biased because of the unbalanced user population among socioeconomic groups and
affected areas. In addition, not every piece of social media information is geo-coded; for example,
only 1% to 2% of tweets have geospatial information (26, 27), which may lead to biased results
and stymies tracking population activity and behavior difficult.
 In this study, we utilized digital trace and crowdsourced datasets to evaluate the impact of
the 2021 winter storm in Texas. Population activity can be derived from cell phone signal densities.
Higher cell phone signal densities may indicate more population activities in a location; thus, cell
phone signal densities can be aggregated into an activity index as a proxy for population activity.
A few studies have incorporated activity index into disaster-related research; for example, Yuan
et al. identified human activity features for flood impacts (30), and Gao et al. discovered early
indicators for COVID-19 (31). The literature demonstrates that the analysis of digital trace data
enables assessment of the impact of disaster events. In particular, digital trace data could provide
a reliable proxy for the extent and duration of power outages. The level of cellphone signal activity
would fluctuate if there is power outage. (People may evacuate if they don’t have power, or they
might not have power to charge their cellphone devices.) This study obtained and integrated digital
trace data from several sources to examine the extent and duration of the power outages. In addition
to digital trace data based on cellphone activities, the time series of population visits to points of
interest (POIs) is a commonly used indicator of population activities. Analysis of visits to POIs,
such as restaurants, gas stations, and grocery stores, reveals insights into how people move around
a city and where people visit during a disaster event. Several studies have been conducted to assess
the impact or determine the signal of disasters, such as the COVID-19 pandemic (20, 28),
Hurricane Harvey (18), and Hurricane Irma (29), by implementing the visit data of POIs. The
fluctuations in POI visits could provide reliable insights regarding disrupted access to critical
facilities, such as grocery stores and restaurants.
 By employing community-scale big data from various sources, the objectives of the paper
are to (1) categorize the responses to infrastructure failure (e.g., managed power outages) and to
assess the impacts (e.g., burst pipes and food inaccessibility) of an unusual extreme weather event,
and (2) reveal potential disparate impacts on income, race, and ethnicity in responding to an
unusual event. The study used the Texas winter storm, Winter Storm Uri, in February 2021, as a
case study to fulfill the objectives of the paper.

Materials and methods
 This study gathered and aggregated data from several data sources related to population
activity, point-of-interest visits, 311 service helpline, and demographic information. As shown in
Figure 1, the data were collected and used to assess community impacts related to the winter storm-
induced power outages, burst pipes, and food inaccessibility. All data were aggregated to the
census tract level to be comparable. The study area, period, and details of each data source are
discussed in the following sections.

 3
Figure 1 Schematic of the study to assess the impact of Winter Storm Uri.

Study area and period

 The study collected and analyzed data from various, sources, Harris County, Texas, which
includes Houston metropolitan area. From February 13 through 17, 2021, a severe and icy winter
storm, Winter Storm Uri, affected most of North America. The Houston area was one of the most
adversely affected areas in the state. The winter storm reached Harris County late on the evening
of February 14, 2021, bringing snow and below-freezing temperatures. Residents of Harris County
were warned of the impending snow and low temperatures starting February 10, 2021. On the
afternoon of February 12, 2021, disaster declarations were in effect in all 254 Texas counties. (The
National Weather Service issued winter weather alerts to more than 154 million people in the
United States on February 15, 2021. (32)) The impact of the storm was especially significant on
Texas residents who were not experienced with cold weather, snow, or icy conditions. Historic
records, both temperature and duration, were broken, and at least 111 people passed away in Texas
due to hypothermia. (33–35) This winter storm caused severe damage in Texas. Traffic was greatly
affected due to icy and slick road conditions. A 133-car pileup on Interstate Highway 35W in Fort
Worth caused six fatalities. (36) The state's electricity infrastructure was overwhelmed due to
heating demand, necessitating rolling blackouts to avoid collapse of the entire electrical grid.
Nearly 4.5 million Texas homes and businesses lost power during the peak of this crisis. (34) The
estimated cost of the blackouts was at least $195 billion USD. (37) In the study area of Harris
County, more than 90% of residents lost power, and about 65% of the residents experienced water
outages at some point during the winter storm. (38) For this study, we obtained data from January
and February 2021 to conduct the analyses. The January 2021 data were averaged based on the
day of the week and served as the baseline for the assessments. The study then used the data in
February 2021 to compare with the baseline data to understand the impact of disaster preparedness,
responses, and recovery. Data from different sources were aggregated at the census tract level and
integrated to be comparable.

 4
Data sources

Population activity

 Due to a lack of publicly accessible power outage records of sufficiently fine granularity,
this study relied upon data provided by Mapbox to obtain telemetry-based population activity at a
specific time period and location to assess the impact of power outages. Issues during blackout
periods would cause a decrease in telemetry-based population activity. For example,
telecommunication base stations could not transmit signals, cable modems and Wi-Fi routers in
houses could be nonfunctional, cell phones’ batteries could be without a means of recharging.
Attempts by the authors to obtain fine-resolution power outage data from the electricity owner and
operator company were unsuccessful. Therefore, this study assessed the impact of power outages
during the winter storm by analyzing telemetry-based population activity. Mapbox aggregated raw
cell phone information by time span and geographic unit and normalized them to a baseline period,
January 11 to 17, 2021, in this study. After Mapbox aggregated and normalized the raw data,
activity index (A), a scaling factor, was calculated by dividing the cell phone device counts of
geographic units over the 99.9th percentile across all geographic units in the baseline period. A
geographic unit is a point in a spatial-resolution grid representing certain areas in the study areas.
The 99.9th percentile of cell phone device counts across all geographic units represents the highest
population activity of the study areas excluding some potential outliers. In other words, a
geographic unit received 0.5 at a specific time span indicating that the cell phone device counts of
the geographic unit are 50% of the highest cell phone device counts of all geographic units at its
baseline period. The more users located in a geographic unit at a time span, the higher the
population activity. Mapbox applied two anonymization processes to protect users' privacy. Firstly,
if geographic areas have only a few counts below minimum requirements, the counts would be
dropped. Secondly, slight random noise was applied to the existing counts. While the data was
derived from cell phone information, data may not exist in every geographic unit at all times. For
example, a National Park has many tourists during the day but closes at night, resulting in less
population activity and thus insufficient data to be aggregated during nighttime. Some places may
lack data if the visit counts are too few at a particular time. The spatial resolution of the aggregated
data is about 100 by 100 meters, and the temporal resolution is 4 hours.
 To make the data comparable, the activity index was aggregated and used to calculate the
activity density (Da) of each census tract (ct) at each time period (t). The calculation is:

 1
 1
 ( , ) = ) , .,/ 0

 .23

where, Da(ct, t) is the activity density at time t in census tract ct, Au,t is the activity index at time t
of geographic unit u, and N is the number of geographic units within census tract ct. By calculating
activity density for every census tract in Harris County and every time period between February 1
through 28, 2021, the spatiotemporal pattern of population activity can be identified.

 5
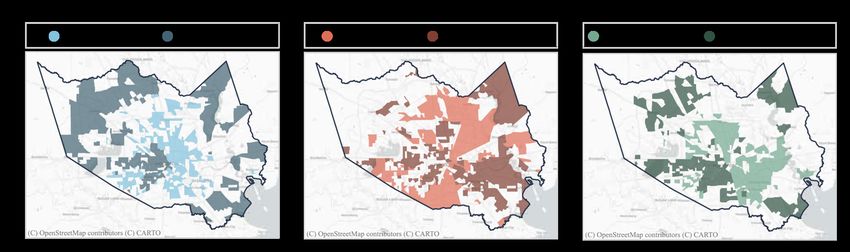
Point-of-interest data

 POI data used in this study was provided by SafeGraph, who partners with several mobile
applications to obtain anonymous location data from mobile devices. The aggregated POI data
includes basic information of places, such as location name, latitude, and longitude, address, and
business category denoted by standard North American Industry Classification System (NAICS)
code, which identifies specific business categories. In addition, the POI data provides the visit
counts to a POI every day over the analysis period.
 To evaluate the impact of the winter storm, this study identifies two types of POIs for
analyses: grocery stores (NAICS code: 445110) and restaurants (NAICS code: 72251). The data
for grocery stores can represent the changes in terms of daily needs of food accessibility. The
fluctuation of restaurant visits can be extended to understand the food accessibility of communities.
Visit data was aggregated at the census tract level to isolate the visit changes during the winter
storm; however, some residents living close to the boundary of census tracts may tend to go to the
restaurants or grocery stores in neighboring census tracts. To account for this consideration, a one-
mile buffer was applied to all census tracts when aggregating visit data to the census tract level. In
other words, the aggregated visit data of a census tract would include the POIs within a one-mile
distance from the boundary of the census tract.

311 Service Helpline
 The 311 Service Helpline in the Houston area is a consolidated call center at which city
residents can report non-emergency concerns, such as traffic fines and sewer concerns to pothole
problems and neighborhood complaints and can request information on city services. The details
of each 311 record include start and finish time, latitude and longitude, and the type of service
request. In this study, the 311 data is used to assess the impact of burst pipes. Thus, water-related
service requests were filtered to reveal the 311 records related to burst pipes. The data were further
aggregated to the census tract level based on the latitude and longitude of each request. In this
manner, the count of cases of burst pipes in each census tract on each day in February 2021 can be
calculated and used for analysis.

Demography
 All demographic and household socioeconomic data used in this study were retrieved from
the American Community Survey database administrated by US Census Bureau and aggregated
by census tract level. The year and the version of the data are the 2019 5-year estimates data,
representing the estimates over the five-year period from 2015 to 2019. The census tracts within
the top or bottom 25% of data were classified as the high- and low-income and the racial/ethnic
minority and nonminority groups. (Figure 2) The low-income group represents the census tracts
having relatively low median household income. The racial minority group represents the census
tracts having a relatively large percentage of Black or African American population. The ethnic
minority group represents the census tracts having a relatively high ratio of persons of Hispanic
origin. The demographic data thus obtained can be compared with the assessment of the impact of
the winter storm and used to understand the disparity in experience between various income, racial,
and ethnical groups during the disaster.

 6
Figure 2 Locations of the high and low-income groups and racial/ethnic minority and nonminority
groups. High/low income (a) and minority/nonminority groups for Black (b) and Hispanic (c)
populations were identified in terms of the top 25% and bottom 25% levels, respectively, in Harris
County.

Trend classification

 Besides the statistical analysis and comparisons of spatial patterns, an agglomerative
hierarchical clustering algorithm (39) was implemented to classify neighborhood visit trends and
also to understand the patterns response by residents of a census tract to the impact of the winter
storm. The classification of POI visitation trends enables us to evaluate the variation of impacts
across subpopulations. Agglomerative clustering is a commonly used hierarchical clustering
method to group data points into clusters based on their similarity or distance. The algorithm starts
by treating each data point as a single cluster. At each iteration, the distances between every pair
of clusters in the dataset are calculated. Also, similar clusters are merged with neighboring clusters
based on the proximity until all clusters are combined into one big cluster containing all data points.
The study implements Euclidean distance to determine similarity of different clusters and uses
Ward's linkage criterion, which minimizes variance within clusters, to determine the clusters to be
merged at each iteration. In particular, Ward's linkage criterion is described as the following
expressions:
 0
 E E
 1
 ( ) = , ? A − , D ?

 A23 D23

 ( , ) = ( ) − [ ( ) + ( )]

where X and Y are two clusters, XY is the combined cluster of X and Y, and n is the number of data
points in x cluster.

Results

 After data processing and aggregation of all data at the census tract level, we assessed
community impacts due to the Texas winter storm in three aspects: power outages, burst pipes,
and food inaccessibility. The impact of power outages caused by the winter storm was assessed

 7
based on population activity data in the absence of granular power outage data. During the extreme
cold weather, the electricity demand increased, while the supply decreased significantly due to the
vulnerable power-generating facilities in Texas that were not winterized nor designed to operate
in unseasonable cold. (40) The Electric Reliability Council of Texas (ERCOT) had no choice but
to shut down the partial power grid to avoid complete failure. It is important to understand,
however, whether these outages were experienced in an equitable manner by different
subpopulations in terms of race, ethnicity, and income. In addition, this study assessed the impact
of pipe bursts according to 311 calls in Harris County related to water damage. Due to the cold
weather and limited preparedness beforehand, reports of frozen and burst water pipes were
widespread in Harris County. Food accessibility was also limited and critical during the winter
storm because of the traffic conditions. Visits to restaurants and grocery stores during the winter
storm were used to assess the impact of the winter storm on food accessibility. Through this
analysis, results based on community-scale big data from various resources were used to address
two research objectives: (1) to quantify and to evaluate the spatial patterns of the impacts and
responses of the winter storm on the community; (2) to evaluate the extent of disparities in impacts
experienced by low-income and racial/ethnic minority subpopulations. The following sections will
present and discuss the results in more detail.

Impact of Power Outages

 Without electricity, the functioning of most appliances, as well as communications, water,
and transportation may be disrupted. Thus, assessing the impact of power outages and
understanding which populations and areas are affected is critical for orderly disaster recovery;
however, despite efforts by the authors to gather fine-grained and high-resolution power outage
data to enable impact and disparity assessment, publicly accessible power outage records are not
granular enough to be used for this purpose. Thus, telemetry-based population activity data served
as a reliable proxy for examining the extent of power outages. A consequence of a power outage
may be loss of internet connectivity or persons traveling from their houses to find a power source
in an unaffected area. Activity index, a telemetry-based index provided by Mapbox, was
aggregated and used to calculate activity density (Da) at the census tract level. More than half of
the census tracts in Harris County, however, did not register enough activity to calculate activity
density during the night. Only the data between 8:00 a.m. and 8:00 p.m. were included for analysis.
Figure 3 demonstrates the activity density changes of a census tract in Harris County compared to
its baseline period. The census tracts experienced an almost 50% decrease in population activity
on February 15, 2021 then recovered to the normal state with a few fluctuations about February
22, 2021. According to the experience of a resident living in this census tract during the winter
storm, the power outage began on February 15, 2021, which coincided with the greatest dip shown
in Figure 3. The power started to recover intermittently from February 17 to February 19, 2021,
which matched the fluctuations. On and after February 20, 2021, the power was fully recovered
and the activity level began to return to normal, evident in the significant jump in activity density
between February 19 and 20, 2021.

 8
Figure 3 Changes in activity density of a census tract in Harris County, which experienced an
almost 50% decrease in population activity on February 15, 2021, when the winter storm reached,
and recovered to the normal states with a few fluctuations about February 22, 2021.

 In this study, two features of activity density, the greatest negative changes and recovery
duration, were examined to assess the impact of power outages during the storm event. Greatest
negative changes indicates the extent of the impact in each census tract. The recovery duration
indicates the length of the impact. Figure 4 shows the distribution of both features of activity
density in terms of the income, race, and ethnicity. An activity density of -1 for the greatest
negative changes feature indicates that those census tracts recorded very little activity, with the
implication being that those census tracts suffered significant power outage impacts. On the other
hand, the recovery durations of some census tracts achieved a recovery duration activity density
of 20, an assigned value indicating that those census tracts did not return back to the previous
normal state before the end of the assessment period in terms of the population activity level.
 To examine the difference in impacts on the minority and nonminority populations, this
study used the Kruskal-Wallis test, or one-way ANOVA on ranks, due to the non-normality of the
residuals. A significant test result indicates that the population median values of the minority and
nonminority populations are different. According to the test results of the six pairs of the minority
and nonminority (in terms of income, ethnicity and race) in two different assessment features (i.e.,
the greatest activity density change and recovery duration) shown in Figure 4, the median values
of low-income populations in the greatest activity density change and the median values of ethnic
minority populations in the recovery duration have considerable differences at the significance
level of p < .1. On top of that, the median values of low-income populations in greatest activity
density change are even significantly different at the significance level of p < .01. These results
indicate that the low-income populations tended to experience greater impacts, and the ethnic
minority groups (i.e., high Hispanic ratio areas) had a longer recovery time from the power outages.
Even though there is no statistical difference in the greatest activity density changes between the
minority and nonminority groups in race and ethnicity, the median values of the minority groups
are both lower than the nonminority groups. In addition, for low-income and racial/ethnic minority

 9
groups, the number of significantly impacted census tracts in terms of the greatest changes (i.e.,
the census tracts with 100% decline in population activity levels) are greater than the number of
significantly impacted census tracts for high-income and racial/ethnic nonminority groups. This
result implies that more minority census tracts were experiencing significant outages and
subsequent impacts than the nonminority census tracts. On the other hand, with respect to recovery
duration, the median value for both low-income and racial/ethnic minority categories was six days.
In addition, the statistical test results indicate that there is no significant difference in terms of the
distribution of income levels and racial minority. Therefore, the next step of the analysis focused
on the greatest negative changes in activity density to further reveal the impact of power outages
on minority and nonminority groups.
 High Income Nonminority - Black Nonminority - Hispanic
 Low Income Minority - Black Minority - Hispanic

 a p < .001 p = .146 p = .495 b p = .128 p = .147 p = .091

 Recovery Duration in Da
 Greatest Changes in Da

 Income Black Hispanic Income Black Hispanic
 Populations Populations Populations Populations

Figure 4 Distribution of the greatest changes (a) and recovery duration (b) in activity density for
different income and racial/ethnic groups. Results show that census tracts having more low-income
or minority groups were experiencing significant impacts in terms of the extent (more negative
changes) and duration (longer recovery duration) of the power outages than census tracts having
high-income and nonminority groups.
 Of the 786 census tracts in Harris County, and about 13.5% (106) were significantly
impacted by power outages, which were identified by very low population activities. Figure 5
depicts the comparison between all census tracts in Harris County and the significantly impacted
census tracts from low-income and racial/ethnic minority groups. The median household income
of the significantly impacted census tracts is $40,853 USD, which is lower than the $56,429 USD
median income of Harris County. The median ratio of persons identifying as Black in the
significantly impacted census tracts is 20.43%, which is higher than the 12.01%, the Harris County
median. The median ratio of persons identifying as Hispanic in the significantly impacted census
tracts is approximately 43.58%, which is higher than the 38.01% the Harris County median.
Statistical tests between all census tracts in Harris County and the significantly impacted census
tracts from low-income and racial/ethnic minority groups indicate that the median values between
the three pairs are all significant at a significance level of p = .1. In addition, the p-values of the
low-income and racial minority groups are both less than 0.05. Thus, based on the results, the
significantly impacted census tracts are likely to include census tracts with a greater proportion of
lower-income and racial/ethnic minority residents than in higher-income, nonminority tracts.

 10
These results indicate social inequality in the implementation managed power outage during the
Texas winter storm.
 a Sig. Impacted All
 b Sig. Impacted All
 c Sig. Impacted All

 p < .001 p = .004 p = .068
Number of CTs

 Median Household Income Black Population Ratio Hispanic Population Ratio

Figure 5 Comparison between all census tracts (CTs) and significantly impacted census tracts due
to power outages in Harris County from the aspects of income, race, and ethnicity. The
significantly impacted census tracts tend to have lower median income and higher median ratios
of Black and Hispanic populations than the medians of Harris County.

 Despite the results showing that the higher the percentage of minority population, the more
likely a census tract is to be more strongly impacted, exceptions always exist. A census tract with
a median household income of $32,285 USD, Hispanic population ratio of 94.15%, and Black
population ratio of 4.2% with 30.07% of races other than White and Black population, was not
impacted, according to population activity changes. The activity density of this tract was never
lower than that of its pre-disaster normal states. In contrast, a census tract with median household
income of $226,602 USD, White population of 94.29%, and non-Hispanic population of 95.08%,
had about a 40% decrease in activity density, indicating that the census tract experienced impacts
due to power outages. Although the fact that the exceptions exist, census tracts having low-income
and racial/ethnic minority groups tend to experience greater impacts due to the greater extent and
duration of the power outages.

Impact of Burst Pipes
 To analyze the condition of water services, this study filtered 311 Houston Service Helpline
call data on burst pipes based on their service types, such as water leaks, flooding, potable water
availability, and poor drainage. As shown in Figure 6, a noticeable spike in 311 water-related case
numbers during the impact period of the winter storm can be observed. High volumes of the 311
water-related calls in a census tract may indicate burst-pipe issues due to freezing temperatures.
During the impact period of the winter storm, about 67% of the census tracts in Harris County
registered water-related 311 cases. Figure 6 also shows the numbers of census tracts receiving the
most 311 calls (or case peaks) on each date. Most of the census tracts had case peaks on February
18 and 19, 2021.

 11
Number of 311 calls Winter Storm
 Number of CTs Receiving 311 Calls

 1,750
 Number of 311 Calls

 1,500

 Number of CTs
 1,250

 1,000

 750

 500

 250

 Feb 1 Feb 5 Feb 9 Feb 13 Feb 17 Feb 21 Feb 25 Mar 1
 Date (2021)

Figure 6 Numbers of the 311 water-related calls (blue) and numbers of census tracts receiving the
most water-related calls (orange) during February 2021. Numbers of water-related 311 calls surged
after the winter storm reached indicating Harris County underwent burst pipe issues due to freezing
temperatures.
 Multiple analyses were conducted to understand the impact of burst pipes in minority
categories; however, differences in population and area may result in a misunderstanding of results.
The greater the population in a census tract, statistically, the more 311 calls from that census tract.
Furthermore, a larger census tract area would contain more pipes. To account for the variance
among census tracts with respect to population and area, the case peaks of each census tract were
normalized by dividing by their population and area. The distribution of the case peaks per area
per person for the low-income and racial/ethnic minority groups is shown in Figure 7. The p-values
of the statistical test of the differences between the high- and low-income groups and the
racial/ethnical minority and nonminority groups are less than 0.05, indicating that the medians of
each pair are significantly different. Based on the results, the low-income and racial minority
groups had higher normalized case peaks than the high-income and racial nonminority groups.
Also, given that a census tract receiving zero 311 calls indicates that a census tract is not impacted
by burst pipes, twice as many high-income and racial nonminority census tracts were unimpacted
compared with low-income and racial minority groups. This result indicates that low-income and
racial minority groups tend to have more 311 calls than the high-income and racial nonminority
groups and may suffer more from critical burst pipeline.
 A comparison between all census tracts and the impacted census tracts in Harris County
was also performed (Figure 8). The comparison for low-income and racial minority groups
demonstrates that the differences between all census tracts and impacted census tracts are
statistically significant at the significance level of p = .05. The median income of Harris County is
$56,429 USD, whereas the median income of the impacted census tracts is $50,589 USD. Also,
the median percentage of persons identifying as Black within Harris County is 12.01%; in
impacted census tracts is, it is 14.13%. Thus, the census tracts impacted by the burst pipes tend to
have lower household income and a higher ratio of Black population.

 12
Figure 7 Distribution of the 311 call peaks per area per person for income and race/ethnicity groups
and numbers of unimpacted census tracts. Census tracts having more low-income and racial
minority groups tend to have higher call peaks per area per person and less unimpacted census
tracts.

Figure 8 Comparison between all census tracts and the impacted census tracts due to pipe bursts
in Harris County from the aspects of income, race, and ethnicity. The impacted census tracts have
a lower median income and higher median ratios of Black and Hispanic populations, indicating
that the low income and high ratio of Black populations census tracts experienced greater impacts
of pipe bursts during the winter storm.

 13
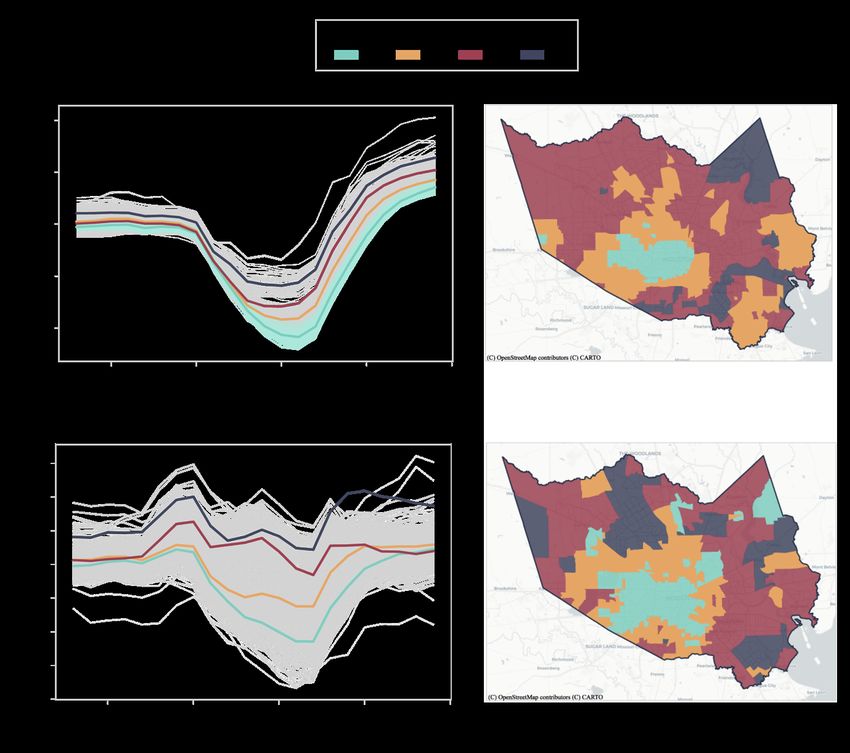
Overall, the 311 data spike indicates that burst pipe issues impacted a large portion of
Harris County residents. About 67% of the census tracts requested maintenance on water-related
problems. In particular, census tracts with lower-income and higher percentage of Black
population are impacted more by burst pipes compared to that with higher-income and lower
percentage of Black population. The comparison between all census tracts and the impacted census
tracts shows that the impacted census tracts have lower median household income and a higher
ratio of Black population. Thus, low income and high percentage of Black population census tracts
experienced more burst pipes during the winter storm. This result indicates the disparities in the
experience of extreme weather conditions, such as the winter storm, on vulnerable populations
(e.g., low-income and racial minority groups).

Impact of Food Inaccessibility
 In particular, this study obtained data of grocery store and restaurant visits from SafeGraph
to reveal fluctuations in food accessibility during the winter storm. Unlike the relationship between
activity density and power outages, the food accessibility of a census tract has connections with
adjacent census tracts. For example, a resident of one census tract may prefer to buy groceries from
a store in a neighboring census tract. Therefore, this study adopted the agglomerative hierarchical
clustering algorithm to classify visit trends of census tracts. The advantage of applying this
algorithm is that census tracts having similar visit trends can be discovered and grouped to
understand the impact of food inaccessibility. Figure 9 shows the classification results of the
restaurant and grocery visits in Harris County for every census tract. The census tracts in Harris
County are split into four classes, and the trend of each class is represented by the mean of all
grouped census tracts. The four classes, from a through d, represent four patterns of visit trends
from the most impacted class to the least impacted class, respectively. An example trend line of
class a (Figure 9a) is the average of the grouped census tracts (the lighter lines behind trend line
of class a) and represents the visit fluctuations of class a.

 14
Figure 9 Spatiotemporal distribution of the restaurant (a and b) and grocery store (c and d) visits
in Harris County. Four classes, from Class a through Class d, represent four patterns of visit trends
from the most impacted class to the least impacted class, respectively. Trend line is the average of
a group of census tracts having similar patterns and represents the visit fluctuations of these census
tracts. The most impacted areas (Class a) of the restaurant and grocery store visits are close to
Houston's downtown areas.
 The study classified different visit trends for the restaurants and grocery stores in Harris
County and presented the spatial distribution of each visit trend in Figure 9. For both types of POIs,
class a represents the most impacted census tracts in terms of visitor numbers. In contrast, class d
shows the least impacted census tracts. For the restaurant visit trends, the shapes of the four classes
are almost identical except for the magnitude of the impact level (Figure 9a). Visit trends started
to decrease on February 11, 2021 and showed the most significant dips February 16 through
February 17, 2021. On the other hand, the shapes of the grocery store visit trends (Figure 9c) are
not perfectly identical but demonstrate similar patterns during the winter storm. The grocery store
visits had one major and one minor increase before the storm (February 15, 2021), which shows
the preparedness for the winter storm. The largest dips in visits for the grocery stores were on
February 18, 2021, and they returned to previous normal states afterward. Overall, the locations of

 15
the most impacted areas of both grocery store and restaurant points of interest are close to
Houston’s downtown areas, which is to be expected since the downtown areas are where people
work rather than where they live. Due to the weather and traffic, a population would tend to avoid
traveling to work and thus lead to fewer visits to business areas compared to the other areas. In
addition, most of the secondary impacted areas (class b) are census tracts that surround census
tracts identified as class a (Figure 9b and Figure 9d). By evaluating the spatial distribution of the
visit trends, the most impacted regions in terms of food accessibility can be identified in areas
surrounding the inner part of Harris County.
 In the next step, the relationships between food accessibility and the three sub-population
categories were evaluated. Subpopulation categories may experience food inaccessibility. For
example, when public transportation services were suspended, a low-income household who
cannot afford a self-owned vehicle might be unable to travel to grocery stores due to a lack of
viable transportation. Figure 10 shows the relationship between the four food accessibility classes
and the three minority categories. The most impacted census tracts (census tracts identified as class
a) regarding restaurant and grocery store visits tend to have larger nonminority populations than
the other three classes (classes b, c, and d). This result may be due to the fact that these census
tracts are primarily located in the downtown area of Houston, which attracts a more affluent
population. Due to a reduced downtown workforce during the storm, visits to restaurants and
grocery stores experienced decreased. On the other hand, the median income for the secondary
impacted census tracts (census tracts identified as class b) is relatively lower than the other three
classes (classes a, c, and d), and the median ratio of Black and Hispanic populations for the
secondary impacted census tracts (census tracts identified as class b) is somewhat higher than the
other three classes (classes a, c, and d). This result indicates that those census tracts classified as
the secondary impacted classes have a lower income and a high ratio of Black and Hispanic
populations. Therefore, the census tracts with low-income and racial/ethnic minority groups were
likely to have food accessibility issues.

Figure 10 Relationships between food accessibility classes and income and racial/ethnic minority
groups. Results show that the secondary impacted census tracts generally have lower median
income and higher median ratios of Black and Hispanic populations.

Discussions and Closing Remarks
 In this study, community-scale big data from various sources were used to quantify and
assess the spatial patterns of the responses and impacts of the winter storm. The quantified impacts
of managed power outages, burst pipes, and food accessibility were then applied to examine the
extent of disparities in impacts experienced by low-income and racial/ethnic minority

 16
subpopulations. This study used the impact of Texas Winter Storm Uri in February 2021, an
unusual extreme weather event, on Harris County (Texas) as a case study. Critical infrastructures,
such as power-generating equipment, highways, and the water distribution system, were not well-
prepared to withstand a winter storm of Uri’s magnitude. During this critical situation, power-
generation plant operators were forced to interrupt services to avoid severely damaging the entire
power grid. For example, because power demand increased due to the load imposed by home
heating, and power supply decreased due to unwinterized power equipment, ERCOT needed to
shut down partial power and implement rotating power outages to protect the power grid. It is vital
to understand the extent to which these managed power outages were done in an equitable way for
different subpopulations. To assess such potential disparate impacts, authors made a strong effort
to obtain granular and high-resolution power outage data by contacting respectable organizations.
Yet much data was not publicly available at the time the authors analyzed the issues. In this case,
lack of publicly available data provides an opportunity to demonstrate the value of using this
community-scale big data for rapid impact assessments. Given that these data become available in
the future, results could be further verified and discussed.
 Results in all three aspects—impacts of power outages, pipe bursts, and food
accessibility—indicate the disparities in the experience of extreme weather conditions on
vulnerable populations. For power outages and food accessibility, results show that census tracts
having larger percentages low-income and racial/ethnic minority groups tend to have been more
strongly disrupted by the winter storm. Also, the impact assessment results of burst pipes
demonstrate that low-income and racial minority groups are more heavily disrupted than high-
income and racial nonminority groups. Impacts of power outages in this winter storm indicate how
infrastructure operators respond to an unusual event. Even though ruggedization of power
equipment cannot be accomplished in a short time, the infrastructure operator can make plans for
extreme weather scenarios within the considerations of social vulnerability prior to a disaster and
inform residents about predetermined hours or days that each area could expect outages when a
disaster reaches. In this way, people can be better prepared. Impacts of burst pipes indicate limited
awareness and preparedness of infrastructure owners and residents. Given that temperatures below
freezing were predicted, actions can be taken to protect pipes. Impacts of food inaccessibility
indicate the influences of service disruptions of critical infrastructures, such as public
transportation, road networks, grocery stores, and restaurants.
 The disparate impacts revealed in this study can raise awareness in infrastructure managers
to take equitable resilience seriously. Service providers should prepare mitigation plans for
emergency response and account for these revealed disparities. Rapid assessment results in this
study demonstrate that community-scale big data can serve as a tool for local agencies to
understand the impact of past severe weather events so that a more equitable allocation of resources
can be planned before the arrival of next disaster.

Data availability
The data that support the findings of this study are available from Mapbox, SafeGraph, and 311,
but restrictions apply to the availability of these data, which were used under license for the current
study. The data can be accessed upon request submitted on Mapbox and SafeGraph. Other data we
use in this study are all publicly available.

 17
Code availability
The code that supports the findings of this study is available from the corresponding author upon
request.

References
1. Coronese, M., F. Lamperti, K. Keller, F. Chiaromonte, and A. Roventini. Evidence for Sharp
 Increase in the Economic Damages of Extreme Natural Disasters. Proceedings of the
 National Academy of Sciences, Vol. 116, No. 43, 2019, pp. 21450–21455.
 https://doi.org/10.1073/pnas.1907826116.
2. Kryvasheyeu, Y., H. Chen, N. Obradovich, E. Moro, P. Van Hentenryck, J. Fowler, and M.
 Cebrian. Rapid Assessment of Disaster Damage Using Social Media Activity. Science
 Advances, Vol. 2, No. 3, 2016, p. e1500779. https://doi.org/10.1126/sciadv.1500779.
3. Stocker, T., Ed. Climate Change 2013: The Physical Science Basis: Working Group I
 Contribution to the Fifth Assessment Report of the Intergovernmental Panel on Climate
 Change. Cambridge University Press, New York, 2014.
4. Fan, C., and A. Mostafavi. A Graph-Based Method for Social Sensing of Infrastructure
 Disruptions in Disasters. Computer-Aided Civil and Infrastructure Engineering, Vol. 34, No.
 12, 2019, pp. 1055–1070. https://doi.org/10.1111/mice.12457.
5. Kim, J., and M. Hastak. Online Human Behaviors on Social Media During Disaster
 Responses. The Journal of the NPS Center for Homeland Defense and Security, 2017.
6. Lu, L., X. Wang, Y. Ouyang, J. Roningen, N. Myers, and G. Calfas. Vulnerability of
 Interdependent Urban Infrastructure Networks: Equilibrium after Failure Propagation and
 Cascading Impacts: Vulnerability of Interdependent Urban Infrastructure Networks.
 Computer-Aided Civil and Infrastructure Engineering, Vol. 33, No. 4, 2018, pp. 300–315.
 https://doi.org/10.1111/mice.12347.
7. Panteli, M., and P. Mancarella. Influence of Extreme Weather and Climate Change on the
 Resilience of Power Systems: Impacts and Possible Mitigation Strategies. Electric Power
 Systems Research, Vol. 127, 2015, pp. 259–270. https://doi.org/10.1016/j.epsr.2015.06.012.
8. Fothergill, A., E. G. M. Maestas, and J. D. Darlington. Race, Ethnicity and Disasters in the
 United States: A Review of the Literature. Disasters, Vol. 23, No. 2, 1999, pp. 156–173.
 https://doi.org/10.1111/1467-7717.00111.
9. Donner, W., and H. Rodríguez. Population Composition, Migration and Inequality: The
 Influence of Demographic Changes on Disaster Risk and Vulnerability. Social Forces, Vol.
 87, No. 2, 2008, pp. 1089–1114. https://doi.org/10.1353/sof.0.0141.
10. Hong, B., B. J. Bonczak, A. Gupta, and C. E. Kontokosta. Measuring Inequality in
 Community Resilience to Natural Disasters Using Large-Scale Mobility Data. Nature
 Communications, Vol. 12, No. 1, 2021, p. 1870. https://doi.org/10.1038/s41467-021-22160-
 w.
11. Morss, R. E., O. V. Wilhelmi, G. A. Meehl, and L. Dilling. Improving Societal Outcomes of
 Extreme Weather in a Changing Climate: An Integrated Perspective. Annual Review of
 Environment and Resources, Vol. 36, No. 1, 2011, pp. 1–25. https://doi.org/10.1146/annurev-
 environ-060809-100145.

 18
12. Bolin, B., and L. C. Kurtz. Race, Class, Ethnicity, and Disaster Vulnerability. In Handbook
 of Disaster Research (H. Rodríguez, W. Donner, and J. E. Trainor, eds.), Springer
 International Publishing, Cham, pp. 181–203.
13. Elliott, J. R., and J. Pais. Race, Class, and Hurricane Katrina: Social Differences in Human
 Responses to Disaster. Social Science Research, Vol. 35, No. 2, 2006, pp. 295–321.
 https://doi.org/10.1016/j.ssresearch.2006.02.003.
14. Reid, M. Disasters and Social Inequalities. Sociology Compass, Vol. 7, No. 11, 2013, pp.
 984–997. https://doi.org/10.1111/soc4.12080.
15. Peacock, W. G., S. V. Zandt, Y. Zhang, and W. E. Highfield. Inequities in Long-Term
 Housing Recovery After Disasters. Journal of the American Planning Association, Vol. 80,
 No. 4, 2014, pp. 356–371. https://doi.org/10.1080/01944363.2014.980440.
16. Mostafavi, A. A System-of-Systems Framework for Exploratory Analysis of Climate Change
 Impacts on Civil Infrastructure Resilience. Sustainable and Resilient Infrastructure, Vol. 3,
 No. 4, 2018, pp. 175–192. https://doi.org/10.1080/23789689.2017.1416845.
17. Coleman, N., A. Esmalian, and A. Mostafavi. Equitable Resilience in Infrastructure Systems:
 Empirical Assessment of Disparities in Hardship Experiences of Vulnerable Populations
 during Service Disruptions. Natural Hazards Review, Vol. 21, No. 4, 2020, p. 04020034.
 https://doi.org/10.1061/(ASCE)NH.1527-6996.0000401.
18. Podesta, C., N. Coleman, A. Esmalian, F. Yuan, and A. Mostafavi. Quantifying Community
 Resilience Based on Fluctuations in Visits to Points-of-Interest Derived from Digital Trace
 Data. Journal of The Royal Society Interface, Vol. 18, No. 177, 2021, p. rsif.2021.0158,
 20210158. https://doi.org/10.1098/rsif.2021.0158.
19. Zhang, C., W. Yao, Y. Yang, R. Huang, and A. Mostafavi. Semiautomated Social Media
 Analytics for Sensing Societal Impacts Due to Community Disruptions during Disasters.
 Computer-Aided Civil and Infrastructure Engineering, Vol. 35, No. 12, 2020, pp. 1331–1348.
 https://doi.org/10.1111/mice.12576.
20. Li, Q., Z. Tang, N. Coleman, and A. Mostafavi. Detecting Early-Warning Signals in Time
 Series of Visits to Points of Interest to Examine Population Response to COVID-19 Pandemic.
 IEEE Access, Vol. 9, 2021, pp. 27189–27200.
 https://doi.org/10.1109/ACCESS.2021.3058568.
21. Fan, C., C. Zhang, A. Yahja, and A. Mostafavi. Disaster City Digital Twin: A Vision for
 Integrating Artificial and Human Intelligence for Disaster Management. International
 Journal of Information Management, Vol. 56, 2021, p. 102049.
 https://doi.org/10.1016/j.ijinfomgt.2019.102049.
22. Resch, B., F. Usländer, and C. Havas. Combining Machine-Learning Topic Models and
 Spatiotemporal Analysis of Social Media Data for Disaster Footprint and Damage
 Assessment. Cartography and Geographic Information Science, Vol. 45, No. 4, 2018, pp.
 362–376. https://doi.org/10.1080/15230406.2017.1356242.
23. Ragini, J. R., P. M. R. Anand, and V. Bhaskar. Big Data Analytics for Disaster Response and
 Recovery through Sentiment Analysis. International Journal of Information Management,
 Vol. 42, 2018, pp. 13–24. https://doi.org/10.1016/j.ijinfomgt.2018.05.004.
24. Fan, C., F. Wu, and A. Mostafavi. A Hybrid Machine Learning Pipeline for Automated
 Mapping of Events and Locations From Social Media in Disasters. IEEE Access, Vol. 8, 2020,
 pp. 10478–10490. https://doi.org/10.1109/ACCESS.2020.2965550.

 19
25. Xiao, Y., Q. Huang, and K. Wu. Understanding Social Media Data for Disaster Management.
 Natural Hazards, Vol. 79, No. 3, 2015, pp. 1663–1679. https://doi.org/10.1007/s11069-015-
 1918-0.
26. Fan, C., M. Esparza, J. Dargin, F. Wu, B. Oztekin, and A. Mostafavi. Spatial Biases in
 Crowdsourced Data: Social Media Content Attention Concentrates on Populous Areas in
 Disasters. Computers, Environment and Urban Systems, Vol. 83, 2020, p. 101514.
 https://doi.org/10.1016/j.compenvurbsys.2020.101514.
27. Morstatter, F., J. Pfeffer, H. Liu, and K. Carley. Is the Sample Good Enough? Comparing
 Data from Twitter’s Streaming API with Twitter’s Firehose. Proceedings of the International
 AAAI Conference on Web and Social Media, Vol. 7, No. 1, 2013.
28. Li, Q., L. Bessell, X. Xiao, C. Fan, X. Gao, and A. Mostafavi. Disparate Patterns of
 Movements and Visits to Points of Interest Located in Urban Hotspots across US
 Metropolitan Cities during COVID-19. Royal Society Open Science, Vol. 8, No. 1, 2021, p.
 201209. https://doi.org/10.1098/rsos.201209.
29. Juhasz, L., and H. Hochmair. Studying Spatial and Temporal Visitation Patterns of Points of
 Interest Using SafeGraph Data in Florida. GIS Center, 2020.
 https://doi.org/10.1553/giscience2020_01_s119.
30. Yuan, F., Y. Yang, Q. Li, and A. Mostafavi. Unraveling the Temporal Importance of
 Community-Scale Human Activity Features for Rapid Assessment of Flood Impacts.
 arXiv:2106.08370 [physics], 2021.
31. Gao, X., C. Fan, Y. Yang, S. Lee, Q. Li, M. Maron, and A. Mostafavi. Early Indicators of
 Human Activity During COVID-19 Period Using Digital Trace Data of Population Activities.
 Frontiers in Built Environment, Vol. 6, 2021. https://doi.org/10.3389/fbuil.2020.607961.
32. Almasy, S., H. Silverman, and J. Sutton. More than 150 Million Americans under Winter
 Weather Alerts as Record Cold Temps Make Life Miserable. CNN, February 16, 2021.
33. Freedman, A., J. Muyskens, and J. Samenow. Central States’ Arctic Plunge: The Historic
 Cold Snap and Snow by the Numbers. Washington Post, February 24, 2021.
34. Mulcahy, S. At Least 111 People Died in Texas during Winter Storm, Most from
 Hypothermia. The Texas Tribune, March 25, 2021.
35. Texas Health and Human Services News Updates: Winter Storm-Related Deaths.
 https://web.archive.org/web/20210526151612/https://dshs.texas.gov/news/updates.shtm#w
 n. Accessed June 11, 2021.
36. Cappucci, M. 133-Car Pileup on Fort Worth Highway during Freezing Rain Leaves at Least
 6 Dead. Washington Post, February 11, 2021.
37. Ferman, M. Winter Storm Could Cost Texas More Money than Any Disaster in State History.
 The Texas Tribune, February 25, 2021.
38. Watson, K. P., R. Cross, M. P. Jones, G. Buttorff, P. Pinto, S. L. Sipole, and A. Vallejo. The
 Effects of the Winter Storm of 2021 in Harris County. Hobby School of Public Affairs,
 University of Houston.
39. Hastie, trevor, R. Tibshirani, and J. Friedman. The Elements of Statistical Learning: Data
 Mining, Inference, and Prediction. Springer.
40. McCullough, E. D., Kate McGee and Jolie. Texas Leaders Failed to Heed Warnings That
 Left the State’s Power Grid Vulnerable to Winter Extremes, Experts Say. The Texas Tribune.
 https://www.texastribune.org/2021/02/17/texas-power-grid-failures/. Accessed July 28,
 2021.

 20
You can also read


