Analysis of Historical Climate and Climate Projection for Bhutan - NATIONAL CENTER FOR HYDROLOGY AND METEOROLOGY ROYAL GOVERNMENT OF BHUTAN 2019 ...
←
→
Page content transcription
If your browser does not render page correctly, please read the page content below
Analysis of Historical Climate
                                                  and Climate Projection for Bhutan

                                                NATIONAL CENTER FOR HYDROLOGY AND METEOROLOGY
NATIONAL CENTER FOR HYDROLOGY AND METEOROLOGY
                                                         ROYAL GOVERNMENT OF BHUTAN
          ROYAL GOVERNMENT OF BHUTAN
                 www.nchm.gov.bt                                    2019
             ISBN: 978-99980-862-0-3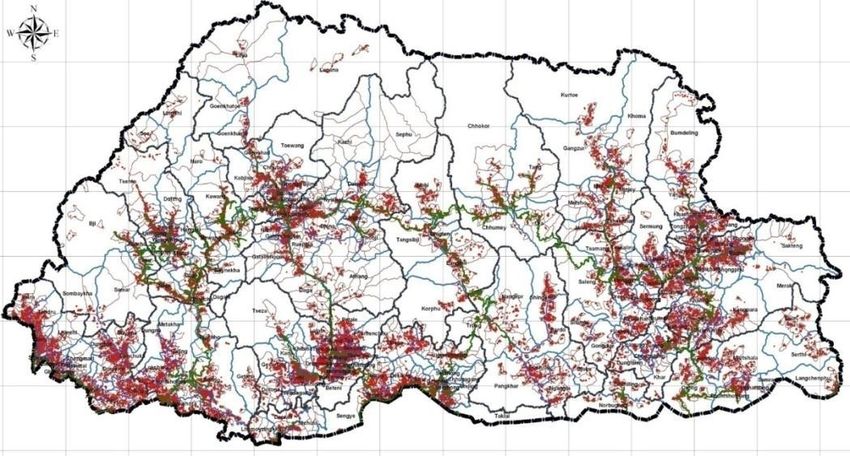
REPORT ON THE
ANALYSIS OF HISTORICAL CLIMATE AND
  CLIMATE PROJECTION FOR BHUTAN

NATIONAL CENTER FOR HYDROLOGY AND METEOROLOGY
         ROYAL GOVERNMENT OF BHUTAN
                     2019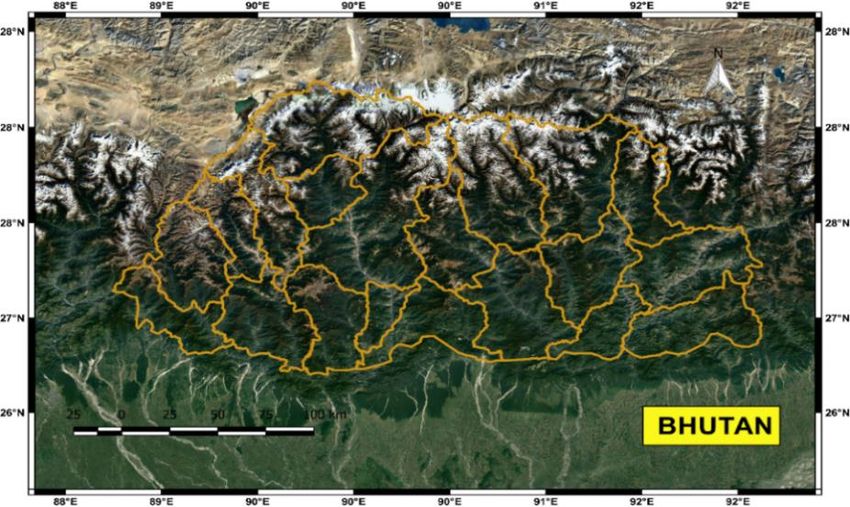
Prepared by:
Tshencho Dorji, WCSD, NCHM
Tayba Buddha Tamang, WCSD, NCHM

Reviewers:
Dr G Srinivasan
Chief Scientist, Climate Applications
Regional Integrated Multi-Hazard Early Warning System
Asian Institute of Technology campus
Pathum Thani 122120, Thailand

Dr Srivatsan V Raghavan
Sr. Researcher
Tropical Marine Science Institute
National University of Singapore
18 Kent Ridge Road, Singapore 119227

Dr Singay Dorji
Chief
Weather and Climate Services Division
National Center for Hydrology and Meteorology
Royal Government of Bhutan, Thimphu

Published by:
National Center for Hydrology and Meteorology
Royal Government of Bhutan
PO Box: 2017
Thimphu, Bhutan

ISBN#:978-99980-862-0-3

© National Center for Hydrology and Meteorology

Printed @ United Printing Press, Thimphu

Foreword
Bhutan is highly vulnerable to the impacts of climate change. Bhutan is already facing the impacts
of climate change such as extreme weather and changing rainfall patterns. The Royal Government
of Bhutan (RGoB) recognizes the devastating impacts climate change can cause to the country’s
natural resources, livelihood of the people and the economy. Bhutan is committed to addressing
these challenges in the 12th Five Year Plan (2018-2023) through various commitments, mitigation
and adaption plans and actions on climate change at the international, national, regional levels.
Bhutan has also pledged to stay permanently carbon neutral at the Conference of Parties (COP)
Summit on climate change in Copenhagen.
Accurate, reliable and timely hydro-meteorological information underpins the understanding of
weather and climate change. The National Center for Hydrology and Meteorology (NCHM) is the
national focal agency responsible for studying, understanding and generating information and
providing services on weather, climate, water, water resources and the cryosphere. The service
provision of early warning information is one of the core mandates of NCHM that helps the nation
to protect lives and properties from the impacts of climate change.
The Strategic Program for Climate Resilience (SPCR) which is being implemented by Gross
National Happiness Commission (GNHC) focuses on four main pillars. The pillars are:
Enhancing information base for hydro-met services and climate resilience
Preparedness, food and water security
Sustainable growth and resilient infrastructure
Strengthening governance, institutional coordination and human resource capacity
NCHM is one of the four technical agencies under the SPCR and it is responsible for undertaking
a technical study under the Pillar I- Enhancing Information Base Hydro-met Services and Climate
Resilience. The fundamental objective of the study is to improve hydro-met base information and
identify future investment plans. The list of studies carried out under the Pillar I of SPCR are as
follows:
Analysis of historical climate and climate change projection for Bhutan
Re-assessment of potentially dangerous lakes of Bhutan
Bhutan glacier inventory 2018
The study on Historical Climate Data Analysis and Climate Change Projection for Bhutan
discusses data and methods used to study the past and future climate change projections for Bhutan.
The findings of the study indicate possible future increases in temperature and rainfall for Bhutan
under future climate scenarios based on Representative Concentration Pathways (RCP 4.5 and
RCP 8.5).
This report is submitted by NCHM to GNHC and to the World Bank under the SPCR Project. The
findings from this study provide initial assessments of possible future changes of climate over
Bhutan. In this regard, I would like to thank all the Divisions, the SPCR Management of NCHM
who have worked hard to bring out this report.
(Karma Dupchu)
Director
i
Acknowledgement
The NCHM would like to thank the Gross National Happiness Commission, Royal Government
of Bhutan and the World Bank for selecting NCHM as one of the lead technical agencies to
implement the activities of the Pillar I of SPCR Project. The Center thanks the GNHC, the World
Bank and all stakeholders for the support during the course of the studies under the SPCR Project.
The Center thanks Dr. Srivatsan V Raghavan and his colleagues at the Tropical Marine Science
Institute, National University of Singapore for the technical guidance. Thanks to the Regional
Integrated Multi-Hazard Early Warning System (RIMES) for Africa and Asia for the technical
guidance and giving the Center access to the Climate Data Access and Analysis System (CDAAS).
The Center would also like to thank the Divisions and in particular, the Project Manager, SPCR
and his technical team members of the Center for their contribution to this report.

                                                ii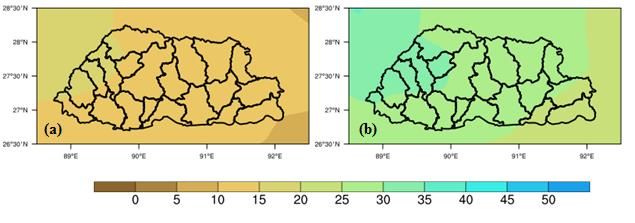
Executive Summary
Bhutan’s economy is highly dependent on climate-sensitive sectors such as agriculture,
hydropower, and forestry. The most significant impact of climate change in Bhutan is the
formation of supra-glacial lakes due to the accelerated retreat of glaciers with increasing
temperatures. Other impacts include extreme weather, changing rainfall, drying of streams, and
flash floods. The Fifth Assessment Report (AR5) of the Intergovernmental Panel on Climate
Change (IPCC) projects an increase of about 4.8 °C in global mean surface temperature by the end
of the century. IPCC indicated that much more studies on climate change are required especially
at the regional and national levels. There is a requirement for climate change information at high
temporal and spatial scales for impact studies over Bhutan such as flooding, drought, agriculture,
health, energy and socio-economic changes. Unlike most of the developed countries, climate
sciences and climate research remains a challenge for Bhutan. It is limited by lack of available
historical climate data, dense and robust observational network, resources, model and
computational facilities, technology and capacity to undertake climate research.
Scope and objectives
This study is a contribution to the Strategic Program for Climate Resilience (SPCR) that describes
possible future climate changes over Bhutan. The results and findings from this study offer a
glimpse of expected changes in the future for long term adaptation planning, which could be useful
to the Government, policymakers, stakeholders and other interested end-users.
The objectives of the study are:
   i.      To assess and analyse the observed or historical climate trends over Bhutan
   ii.     To assess how the climate has been varying: temperature and precipitation-annual and
           seasonal trends
   iii.    To project future climate changes over Bhutan using downscaled regional climate
           model data
   iv.     To identify future investment plans
Approach and Findings
The Fifth Phase of the Coupled Model Inter-comparison Project (CMIP5) comprises state-of-the-art
coupled global models developed by different climate modelling groups around the world. In this
study, ensemble of five global climate models of CMIP5 were chosen to analyse future temperature
and rainfall changes over Bhutan. Multi-model ensemble (MME) is believed to be superior to
individual global climate models as it provides a bandwidth of climate responses to be considered for
climate adaptation. The GCMs selected in this study comprise the empirically downscaled NASA
(National Aeronautics and Space Administration) Earth Exchange Global Daily Downscaled
Projections (NEX-GDDP) dataset (https://cds.nccs.nasa.gov/nex-gddp/). The datasets contain
downscaled climate scenarios for the globe that are derived from the General Circulation Model
(GCM) runs conducted under the CMIP5 and across two of the four greenhouse gas emissions
scenarios known as Representative Concentration Pathways (RCPs). The NEX-GDDP datasets
include downscaled projections for RCP 4.5 and RCP 8.5 from the 21 models and scenarios for
which daily scenarios were produced and distributed under CMIP5. Each of the climate projections
include daily maximum temperature, minimum temperature, and precipitation for the periods from
1950 through to 2100. The spatial resolution of the dataset is 0.25 degrees (~25 km x 25 km). The
NEX-GDDP dataset is provided freely to help the science community in conducting studies of

                                                 iii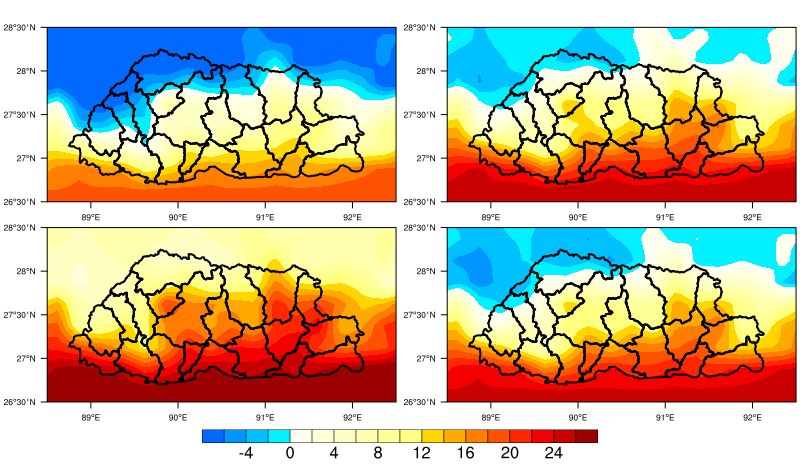
climate change impacts at local to regional scales, and to improve public understanding of possible
future global climate patterns at the spatial scale of individual towns, cities, and watersheds.
It is to be noted that the models in this study were selected based on the list of NEX-GDDP datasets
given in the Climate Data Access and Analysis System (CDAAS) of Regional Integrated for Multi-
Hazard Early Warning System (RIMES), Bangkok for South Asia. No specific ranking of GCMs
or detail evaluation of these models were performed over the study region. The exhaustive
assessment of each of the 5 models is out of the scope of this study and such assessment might
differ from the findings of this study. Therefore, it is recommended for interested parties to use the
results of the study considering a wider range of climate uncertainties.
The climate projections for Bhutan has been assessed over the two future climate periods, 2021-
2050 and 2070-2100, under the climate change scenarios, the RCP 4.5 and RCP 8.5.
The findings from the analysis of historical climate indicated an increasing trend in temperature
both at mean seasonal and mean annual scales and a decreasing trend in rainfall at mean annual
scales. The rainfall indicated a larger variability.
Under the RCP 4.5 scenario, the climate projection for surface temperature indicates an increase
of about of 0.8oC – 1.6oC during 2021-2050 (representing the 2030s mid-term climate change
scenario) and about 1.6o C – 2.8oC towards the end of the century (2070-2099). Overall the climate
projection of surface temperature under the RCP4.5 scenario indicated an increase in about of
0.8oC – 2.8oC during 2021-2100. Higher values are projected under the RCP 8.5 scenario with
climate projection for surface temperature indicated increase of about 0.8oC to more than 3.2o C
towards the end of the century.
The mean annual rainfall over Bhutan is likely to increase in the future. Under the RCP 4.5
scenario, the mean annual rainfall over Bhutan indicates an increase of about 10%-30% on the
mean annual scale, with summer (JJAS) rainfalls between 5% - 15 %. Under the RCP 8.5 scenario,
the mean annual rainfall indicates an increase of about 10% - 20% during 2021-2050 and with
more than 30% increase all over Bhutan towards the end of the century (2070-2100). Under both
scenarios, there is an indication of a marginal increase in rainfall trend.

                                                 iv
CONTENTS
Foreword ......................................................................................................................................... i
Acknowledgement ......................................................................................................................... ii
Executive Summary ..................................................................................................................... iii
List of Figures .............................................................................................................................. vii
List of Table .................................................................................................................................. ix
Glossary of Acronyms................................................................................................................... x
1.     INTRODUCTION................................................................................................................. 1
     1.2     Region Overview: Bhutan ................................................................................................ 1
     1.3     Climate Controls .............................................................................................................. 1
       1.3.1        Seasons ...................................................................................................................... 2
     1.4     Impacts of Climate Variability and Change ..................................................................... 2
     1.5     The rationale of the study ................................................................................................. 3
2.     DATA AND METHODS ...................................................................................................... 5
     2.2     Observed data: Surface data of Bhutan 1996-2017 .......................................................... 5
     2.3     Observed data: CRU TS 3.2.3 .......................................................................................... 5
     2.4     Model dataset: NASA data BCSD ................................................................................... 6
     2.5     Climate variables and parameters .................................................................................... 7
3.     ANALYSIS OF HISTORICAL DATA ............................................................................... 8
     3.1     Overview of the climatology of Bhutan ........................................................................... 8
     3.2     Selection of CRU data for analysis .................................................................................. 9
     3.3     Spatial distribution of annual mean temperature............................................................ 11
     3.4     Spatial distribution of annual mean rainfall ................................................................... 12
4.     CLIMATE CHANGE PROJECTION .............................................................................. 14
     4.1     Model Selection.............................................................................................................. 14
     4.2     RCP Scenario Selection ................................................................................................. 14
     4.3     Climate variables/parameters selected for Analysis....................................................... 15
     4.4     Validation of the models (precipitation & temperature) ................................................ 15
     4.5     Historical Climate and Future Climate Projections........................................................ 17
       4.5.1        Temperature Projections ........................................................................................ 18
       4.5.2        Rainfall Projections ................................................................................................ 22
5.     CONCLUSIONS AND RECOMMENDATIONS ............................................................ 26

                                                                         v
5.1       Historical climate analysis (Temperature and Rainfall) ................................................. 26
   5.2       Climate projections - Temperature ................................................................................. 26
   5.3       Climate projection- Rainfall ........................................................................................... 27
   5.4       Recommendations - Limitations and future scope ......................................................... 27
References .................................................................................................................................... 29
APPENDICES ............................................................................................................................. 31

                                                                       vi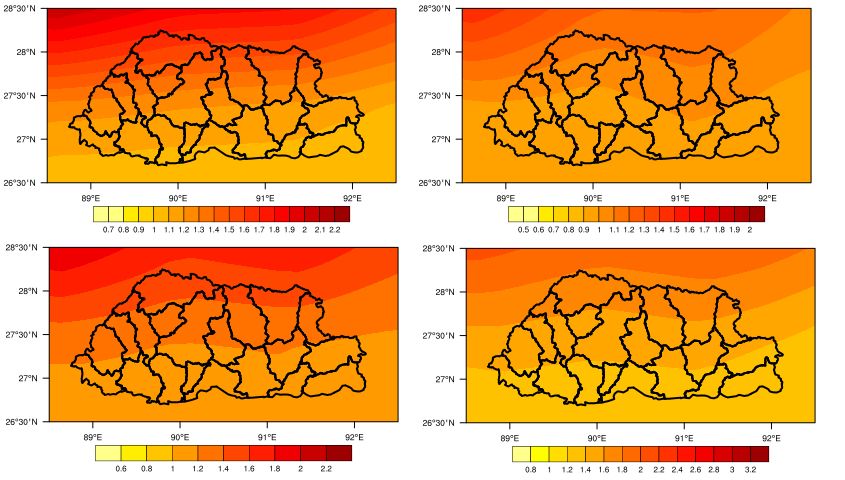
List of Figures
Figure 1.1 Physiographical features of Bhutan and surrounding areas .......................................... 1
Figure 1.2 Location of settlements along the river basins (source: National Statistical Bureau,
2005) ............................................................................................................................................... 3
Figure 3.1 Seasonal variation of temperature- maximum (Tmax), minimum (Tmin) and mean
(Tavg.) and rainfall (mm) over Bhutan as a whole (based on the stations observation for the period
from 1996-2013 for 44 number of stations) (Source: Climatology of Rainfall and Temperature in
Bhutan, 2017) .................................................................................................................................. 8
Figure 3.2 The figures shows the yearly percentage of departure for rainfall (a) and yearly
percentage departure for temperature (b) from the normal. ............................................................ 8
Figure 3.3 Time series - annual total rainfall of CRU data against station data of Bhutan ............ 9
Figure 3.4 Time series- annual mean temperature CRU data against station data of Bhutan ...... 10
Figure 3.5 Time series of annual mean temperature CRU dataset and NEX history ................... 10
Figure 3.6 Time series of annual mean rainfall CRU dataset and NEX history ........................... 10
Figure 3.7 Spatial pattern of annual mean temperature (a) CRU and (b) NEX over Bhutan for the
period 1975-2005 .......................................................................................................................... 11
Figure 3.8 Spatial distribution of seasonal mean temperature (oC) over Bhutan for the period 1975-
2005............................................................................................................................................... 11
Figure 3.9 Spatial distribution of annual mean rainfall (a) CRU data and (b) NEX history for the
period 1975-2005 .......................................................................................................................... 12
Figure 3.10 Spatial distribution of seasonal mean rainfall, DJF(Winter), MAM (Spring), JJAS
(summer) and ON (Autumn) ......................................................................................................... 13
Figure 4.1 Taylor diagrams of precipitation and temperature for historical simulations for the
period 1975-2005 .......................................................................................................................... 16
Figure 4.2 Historical climate and climate projections for temperature ........................................ 17
Figure 4.3 Historical climate and climate projection for Rainfall ................................................ 17
Figure 4.4 RCP 4.5: Difference in annual mean temperature (oC) between future and present-day
climate (a) 2021-2050 (b) 2070-2099 ........................................................................................... 18
Figure 4.5 RCP4.5: Difference in seasonal mean temperature (oC) between future and present-day
climate: 2021-2050 ....................................................................................................................... 18
Figure 4.6 RCP 4.5: Difference in seasonal temperature (oC) between future and present-day
climates: 2070-2099 ...................................................................................................................... 19
Figure 4.7 RCP 8.5: Difference in annual mean temperature (oC) between future and present-day
climates (a) 2021-2050 (b) 2070-2099 ......................................................................................... 19
Figure 4.8 RCP 8.5: Difference in seasonal mean temperature (oC) between future and present-day
climates: 2021-2050 ...................................................................................................................... 20

                                                                         vii
Figure 4.9 RCP8.5: Difference in seasonal mean temperature (oC) between future and present-day
climates: 2070-2099 ...................................................................................................................... 20
Figure 4.10 RCP4.5 Change (%) in annual mean precipitation between future and present-day
climates: (a) 2021-2050 (b) 2070-2099 ........................................................................................ 22
Figure 4.11 RCP4.5 Change (%) in JJAS precipitation between future and present-day climates:
(a) 2021-2050 (b) 2070-2099 ........................................................................................................ 23
Figure 4.12 RCP 4.5 Change (%) in DJF precipitation between future and present-day climates:
(a) 2021-2050 (b) 2070-2099 ........................................................................................................ 23
Figure 4.13 RCP 4.5 Time series and trends (mm/decade) of annual mean precipitation over
Bhutan ........................................................................................................................................... 23
Figure 4.14 RCP 8.5 Change (%) in annual mean precipitation between future and present-day
climates: (a) 2012-2050 (b) 2070-2099 ........................................................................................ 24
Figure 4.15 RCP 8.5 Change (%) in JJAS seasonal mean precipitation between future and present-
day climates: (a) 2021-2055 (b) 2070-2099.................................................................................. 24
Figure 4.16 RCP 8.5 Change (%) in DJF seasonal mean precipitation between future and present-
day climates: (a) 2021-2050 (b) 2070-2099.................................................................................. 24
Figure 4.17 RCP 8.5 Time series and trends (mm/decade) of annual mean precipitation over
Bhutan ........................................................................................................................................... 25
Figure 1 Number of days with a temperature greater than 30° C from observed station data ..... 31
Figure 2 Number of rainy days with more than 30 mm rainfall from observed station data........ 31
Figure 3 Time series of seasonal temperature from 1976-2005 using CRU dataset. ................... 32
Figure 4 Time series of annual mean temperature from 1976-2005 using CRU dataset .............. 32
Figure 5 Shows the time series plot of the number of days with rainfall greater than 10mm (blue)
and 20mm (red) for the period 2021-2050 under RCP 4.5 ........................................................... 34
Figure 6 Shows the time series plot of the number of days with rainfall greater than 10mm (blue)
and 20mm (red) for the period 2070-2099 under RCP 4.5 ........................................................... 34
Figure 7 Shows the time series plot of the number of days with rainfall greater than 10mm (blue)
and 20mm (red) for the period 2021-2050 under RCP 8.5 ........................................................... 36
Figure 8 Shows the time series plot of the number of days with rainfall greater than 10mm (blue)
and 20mm (red) for the period 2070-2099 under RCP 8.5 ........................................................... 36
viiiList of Table
Table 2.1 List of climate stations used in this study ....................................................................... 5
Table 2.2 List of GCMs used in this study ..................................................................................... 6
Table 2.3 Climate variable and metrics analysed in this study ....................................................... 7
Table 3.1 Mean, range and standard deviation of annual mean temperature ............................... 11
Table 3.2 Incremental change in seasonal and annual mean temperature during the period of 1976-
2005 over Bhutan for CRU dataset. .............................................................................................. 12
Table 3.3 Average, range and standard deviation of the seasonal mean temperature of NEX and
CRU data....................................................................................................................................... 12
Table 3.4 Average, range, standard deviation and coefficient of variation of annual and seasonal
mean rainfall over Bhutan ............................................................................................................. 13
Table 4.1 List of downscaled GCMs, resolutions and period of future climate analysed in this study
....................................................................................................................................................... 14
Table 4.2 Climate variables and metrics analysed for projection study ....................................... 15
Table 4.3 Annual and seasonal mean temperature projected during 2021-2050 under RCP 4.5 . 21
Table 4.4 Annual and seasonal mean temperature projected during 2021-2050 under RCP 8.5 . 21
Table 4.5 Annual and seasonal mean temperature projected during 2070-2099 under RCP 4.5 . 21
Table 4.6 Annual and seasonal mean temperature projected under RCP 8.5 ............................... 22
Table 4.7 Annual and seasonal mean rainfall projected under the RCP 4.5 scenario .................. 25
Table 4.8 Annual and seasonal mean rainfall projected under RCP 8.5 scenario ........................ 25
Table 1 Number of days for rainfall greater than 10mm and 20mm during the period of 2021-2050
and 2070-2099 respectively under RCP 4.5 ................................................................................. 33
Table 2 The table shows the number of days for rainfall greater than 10mm and 20mm during the
period of 2021-2050 and 2070-2099 respectively under RCP 8.5................................................ 35
ixGlossary of Acronyms
ACCESS Australian Community Climate and Earth System Simulator
AWOS Automatic Weather Observing System
BCSD Bias-Corrected Statically Downscaled
BOM Bureau of Meteorology
CDAAS Climate Data Access and Analysis System
CDMS Climate Database Management System
CMIP5 Coupled Model Inter-comparison Project Phase 5
CNRM Centre National de Recherches Meteorologique
CO2 Carbon dioxide
CRU Climatic Research Unit
CSIRO Commonwealth Scientific and Industrial Research Organization
CV Coefficient of Variation
DHMS Department of Hydro-Met Services
DJF December, January and February
DMS Database Management System
DoAT Department of Air Transport
GCM General Circulation Model
GDP Gross Domestic Product
GFS Global Forecasting System
GHG Green House Gases
GLOF Glacial Lake Outburst Floods
GNHC Gross National Happiness Commission
GPS Global Positioning System
ICAO International Civil Aviaition Organisation
IPCC Intergovernmental Panel for Climate Change
IPSL Institut Pierre-Simon Laplace
JJSA June, July, August and September
km Kilometre
LZ Lhyengye Zhungtshog
MAM March, April and May
METAR Meteorological Terminal Aviation Routine
MIROC Model for Interdisciplinary Research on Climate
mm Millimetre
MPI-ESM Max Planck Institute for Meteorology
xMRI Meteorological Research Institute
NASA National Aeronautics and Space Administration
NASA GEX-GDDP NASA Global Earth Exchange Global Daily Downscaled Projections
NCHM National Center for Hydrology and Meteorology
NEX-GDDP NASA Earth Exchange Global Daily Downscaled Projections
NSB National Statistical Bureau
NUS National University of Singapore
ODE Organisation Development Exercise
ON October and November
PPCR Pilot Program for Climate Resilience
RCM Regional Climate Model
RCP Representative Concentration Pathways
RCSC Royal Civil Services Commission
RIMES Regional Integrated Multi-hazard Early Warning System
RMSE root mean square errors
SD Standard Deviation
SMRC SAARC Meteorological Research Center
SPCR Strategic Program for Climate Resilience
Tavg Average Temperature
Tmax Maximum Temperature
Tmin Minimum Temperature
UK United Kingdom
UNDP United Nation Development Program
VFR Visual Flight Rule
WMO World Meteorological Organisation
WRF Weather Research for Forecasting
°C Degree Celsius
% Percentage
xi1. INTRODUCTION
1.2 Region Overview: Bhutan
Bhutan is a landlocked and a mountainous country situated in the southern slopes of the eastern
Himalayan range in between China and India. It has an area of 38,394 square kilometres. It has a
complex and rugged topography that varies from less than 100 meters in the south to over 7500
meters in the north. It has a population of 727,145 as of 30 May 2017 (National Statistical Bureau,
2017) and it is one of the lowest in the South Asia region. About 70 per cent of the country’s land
area (38,394 square kilometres) is under forest cover. The country has three distinct climatic zones:
subtropical, alpine and temperate, which encompass numerous micro-climates due to dramatic
variations in elevation and topography.
Figure 1.1 Physiographical features of Bhutan and surrounding areas
1.3 Climate Controls
The climate in Bhutan is mainly controlled by the following factors:
Topography that varies from low elevation rolling plains of the south to high mountains to the
northwest and north of the country.
Relative distance from the coast, which controls the extent of the moist monsoon current
penetration into the country. The eastern regions being closer to the Bay of Bengal are
influenced more by the bay current of the Southwest monsoon, much in a similar way as most
of Bangladesh and the Northeast India.
The rainfall regime of Bhutan is controlled by Southwest monsoon circulation that prevails over
the Indian sub-continent during summer months. This produces a seasonal cycle with rainy
summer seasons over most of the country lasting from June to September. During this part of
the year, most of the country has an almost sub-tropical climate, particularly the southern
Dzongkhags. Therefore, these areas are prone to dry-spells and drought induced by the
variability of monsoon rainfall.
The control exerted by the dry winter-time air mass from the northern high latitudes during the
winter seasons are primarily modulated by what is popularly known as the “western
disturbances” bringing a temperate nature to Bhutan’s climate. This also results in temperature
variations and the little rainfall/snowfall received during the otherwise dry winters.
1 Periodic impact by remnants of cyclonic systems that sometimes cross through India from the
Bay of Bengal also result in high rainfall events, particularly in the eastern areas. Southernmost
areas of the country are prone to severe thunderstorms during the months of April to June due
to strong summertime heating and development of strong convective systems. Further north,
during the transition months of autumn or spring, such systems can cause damaging hailstorms.
1.3.1 Seasons
Bhutan has four seasons - the winter season from December to February; spring season from March
to May; summer season from June to September; and the autumn season of October and November.
The Southwest or Summer Monsoon (June-September, JJAS) contributes about 72% to the total
annual rainfall of Bhutan with the highest amount received in the month of July followed by
August. The spring (March-May, MAM) and autumn (October-November) period contribute about
22 % to the total annual rainfall.
1.4 Impacts of Climate Variability and Change
About 70 per cent of the country’s land area (38,394 square kilometres) is under forest cover. Even
though Bhutan is a net sequester of greenhouse gases (GHG), the effects of climate change and
variability are becoming increasingly visible. Precarious geographical location and effects of
climate variability and change have highly exposed Bhutan to a diversity of hazards, including
cyclone induced storms, flash/floods, landslides, earthquakes, glacial lake outburst floods (GLOF)
and droughts. Heavy seasonal monsoon rains and glacial melt are the most common cause of
flooding and landslides in Bhutan. Over 70 per cent of settlements (MoWHS, 2017) including
infrastructures and fertile agricultural lands are located along the main drainage basins (Figure
1.2), hence posing threats from flooding.
GLOF events were experienced in the country in 1957, 1960, 1968 and 1994 (RGOB-WB, 2015).
The 1994 GLOF event from Luggye Tsho killed 21 people, damaged 91 houses and 1,781 acres
of land. The heavy rainfall brought about by Cyclone Aila in 2009 caused Bhutan to incur an
estimated loss of US$ 17 million. The country is also increasingly experiencing prolonged and
extreme droughts in some parts of the country, which in turn increases the risk of loss of
biodiversity, forest fires, reduction of crop yield and agricultural productivity. Unseasonal and
intense rainfall and hailstorms can destroy crops thereby affecting farmers who are caught
unprepared. Heavy rainfall triggering floods and flash floods are a recurring phenomenon in
Bhutan, especially during the summer monsoon. In July 2016, the southern part of the country
experienced a flash flood triggered by intense monsoon rainfall displacing more than 100 families
and damaging infrastructures. Landslides are a major problem for the roads sector, the only
transport and a lifeline for Bhutan, during the summer monsoon. With most of the rivers confined
in narrow gorges, blockage of rivers by landslides risks the formation of artificial dams that pose
a great danger to downstream settlements and assets such as hydropower due to landslide dam
outburst flood (LDOF). Extreme weather events have significant socio-economic consequences
and adversely affect people’s livelihoods and well-being, particularly marginal and poorer
communities.
2Figure 1.2 Location of settlements along the river basins (source: National Statistical Bureau, 2005)
Climate variability and change risks reduction of productivity and performance of key socio-
economic sectors such as agriculture, hydropower, tourism, transport, infrastructure and water. As
per the statistical yearbook of the National Statistical Bureau, agriculture accounts to 16.52 percent
of Bhutan’s GDP; electricity and water supply account for 13.38 percent of GDP and construction
accounts for 16.28 percent of GDP. Erratic rainfall patterns are already impacting agricultural
productivity. Farmers increasingly report instability in crop yields, loss in production, declining
crop quality, and decreased water availability for farming and irrigation. Changes in precipitation
pattern are impacting the availability of water for drinking and energy production in the short,
medium and long-term, with cycles of flooding during monsoons and very low flows and drying
streams during other seasons. Extreme weather events expose infrastructure assets (such as
hydropower and road network) to increased risk of floods and landslides.
1.5 The rationale of the study
Bhutan is in the process of implementing the phase I of the Strategic Program for Climate
Resilience (SPCR) under the Pilot Program for Climate Resilience (PPCR). The SPCR program
implementation is led by the GNHC and the NCHM is one of the lead technical agencies
responsible to carry out the study under the Pillar I: Enhancing Information Base for Hydro-
met Services and Climate Resilience.
Under the Pillar I of SPCR, NCHM’s technical studies were focused on:
Analysis of historical climate and climate change projection for Bhutan.
Re-assessment of potentially dangerous lakes of Bhutan
Bhutan glacier inventory 2018
This study is one of the three technical studies implemented by NCHM under the Pillar I of SPCR.
To prepare and adapt to the impacts of climate variability and change, information on historical
and future climate is vital. Himalayan region is understudied when it comes to climate change.
Unlike most of the developed countries across the globe and even in the south Asian region,
climate research and studies are limited for Bhutan due to lack of available historical climate data,
3dense and robust observational network, resources, model and computational facilities, and
scientific technology/capacity building.
Bhutan’s development and the economy are highly dependent on climate-sensitive sectors such as
agriculture, hydropower, and forestry. The most significant impact of climate change in Bhutan is
the formation of supra-glacial lakes due to the accelerated retreat of glaciers with increasing
temperatures (UNDP). The Fifth Assessment Report of the Intergovernmental Panel on Climate
Change (IPCC) projects an increase of about 4.8 °C in global mean surface temperature by the end
of the century. IPCC indicated that much more studies on climate change are required especially
at the regional and national levels. There is a requirement for climate change information at high
temporal and spatial scales to conduct several impacts studies over Bhutan such as flooding,
drought, agriculture, health, energy and socio-economic changes.
This study is a contribution to the Strategic Program for Climate Resilience (SPCR) that describes
possible future climate changes over Bhutan. The results and findings from this study offer some
basic assessments of expected changes in the future for long term adaptation planning which could
be useful to the Government, policymakers, stakeholders and other end-users.
The objectives of the study are:
i. To assess and analyse the observed or historical climate trends over Bhutan
ii. To assess how the climate has been varying: temperature and precipitation-annual and
seasonal trends
iii. To project future climate changes over Bhutan using downscaled regional climate
model data
42. DATA AND METHODS
This chapter describes the climate data (Observed and Global Climate Model data) used in this
study.
2.2 Observed data: Surface data of Bhutan 1996-2017
Bhutan has observational data available from 1996 to till date. For this study, the data period of
1996-2017 was used from the stations (Table 2.1) that were used in comparing with the global
observed data and also to provide basic insights of the climate of the past few decades. The data is
available in the data repository of the NCHM. The purpose of comparing the station data against
other global data is to check if the other global data can be used as proxies for Bhutan if and where
data scarcity exists.
Table 2.1 List of climate stations used in this study
Sl. No Station Name Lat (N) Lon (E) Elevation (m) Year of Record
1 Bhur 26.907 90.4309 390 1996 - 2017
2 Chamkhar 27.5454 90.75373 2470 1996 - 2017
3 Damphu 27.0081 90.1216 1520 1996 - 2017
4 Deothang 26.8597 91.4632 890 1996 - 2017
5 Haa 27.3864 89.2785 2751 1996 - 2017
6 Kanglung 27.282 91.5185 1980 1996 - 2017
7 Mongar 27.2792 91.2355 1580 1996 - 2017
8 Paro 27.3871 89.4195 2406 1996 - 2017
9 Pemagatshel 27.0304 91.4379 1780 1996 - 2017
10 Punakha 27.5803 89.8649 1236 1996 - 2017
11 Sibsoo 27.0087 88.8821 413 1996 - 2017
12 Simtokha 27.4414 89.6627 2310 1996 - 2017
13 Trashiyangtse 27.6127 91.4946 1810 1996 - 2017
14 Wangdue 27.489 89.898 1180 1996 - 2017
15 Zhemgang 27.215 90.6588 1820 1996 - 2017
2.3 Observed data: CRU TS 3.2.3
For this study CRU data was chosen as an alternative to the Bhutan station data because of the
relatively short data records available in Bhutan. CRU TS 3.2.3 data, developed at the Climatic
Research Unit at the University of East Anglia, UK, is one of the most widely used data products
by the climate research community. This dataset comprises monthly grids of observed climate, for
the period 1901-2014 and covering the global land surface at a 0.5° horizontal resolution. The
dataset is widely recognized across the scientific community in the world and mostly used in the
study of natural and anthropogenic climate change (Karmacharya et al., 2007). The CRU data was
used for climate change study in the Central Himalayan region (Karmacharya et al., 2007) and to
predict future scenarios of precipitation in the Hindu-Kush Karakoram Himalaya by Palazzi and
others (2013). Studies indicated that the use of CRU data has resulted in obtaining a consistent
picture of climate at seasonal and annual times scales.
5There are nine climate variables available: mean, minimum and maximum temperature, diurnal
temperature range, precipitation, wet day frequency, frost day frequency, vapour pressure and
cloud cover (Harris et al. 2014). In this study, temperature and rainfall variables have been used.
2.4 Model dataset: NASA data BCSD
The NASA (National Aeronautics and Space Administration) Earth Exchange Global Daily
Downscaled Projections (NEX-GDDP) dataset is comprised of downscaled climate scenarios for
the globe that are derived from the General Circulation Model (GCM) runs conducted under the
Coupled Model Inter-comparison Project Phase 5 (CMIP5) and across two of the four greenhouse
gas emissions scenarios known as Representative Concentration Pathways (RCPs). The CMIP5
GCM runs were developed in support of the IPCC’s Fifth Assessment Report (AR5). The NEX-
GDDP dataset includes downscaled projections for RCP 4.5 and RCP 8.5 from the 21 models and
scenarios for which daily scenarios were produced and distributed under CMIP5. Each of the
climate projection includes daily maximum temperature, minimum temperature, and precipitation
for the periods from 1950 through 2100. The spatial resolution of the dataset is 0.25 degrees (~25
km x 25 km). The NEX-GDDP dataset is provided to assist the science community in conducting
studies of climate change impacts at local to regional scales, and to enhance understanding of
possible future global climate patterns at the spatial scale of individual towns, cities, and
watersheds.
Each of the climate projections includes monthly averaged maximum temperature, minimum
temperature, and precipitation for the periods from 1950 through 2005 (Retrospective Run) and
from 2006 to 2099 (Prospective Run). A comprehensive documentation is available at
https://cds.nccs.nasa.gov.
Out of the 21 models, a subset of 6 models was chosen based on the selection done by Regional
Integrated Multi-Hazard Early Warning System (RIMES) for Asia and Africa at
http://cdaas.rimes.int/nexnasa/daily. Table 2.2 shows the raw CMIP5 GCMs. The downscaled data
of the listed GCMs are available at NASA data portal for download at
https://www.nccs.nasa.gov/services/data_portal.
Table 2.2 List of GCMs used in this study
Sl No. Model Investment Resolution
CSIRO (Commonwealth Scientific and Industrial
1 ACCESS1-0 Research Organization) & BOM (Bureau of 1.25° × 1.85°
Meteorology), Australia
Centre National de Recherches Meteorologiques /
2 CNRM-CM5 Centre European de Recherche et Formation Avancees 1.4° × 1.4°
en Calcul Scientifique
3 IPSL-CM5A-LR Institut Pierre-Simon Laplace 1.8° × 3.75°
Atmosphere and Ocean Research Institute (The
University of Tokyo), National Institute for
4 MIROC5 1.4° × 1.4°
Environmental Studies, and Japan Agency for Marine-
Earth Science and Technology
65 MPI-ESM-MR Max Planck Institute for Meteorology (MPI-M) 1.8° × 1.8°
6 MRI-CGCM3 Meteorological Research Institute 1.12° × 1.12°
2.5 Climate variables and parameters
The observed climate variables and the time periods over which they are analysed in this study are
tabulated below. The focus is on observed rainfall and surface temperatures (Table 2.3) that were
analysed on monthly, seasonal and annual time scales along with their ranges, standard deviation
(SD), trends, the coefficient of variation (CV) and incremental changes.
Table 2.3 Climate variable and metrics analysed in this study
Rainfall Mean Annual, Seasonal, Range, SD, CV, Trend, Incremental Change
Mean Annual, Seasonal, Range, SD, Trend, Incremental Change
Temperature Minimum Annual, Seasonal, Range, SD, Trend, Incremental Change
Maximum Annual, Seasonal, Range, SD, Trend, Incremental Change
73. ANALYSIS OF HISTORICAL DATA
3.1 Overview of the climatology of Bhutan
Figure 3.1 Seasonal variation of temperature- maximum (Tmax), minimum (Tmin) and mean (Tavg.) and
rainfall (mm) over Bhutan as a whole (based on the stations observation for the period from 1996-2013
for 44 number of stations) (Source: Climatology of Rainfall and Temperature in Bhutan, 2017)
Figure 3.1 shows the seasonal variation of temperature and rainfall over Bhutan. It shows that
Bhutan’s rainfall regime is dominated by summer rainfall. The rainfall during the southwest
monsoon season accounts to more than 72 % of the total annual rainfall. Winter season receives
the least rainfall with low temperatures recorded.
a) b)
Figure 3.2 The figures shows the yearly percentage of departure for rainfall (a) and yearly percentage
departure for temperature (b) from the normal.
Analysis of number of hot days and rainy days from selected weather stations are shown in the
appendices.
83.2 Selection of CRU data for analysis
For this study CRU dataset was chosen as an alternative to the Bhutan station data because of the
relatively short data records of Bhutan station data.
A time series comparison was made against the observed station data of Bhutan. The two data sets
were mainly compared based on their signals (peaks and troughs) and no comparison in terms of
values and biases were made. This is because the observed data do not represent the country
completely and the period is also short.
Readers should note that matching of one to one values of the data is not possible due to the
difference in resolution in data and other methods used while generating the CRU data. While
biases are obvious, the time series graphs (Figure 3.3 and Figure 3.4) of both annual total rainfall
and annual mean temperature indicate a clear and consistent peaks and troughs. In other words,
CRU data is able to capture the annual variation of temperature and rainfall of Bhutan. However,
clear bias is seen especially for temperature because the observed data used here is mainly the long
term mean of the data from the stations which are mostly located in the south and central parts of
the country that is not well reflected in CRU. Therefore, this bias is not unusual but bias correction
of the data is beyond the scope of this study. These analyses reveal that at local scale, the station
data are much different and that Bhutan needs a concerted effort in building more station
observations as climate studies are furthered in the years to come.
The signal of CRU dataset tends to match with the time series of the ensemble average of model
historical simulation (Figure 3.5 and Figure 3.6). Hereafter, for brevity, the ensemble average of
the models is referred as ‘NEX’.
Figure 3.3 Time series - annual total rainfall of CRU data against station data of Bhutan
9Figure 3.4 Time series- annual mean temperature CRU data against station data of Bhutan
Figure 3.5 Time series of annual mean temperature CRU dataset and NEX history
Figure 3.6 Time series of annual mean rainfall CRU dataset and NEX history
Seasonal time series analysis of the CRU data (1975-2005) is included in the appendices for
more information.
103.3 Spatial distribution of annual mean temperature
a) b)
Figure 3.7 Spatial pattern of annual mean temperature (a) CRU and (b) NEX over Bhutan for the period
1975-2005
Figure 3.7 shows the spatial distribution of annual mean temperature over Bhutan. The observed
data (CRU dataset) and NEX_GDDP historical data almost indicate a similar spatial distribution
with area averaged annual mean temperature of 11o C and 11.5o C (Table 3.1), respectively.
Table 3.1 Mean, range and standard deviation of annual mean temperature
Mean Temperature
Mean Range SD
NEX 11.5 0.9 0.2
CRU 11.0 1.7 0.4
DJF MAM
JJAS ON
Figure 3.8 Spatial distribution of seasonal mean temperature (oC) over Bhutan for the period 1975-2005
11Table 3.2 Incremental change in seasonal and annual mean temperature during the period of 1976-2005
over Bhutan for CRU dataset.
CRU Change in mean temperature (°C)
DJF 1.3
MAM 0.6
JJAS 0.8
ON 0.7
Mean 0.8
The spatial distribution of seasonal mean temperature over Bhutan for the period 1975-2005 using
CRU datasets is shown in Figure 3.8. It can be seen that the JJAS and MAM seasons are warmer
than the rest of the seasons. The northern regions are relatively cooler than the rest of the regions.
Overall, the seasonal temperature ranges between -1oC and 28oC.
The seasonal mean, range and standard deviation of temperature for CRU dataset and model
historical data are shown in Table 3.2.
Table 3.3 Average, range and standard deviation of the seasonal mean temperature of NEX and CRU data
NEX History CRU Data
Seasons
Mean Range SD Mean Range SD
DJF 4.9 1.9 0.4 4.2 2.7 0.8
MAM 11.5 1.7 0.4 11.1 2.6 0.6
JJAS 16.6 0.5 0.1 16.3 1.6 0.4
ON 10.9 1.2 0.3 10.2 2.7 0.8
3.4 Spatial distribution of annual mean rainfall
a) b)
Figure 3.9 Spatial distribution of annual mean rainfall (a) CRU data and (b) NEX history for the period
1975-2005
12The spatial distribution of annual mean rainfall (Figure 3.9), both the CRU data and NEX_GDDP
historical simulation data depicts a similar distribution of rainfall. Bhutan is influenced largely by
the South Asian Monsoons. Figure 3.10 shows the spatial distribution of mean rainfall during the
period 1975-2005 over the different seasons. During the two monsoon seasons (summer and
winter), strong gradients can be distinctly seen. Bhutan is wettest during the summer monsoon
(JJAS) and generally dry during the winter (DJF) season.
DJF MAM
JJAS ON
Figure 3.10 Spatial distribution of seasonal mean rainfall, DJF(Winter), MAM (Spring), JJAS (summer)
and ON (Autumn)
The average, range, standard deviation and coefficient of variation at annual and seasonal scales
of mean annual and seasonal mean rainfall is shown in Table 3.3.
Table 3.4 Average, range, standard deviation and coefficient of variation of annual and seasonal mean
rainfall over Bhutan
NEX History CRU dataset
Mean Range SD CV Mean Range SD CV
Annual 152.7 75.9 17.9 0.1 163.2 78.6 18.5 0.1
DJF 2.9 5.9 1.36 0.4 10.2 27.5 6.0 0.6
MAM 107.9 94.5 26.2 0.2 119.5 108.3 23.8 0.2
JJAS 347.1 214.4 48.5 0.1 367.3 195.5 48.8 0.1
ON 55.7 105.4 24.2 0.4 50.1 98.0 29.3 0.6
134. CLIMATE CHANGE PROJECTION
4.1 Model Selection
Out of the six models that were investigated, five global climate models (CMIP5) were chosen to
analyse temperature and rainfall changes over the future in this study. The GCMs listed in Table
4.1 comprise the NASA (National Aeronautics and Space Administration) Earth Exchange Global
Daily Downscaled Projections (NEX-GDDP) dataset. The datasets contain downscaled climate
scenarios for the globe that are derived from the GCM runs conducted under the CMIP5 and across
two scenarios. The NEX-GDDP dataset includes downscaled projections for RCP 4.5 and RCP
8.5 from the 21 models and scenarios for which daily scenarios were produced and distributed
under CMIP5. Each of the climate projections includes daily maximum temperature, minimum
temperature, and precipitation for the periods from 1950 through 2100. The spatial resolution of
the dataset is 0.25 degrees (~25 km x 25 km).
Table 4.1 List of downscaled GCMs, resolutions and period of future climate analysed in this study
Downscaled GCMs
Resolution Period for projection
(NASA GEX-NDDP data)
2021 to 2050
CNRM-CM5 25 km x 25 km (daily)
2070 to 2099
2021 to 2050
IPSL-CM5A-LR 25 km x 25 km (daily)
2070 to 2099
2021 to 2050
MIROC5 25 km x 25 km (daily)
2070 to 2099
2021 to 2050
MPI-ESM-MR 25 km x 25 km (daily)
2070 to 2099
2021 to 2050
MRI-CGCM3 25 km x 25 km (daily)
2070 to 2099
4.2 RCP Scenario Selection
The Intergovernmental Panel for Climate Change (IPCC) used four Representative Concentration
Pathways (RCP) (2.6, 4.5, 6.0, and 8.5) to represent a broad range of climate scenarios of possible
future outcomes replacing the earlier scenarios of the Special Report on Emissions (SRES) of the
Fourth Assessment Report (AR4). These RCPs are defined by their total radiative forcings (a
cumulative measure of human emissions of GHGs from all sources expressed in watts per square
meter) pathway and level by 2100. The scenarios were used for climate change projection and
simulation of global climate models. Amongst the four scenarios, namely the 4.5 and 8.5 scenarios
were chosen for all analyses in this study. RCP 4.5 is the mitigation/stabilization scenario and the
RCP 8.5 is the high emissions scenario. The fundamental purpose of RCPs cited as ‘Pathways’, is
to provide time-dependent projections of atmospheric greenhouse gas (GHG) concentrations. Van
Vuuren et al. (2011) and the fifth assessment report of the IPCC may be referred to for further
information.
144.3 Climate variables/parameters selected for Analysis
Table 4.2 Climate variables and metrics analysed for projection study
Mean Annual, Monthly Mean, Range, SD, Trend, Incremental Change
Temperature Minimum Annual, Monthly Mean, Range, SD, Trend, Incremental Change
Maximum Annual, Monthly Mean, Range, SD, Trend, Incremental Change
Annual, Seasonal, Monthly Mean, Range, SD, CV, Trend,
Rainfall Precipitation
Incremental Change
4.4 Validation of the models (precipitation & temperature)
The global climate models have to be evaluated for confidence in these models in simulating the
possible future outcomes with certain credibility. A commonly used method in this regard is to
evaluate global climate models against observations to examine how reasonable the present day
(historical) climate are.
In this study, only limited evaluations on the state of climate simulated by global climate models
were chosen, focusing on the annual and seasonal mean precipitation and temperature. Taylor
diagrams provide a concise graphical summary of patterns matching observations based on
correlation, root means square differences and ratio of variances (Taylor, 2001). The comparisons
of CRU vs NEX-GDDP spatial distributions of temperature and rainfall mentioned earlier also
stand as support in this validation exercise.
The Taylor diagrams for temperature and rainfall for Bhutan is depicted in Figure 4.1 (a and b).
Bilinear interpolation was used to derive these diagrams in reference to Bhutan grid point based
on the resolution of the downscaled global models. Therefore, the results are only representative
and do not portray the observed state of the climate in its entirety. For rainfall, the correlations for
individual models are between 0.9 to 0.99, root means square errors (RMSE) between 1.50 to 0.25
with high variability both on the seasonal and annual means. The ensemble shows higher
variability with correlation from 0.87 to 0.99. In the case of temperature, there is low variability
with lesser RMSE and good correlation. This as mentioned earlier, can be attributed to the
relatively coarser resolution of the global models.
15a)
b)
Figure 4.1 Taylor diagrams of precipitation and temperature for historical simulations for the period
1975-2005
164.5 Historical Climate and Future Climate Projections
Figure 4.2 shows the future climate projection for temperature (ensemble of 5 GCMs chosen in
this study), for Bhutan. The historical values are shown to compare GCM simulations with the
observation and to suggest future projected trends.
As depicted in Figure 4.2, the rise in temperature over Bhutan is evident under the future scenarios
of RCP 4.5 and 8.5. There is a clear divergence of the signal after the mid-century. The RCP4.5
and RCP8.5 follow closely during the immediate future and differently by the end of the century.
As to rainfall, an overlap is seen with higher values projected by RCP 8.5.
The rainfall projection shows no significant increase on an average (Figure 4.3), however, the
variability within the model is large and increasing towards the end of the century.
Figure 4.2 Historical climate and climate projections for temperature
Figure 4.3 Historical climate and climate projection for Rainfall
174.5.1 Temperature Projections
Projected Annual Mean Temperature: RCP4.5 Scenario
a) b)
Figure 4.4 RCP 4.5: Difference in annual mean temperature (oC) between future and present-day climate
(a) 2021-2050 (b) 2070-2099
Projected Seasonal Mean Temperature: RCP4.5 Scenario
DJF MAM
JJAS ON
Figure 4.5 RCP4.5: Difference in seasonal mean temperature (oC) between future and present-day
climate: 2021-2050
18Figure 4.6 RCP 4.5: Difference in seasonal temperature (oC) between future and present-day climates:
2070-2099
The above figures depict the change in mean surface temperature over Bhutan under the RCP 4.5
scenario.
Figure 4.4 shows changes in annual mean temperature. By 2021-2050, an increase in the range of
0.8oC – 1.6oC is expected all over Bhutan. These changes are likely to be higher towards the end
of the century (2070-2099) with expected increase in the range of 1.6o C – 2.8oC. Accordingly, the
seasonal changes during 2021-2050 (Figure 4.5) show increase in the range of 0.9oC – 1.8oC over
Bhutan and about 1.8oC – 2.8oC by the end of the century (Figure 4.6). Larger warming is indicated
during MAM and DJF seasons. The country as a whole is expected to experience an increase in
temperature with a larger increase projected in the high lands.
Projected Annual Mean Temperature: RCP8.5 Scenario
Figure 4.7 RCP 8.5: Difference in annual mean temperature (oC) between future and present-day
climates (a) 2021-2050 (b) 2070-2099
19You can also read


