Climate predictions and climate projections - How to make statements about the future climate - DWD
←
→
Page content transcription
If your browser does not render page correctly, please read the page content below

Climate predictions and
climate projections
How to make statements about the future climate
2
Contents

           Foreword...................................................................................5

           Introduction:
           The climate system and its variability.........................................6

           Climate change – its anthropogenic factor..................................8

           Climate modelling....................................................................10

           Climate predictions and climate projections............................. 12

           Outlook on the climate conditions for the next weeks............... 16

           Seasonal forecasts published by the DWD
           on a monthly basis...................................................................18

           Participation in the development of decadal
           climate predictions..................................................................20

           Climate projections produced by the DWD................................ 22

           Priorities for future work..........................................................25

           Publishing details....................................................................26

                                                                                                          3
4
Foreword

Dear readers,

Through its activities in the field of climate prediction and climate projection, the Deutscher
Wetterdienst (DWD) provides the general public with important information about environmental
and climate change protection. The recent amendment of the Deutscher Wetterdienst Act, which
came into force in July 2017, provided the basis for easier access to both meteorological and
climatological data and services.
To illustrate the possibilities of interpretation and explain how to use climate predictions or
climate projections, this brochure gives anyone interested an overview of the basic principles of
climate modelling and its usability for climate prediction and climate projection.
As you read the brochure you will realise that there is still intensive research and development
work going on regarding many key topics in climatology. On all timescales (from climate predic-
tions for the next few weeks, months and years through to climate projections for the next
decades and centuries) and all spatial scales (from global and regional through to local resolu-
tions), the quality of products and predictions derived from climate simulations can be increased
by an improved understanding of the underlying processes. The DWD therefore collaborates with
other national and international institutions in order to face the challenges of continuously im-
proving predictions and projections and the models they are based on. These efforts are under-
taken with the aim of providing our customers with climate information that is based on the latest
state of science.
This brochure is intended to contribute to the understanding of how statements about the future
climate are made and what the DWD's activities are in this context.

Dr Paul Becker
Vice-President of the Deutscher Wetterdienst

                                                                                                    5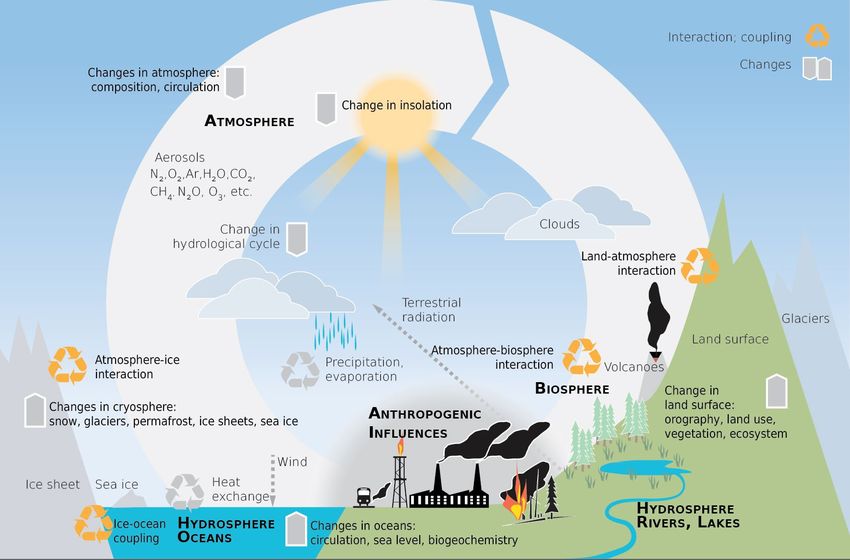
Introduction:
The climate system and its variability
The DWD defines climate as a sum of the weather conditions which characterise the
mean state of the atmosphere at a particular location or over a particular area and over
a sufficiently long period of time.   Many and complex interactions take place between the
atmosphere, the hydrosphere (oceans, rivers, lakes), the biosphere (fauna, flora), the lithosphere
(rigid, non-living part of the Earth) and the cryosphere (ice, glaciers, permafrost). All these
components together constitute the 'climate system'.

 6

▲ Components of the climate system

Energy from the sun in the form of solar radiation is     In contrast to climate change, climate variability con-
the key driver of the Earth’s climate system. In con-     sists in fluctuations around mean climate states on
trast to the heat fluxes from solar radiation, the con-   different timescales. In addition to short-term reac-
tribution of the Earth's internal heat can be ne-         tions, such as the diurnal and annual variability, the
glected. The energy from the sun stimulates atmo-         climate system also experiences longer-running cy-
spheric and oceanic processes and provides the foun-      cles of variation. The most prominent example for this
dation for the biosphere. This in turn influences the     is a phenomenon in the tropical Pacific, the El Niño
radiation and motion processes in the atmosphere and      Southern Oscillation (ENSO) cycle, which results from
oceans. Such links exist among all the various compo-     a strong coupling between ocean and atmosphere. Ev-
nents of the climate system, causing interaction pro-     ery two to ten years, wind conditions and ocean cur-
cesses between the various components which lead to       rents in the tropical Pacific change to such an extent
further reactions on different timescales.                that this has a considerable effect on the precipita-
                                                          tion patterns both in neighbouring and in more dis-
The Earth's climate changes over time due to the          tant regions. The two opposite extremes in the ENSO
internal dynamics of the climate system and the influ-    cycle are referred to as El Niño and La Niña.
ence of external factors.
The lower atmosphere reacts to changes with very          The climate system is an open system. This means
short response times, i.e. within minutes or days, and    that it is also subject to the influence of external fac-
shows the largest variability. With response times of     tors, such as volcanic eruptions, variations in solar
centuries to millenniums, the slowly responding deep      activity and changes in the Earth orbit parameters. In
oceans as well as the ice sheets and the soil represent   addition, there are human-induced interferences with
the long response timescales of the climate system.       atmospheric composition and land use.

                                                                                                                 7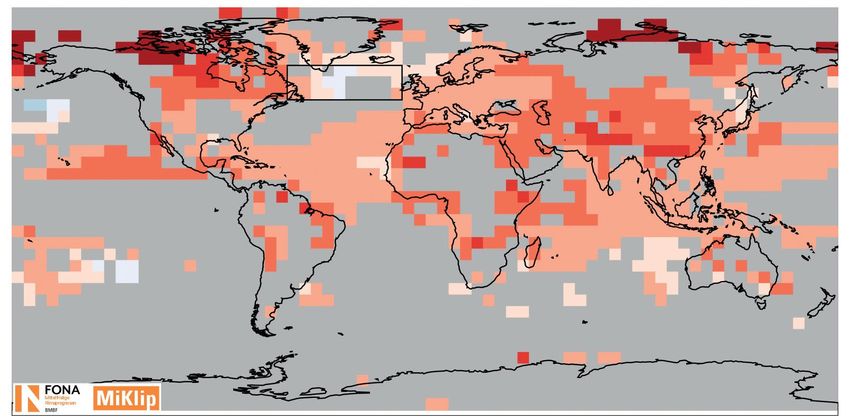
Climate change – its anthropogenic factor
Changes in our climate may be caused by natural and human factors. Since the middle of the
20th century, the near-surface air layers over the Earth's continents and oceans have warmed
significantly. Climate change becomes evident, for example, from an increased occurrence of hot
temperature extremes, from the continuous rise in sea levels and from the changing frequency
of extreme precipitation events observed in some regions over the last decades. Anthropogenic
activities are considered the major reason. They caused rising greenhouse gas concentrations
due to increased emissions of carbon dioxide (CO2) and other pollutant emissions from industry,
traffic and domestic sources since pre-industrial times. In addition to this, land-use changes,
for example deforestation and surface sealing, also have a major impact on the climate.

The climate is described by general statistical proper-   Different scenarios that take account of human influ-
ties (such as averages, extreme values, frequencies,      ence and the possible evolution of greenhouse gas
lengths of duration, etc.) over a sufficiently long       concentrations have been developed to have a basis
period of time. The baseline (reference) period for       for climate trend assessments for the next decades
such descriptions generally spans over a time peri-       and centuries.
od of 30 years. A key question in climatology is, for
example, how temperatures and precipitation have          The business-as-usual scenario, for example, de-
changed compared to a certain reference period. The       scribes a world in which energy systems are large-
period 1961–1990 is currently used as the standard        ly based on fossil fuel combustion. Another scenario,
for long-term comparisons for climate change assess-      which is referred to as a mitigation scenario, assumes
ments. If the comparison with recent measurements         that global warming can be limited before 2100 to less
reveals distinct differences, this is convincing reason   than two degrees Celsius (°C) compared to pre-
to believe that there are some changes, if not a gen-     industrial levels (for more information see p. 14).
eral change in the climate.
                                                          Depending on the extent of the global warming, the
                                                          changes may affect the whole atmospheric circula-
                                                          tion system. This in turn leads to changes in the dis-
                                                          tribution patterns of precipitation and to an increased
                                                          occurrence of tornadoes. Melting ice from glaciers
                                                          and the polar ice caps causes rising sea levels. Vegeta-
                                                          tion zones shift.

                                                          Observations reveal that warming advances faster in
                                                          the Arctic than in other regions. As sea ice melts, it
                                                          causes a stronger warming of the atmosphere due to
                                                          the shrinking sunlight-reflecting (white) ice surface
                                                          being replaced by a much darker ocean surface. This
                                                          absorbs more solar radiation.

 8
▲ Global mean annual temperatures for the period 1880–2016 compared to the long-term average over the reference period 1961–
1990. The diagram also shows the deviations from the reference period for other time periods mentioned later in this publication.
Data source: NASA‘s Goddard Institute for Space Studies (GISS).
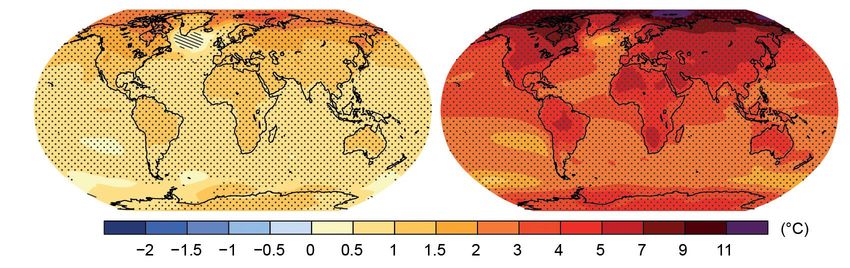
The global mean temperature for 2016 was around The climate projections in the Fifth Assessment
0.9 °C higher than the long-term average over the Report (AR5) of the Intergovernmental Panel on Cli-
reference period 1961–1990. The years 2014, 2015 and mate Change (IPCC) show a continuing increase in
2016 were the warmest since meteorological records mean temperatures in all regions until the end of the
began. Overall, each of the last three decades was 21st century. The global mean temperature change
warmer than any of the previous decades on record between the periods 1986–2005 and 2081–2100 is
since measurements began. expected to be 1 °C in the mitigation scenario and 3.7
°C in the business-as-usual scenario.
▲ Mean temperature change for the period 2081–2100 in the mitigation scenario (RCP2.6, left) and in the business-as-usual scenario (RCP8.5,
right), relative to the period 1986–2005. Hatching indicates regions where changes are less than natural climate variability. Stippling indicates
regions where changes exceed natural climate variability. Source: IPCC Fifth Assessment Report 2013, Working Group I, figure SPM.8.
9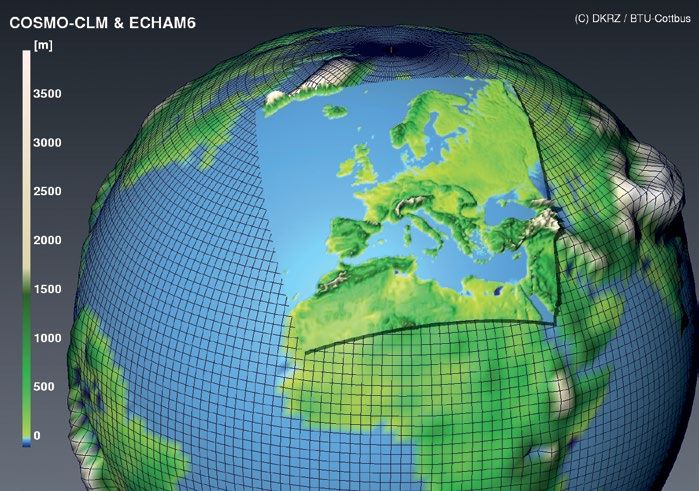
Climate modelling
Early studies of the future climate were often based on using observed data from the past and
projecting these into the future. Now that climate change is taking place, this is no longer pos-
sible. For this reason, computation of climate predictions and climate projections has been based
on climate models since the 1960s.

Global and regional climate models

                                                                      Statements about the world's future climate can be
                                                                      made by using global models, for instance global cir-
                                                                      culation models (GCM) or Earth system models (ESM).
                                                                      In the early stages of climate modelling in the 1960s,
                                                                      highly simplified models were developed to represent
                                                                      the dynamics of the Earth's atmosphere and oceans.
                                                                      The complexity of these climate models grew along
                                                                      with the rapid development in high-performance com-
                                                                      puting and the increasing understanding of the cli-
                                                                      mate system and its interactions. In addition to atmo-
                                                                      sphere and oceans, global climate models nowadays
                                                                      also include the hydrosphere, biosphere and cryo-
▲ The MPI-ESM Earth System Model of the Max-Planck-Institute for
Meteorology (MPI-M) couples the atmosphere, ocean and land sur-
                                                                      sphere.
face through the exchange of energy, momentum, water and impor-
tant trace gases such as carbon dioxide. The model was used for the   Climate models rely on the known physical equa-
comparative calculations in the context of CMIP5, which constitute    tions for the conservation of momentum, energy and
the German contribution to AR5. Source: DKRZ                          mass. At first, these equations are simplified to such a
                                                                      degree that they are valid for discrete grid points. The
                                                                      climate system is spanned by a large number of such
                                                                      grid points in order to take account of all three spa-
                                                                      tial dimensions. The distance between the grid points
                                                                      determines the spatial resolution of the climate model.

                                                                      Owing to the large number of grid points, supercom-
                                                                      puters are used to solve the equations for each grid
                                                                      point of the global mesh. Assumptions need to be
                                                                      made about processes which the model resolution can-
                                                                      not capture (e.g. certain waves, turbulence or convec-
                                                                      tion). This is often done on the basis of measurements,
                                                                      from which it is possible to derive empirical relation-
                                                                      ships. This procedure is referred to as parameteri-
                                                                      sation, i.e. an approximation to real processes which
▲ ICON (ICOsahedral Nonhydrostatic) modelling framework: this
model, which is the outcome of a joint development project between
                                                                      cannot be described on the basis of discrete equations
DWD and MPI-M, calculates weather forecasts and is also aimed to      alone.
be used for climate prediction. The figure shows the grid used for
ICON and the finer grid resolution used over Europe.

 10
The resolution of global climate models (with grid To also take account of the differences between dif-
spacing of currently above 100 km) is still not ferent models and model chains so-called multi-model
sufficient to describe the various manifestations ensembles are used. In this context, it is important to
of climate change in a certain region of the Earth (e.g. compare as many models as possible in order to deter-
Europe, Germany) in detail. This is what regional cli- mine and cover the spread of results from the differ-
mate models (RCM) with much finer mesh grids are ent model outputs.
used for. There exist a number of different region-
al climate models which are all driven by the outputs When analysing ensembles, it has to be kept in mind
from global climate models. In the regional models, that it will never be possible to take into account all
the mesh widths can be reduced to horizontal dis- influencing factors and uncertainties within the cli-
tances between 1 and 20 km, so that it is possible to mate system. Also, the spread of assumptions (such as
have more processes directly described by the under- emission scenarios) can prove to be insufficient.
lying model equations and less processes need to be For this reason, the changes resulting from ensemble
determined by parameterisation. Another approach analysis must always be understood as a subset of the
uses time series-based, statistical methods for ob- possible natural changes.
taining higher spatial resolution information and is
therefore referred to as empirical-statistical down-
scaling (ESD).
In contrast to the natural climate system, climate
models are closed systems. They can only describe
interdependencies and interactions between compo-
nents if these are defined in the models.
Ensemble studies
Today, in order to estimate uncertainties which result
from the climate system's chaotic behaviour and from
a lacking, insufficient or error-prone description of
processes in the models, many applications are run
using ensemble calculations. This means that for one
and the same period several climate simulations are
run, but each run is based on slightly different ini-
tial conditions or modified model parameters, so that
a whole set of solutions is obtained. A single model
thus provides different simulation outputs, so that it
▲ An example for a dynamic regional climate model is the COSMO
is possible to analyse the entire spectrum of results (COnsortium for Small-scale MOdelling) CLM/CCLM model, which was
from the simulations. The analysis of such an ensem- developed from the DWD's weather forecasting model and is used
ble of climate simulations then allows statements to and further developed by an international network of scientists, the
be made about the variety of possible future develop- Climate Limited-area Modelling, short CLM-Community (http://www.
ments of the climate system. clm-community.eu). Source: DKRZ
11Climate predictions and
climate projections
Climate predictions describe the future evolution of the climate system on the basis of the past
and current state of the atmosphere for time horizons from several weeks and seasons through to
decades (10-year periods). Just like in weather forecasting, climate prediction essentially relies on
a good knowledge of the current state of the climate system as the initial condition.
For climate projections, however, the initial state of the atmosphere is of no crucial importance. In
fact, climate projections are calculations of the possible effects on our future climate over periods
from several decades to up to more than 100 years ahead, computed on the basis of an assumed
set of parameters ('scenarios').
Climate predictions for several weeks up to several years
Weather forecasts are able to provide a fairly detailed Despite this, climate predictions allow climate trend
description of the meteorological events over the next estimates to be made for the coming month, season or
few days. Forecasts beyond this time horizon become decade.
increasingly uncertain the further they look. This is
mainly due to the chaotic behaviour of the atmo- This is made possible by including, in addition to the
sphere. atmosphere, other so-called 'long-term memory' com-
ponents of the climate system in the model calcula-
As the projected future state of the atmosphere tions. These are mainly the oceans and sea ice. The
strongly depends on what the initial conditions are, term 'long-term memory' refers to the slowness with
these are taken into account in the forecasting which the system responds to changes. For instance,
models. In certain weather situations, even the slight- the influence of the sun, wind and rain persists much
est change in the initial conditions could lead to pre- longer in the oceans and is returned to the atmo-
dicting completely different weather developments. sphere at another place and at another time.
12▶ Exemplary representation of the chaotic behaviour
of the atmosphere. Even the slightest shifts in the
starting point lead to widely varying solutions of the
equation system: if the starting point is within the
ellipse at the top left, all the results lie in a small,
limited area at the top right (left). If the starting
point is slightly shifted, the range of possible results
gets wider (middle). If the starting point is in a fairly
central position, the results are completely unpre-
dictable (right). Source: Buizza, R.: Chaos and
Weather Prediction. ECMWF, 2002.
Over longer timescales, the 'long-term memory' com- model simulations are run, each with slightly changed
ponents cause the chaotic behaviour of the weather conditions. Such an ensemble of predictions is used to
to show a structured pattern. It is these structures determine the spread as well as the probability of cer-
which the climate models are intended to predict. tain climatic events.
Extensive climate predictions for past time periods, The resulting monthly, seasonal or decadal outlooks
so-called hindcasts, are needed as a foundation for indicate probabilities, whether or not and how much
obtaining statements about the model's climate be- it is getting warmer/colder or drier/wetter than the
haviour and its errors and for being able, on their long-term average of a near reference period. The
basis, to derive trends for the future. reference period for calculating such anomalies usu-
ally is from 1981 to 2010. The monthly outlooks are
A climate prediction considers all the pieces of infor- based on the analysis of the running mean over the
mation available about the climate system. For this past 20 years.
purpose, all globally available observations are fed
(assimilated) into the climate model and numerous
▶ Schematic representation of climate prediction:
The starting point of a climate prediction model
depends on the past climate conditions. Different
sets of initial conditions (see magnifier) lead to dif-
ferent model outputs for future time periods.
They are taken into account and form together a
prediction ensemble. The analysis of the ensemb-
le allows statements to be made about the spread
and probability of climate events.
13Climate projections for decades and centuries ahead Compared to climate predictions, climate projections assumptions made, climate projections provide infor- depend only insignificantly on initial states. In their mation about the future state of the climate. context, boundary conditions are of much greater importance. Boundary conditions refer to external fac- The scenarios used are referred to as Representa- tors of influence. In addition to natural factors, such as tive Concentration Pathways (RCPs) and represent the varying solar constant and volcanic eruptions, the very widely varying socio-economic pathways of climate is also significantly influenced by anthropo- development and the related different impacts on the genic interferences, such as greenhouse gas emissions Earth's radiation and energy budget. The different and land-use changes. impacts are a result of the underlying scenarios con- As a basis for climate projections, the changes expect- sidering the wide range of potential changes in green- ed to occur during the coming decades and centuries house gas emissions. are evaluated in the form of scenarios. Based on the 14
Currently, the focus is on four scenarios up to 2100                      In order to assess the reliability of a climate model, it
which have been developed in preparation of the IPCC                      is important to simulate the state of the climate over
Fifth Assessment Report: RCP2.6 (mitigation sce-                          past time periods for which comprehensive sets of
nario), RCP4.5, RCP6.0 and RCP8.5 (business-as-usual                      observation data are available. The criteria for such
scenario). They form the basis for assessing the range                    evaluation include, among others, the satisfactory
of future climate changes.                                                reconstruction of averages over the studied period, of
                                                                          the frequency distributions of the data values, of the
The numbers of the scenario names relate to the addi-                     minimum and maximum values (magnitude and fre-
tional radiative forcing level expected at the end of                     quency of occurrence) or of the annual variation cy-
the 21st century, i.e. the additional amount of energy                    cle, the spatial occurrence patterns and the changed
(e.g. 8.5 watts per square metre (W/m2) in the RCP8.5                     signal observed during the studied period. Another
scenario) in the climate system in 2100 compared to                       essential criterion is whether a climate model is able
the years 1861–1880.                                                      to provide a realistic reproduction of the so-called cli-
                                                                          mate sensitivity, which is usually understood as the
Climate projection activities are co-ordinated world-                     atmospheric warming following a doubling of the car-
wide as part of the Coupled Model Intercomparison                         bon dioxide concentration in the atmosphere.
Project (CMIP) initiative set up by the World Climate
Research Programme (WCRP).

▲ Schematic representation of climate projection: The black line describes the natural variability of an equilibrium GCM model. This is the so-
called control run, performed irrespective of external influence factors. The black dots represent the various states of the climate from which
historical calculation runs are started. From these points onwards, the climate system's equilibrium conditions are disrupted by changing the
greenhouse gas concentrations in the atmosphere. The different sets of initial conditions lead to different outputs for the future climatic de-
velopment within one and the same scenario. The starting points are typically set 50 years apart from each other.

                                                                                                                                           15
Outlook on the climate conditions for the
next weeks
Because of the chaotic behaviour of the atmosphere, it is not possible to make reliable weather
forecasts for time horizons beyond about 14 days ahead. What is possible, however, is to provide
trend forecasts. They are based on an ensemble of forecasts, each of which starts from slightly
differing initial conditions. The ensemble is analysed using statistical methods.
DWD's activities in the field of monthly outlooks
Monthly outlooks close the gap between medium- The DWD's forecasts rely on the monthly forecasting
range weather forecasts (up to 14 days ahead) and system of the European Centre for Medium-Range
seasonal forecasts. Weather Forecasts (ECMWF). The ECMWF is sup-
ported by 34 countries with a view to pool together
As part of monthly outlooks, it is possible to calculate the resources needed for the complex simulations.
the probability of whether temperatures, precipitation
or wind will exceed or not reach certain thresholds.
This allows statements to be made about general
trends.
16Achievements
The DWD's 4-week trend forecast presents the This monthly outlook comes from a localised analysis
deviations from a reference climate (temperature, of the weekly forecasts from the 51 model runs of the
precipitation, wind) averaged over the last 20 years ECMWF Integrated Forecasting System (IFS).
for 13 German regions (federal states). It is a weekly
mean forecast for the next four weeks.
05.06.17 - 11.06.17 12.06.17 - 18.06.17 19.06.17 - 25.06.17 26.06.17 - 02.07.17
▲ Most probable temperature class. For the first and the third week, the outlook shows mostly normal conditions in Germany. During the
second week and towards the end of the forecast period, the temperatures are expected to be higher than the long-term average for the
reference period 1997–2016 everywhere in Germany.
05.06.17 - 11.06.17 12.06.17 - 18.06.17 19.06.17 - 25.06.17 26.06.17 - 02.07.17
▲ Most probable precipitation class. The model outputs show no uniform trend for Germany, but a slow change from mostly average to wet
conditions during the first week to mostly dry weather during the fourth week.
17Seasonal forecasts published by the
DWD on a monthly basis
In the context of seasonal forecasts for the coming seasons, several components of the
climate systems play a relevant role: the upper air layers above the weather-making troposphere;
the ground, which stores and releases heat and water, which may contain ice and where vegeta-
tion develops and disappears again; the sea ice, the extent of which influences the weather in the
polar and sub-polar regions; and, above all, the ocean, which transports and releases heat over
long timescales. These interactions lead to large-scale climate variations, such as the El Niño phe-
nomenon, the monsoon or the North Atlantic Oscillation (NAO) with its impact on the weather in
Europe. For this reason, the quality of seasonal forecasts depends on how well the climate model
used takes account of these climate variations.
DWD's activities in the field of seasonal forecasts
Seasonal forecasting continues to be subject to exten- By providing seasonal forecasts, the DWD enab-
sive research and continuous further development. les the timely planning of measures and the adapta-
For some of the world's regions, though, the sea- tion to relevant climate events, such as heatwaves or
sonal forecasts are already fit for providing the basis droughts, especially in the case of emerging weath-
for decision-making. er extremes. The forecasts are updated on a month-
ly basis and are made available on the DWD website
(www.dwd.de/seasonalforecasts).
◀ Together with the Max Planck Institute for Meteorology (MPI-M)
and the Hamburg University (UHH), the DWD is developing and op-
erating a system for the provision of seasonal forecasts, the Ger-
man Climate Forecast System (GCFS). The system generates global
seasonal forecasts on a routine basis, with the results being made
available to the public. It is based on the MPI-M's Earth System Model
(MPI-ESM). The ensemble used for GCFS-based seasonal forecasts
will be incorporated into an international multi-model seasonal fore-
cast ensemble system delivered as part of the ECMWF-managed
Copernicus Climate Change Service. The GCFS's ensemble will thus
be extended by the number of other international forecast ensem-
ble members. This will allow deriving more robust statements about
the future developments. The Copernicus Climate Change Service is
a European contribution to the WMO's Global Framework for Climate
Services (GFCS).
18Achievements
Seasonal forecasts for certain regions, e.g. Europe or This has a strong impact on the precipitation patterns
Germany, still have many uncertainties resulting from in many neighbouring, but also in more distant re-
the various components of the climate system and the gions and, for example, also causes a fall-off in the
complex network of interactions between them. fishery yields along the South American Pacific coast.
A good example for a robust seasonal forecast is set The plume in the figure below illustrates the poten-
by the forecast of an El Niño event, representing a tial spread of the forecasts resulting from the indi-
very strong change in the climate behaviour in the vidual GCFS ensemble members. A narrow plume
tropical Pacific. The strength of such an event is esti- means that even despite the slightly differing ini-
mated on the basis of the mean sea surface tempera- tial conditions all the ensemble members come to
ture anomaly in a certain region of the Pacific, i.e. the very similar results. The wider the plume is, the
Niño 3.4 region. An El Niño event occurs when the larger the uncertainty of the expected result. It is
mean sea surface temperature anomaly rises above normal that the uncertainty increases over the length
0.5 °C for at least three consecutive months. of the forecast period. The darker the colour is, the
stronger the anomaly. The blue background colours
Normally, the climate in the tropical Pacific is char- symbolise a La Niña event. It is the counter phe-
acterized by trade winds pushing the warm surface nomenon of El Niño and during which strengthening
water away from the American coast towards Asia. trade winds push the surface waters towards the
During an El Niño event, the trade winds become west.
weaker or even do reverse. As a result, the warm sur-
face water flows back in an eastward direction.
▶ Observation and forecast of the sea surface tempera-
ture (SST) anomaly in the tropical Pacific. For this anal-
ysis, the temperatures over the central tropical Pacific
(Niño 3.4 region) were averaged over each month. The
anomaly is the deviation of the temperatures from the
climate normal over the reference period 1981–2010.
The blue line illustrates the data observed by the US-
American National Weather Service (NOAA/NWS). The
red dot represents the model's result for the time period
that lies immediately before the forecast. The grey-col-
oured plume shows the spread of results predicted by the
GCFS' ensemble forecast for this region for the next few
months. The different shades represent the percentage of
forecasts at a certain distance from the ensemble medi-
an. Source: www.dwd.de/seasonalforecasts
19Participation in the development
of decadal climate predictions
Decadal climate predictions describe the climate development trends for the next few years up
to a decade. Thus, they cover a time frame which is of crucial importance for political, economic
and societal decision-making and for the planning of climate adaptation measures. Enhancing their
quality and reliability is one of the focus areas of climate research in Germany, together with the
development of a regional ensemble forecasting system for decadal climate prediction.
DWD's activities in the field of medium-term climate predictions
Decadal climate predictions are currently a key topic result, it will be possible to derive statements about
in international research because they cover a time what climate trends to expect and where the trouble
horizon which is of vital importance for many kinds of spots might be in the context of climate change. The
planning activities. They are the focus of the MiKlip regional downscaling of decadal climate predictions, a
project on medium-term (decadal) climate predic- feature of great importance to decision-makers, is also
tions, funded by the Federal Ministry of Education and part of the ongoing work under the MiKlip project.
Research (BMBF). The DWD is partner in this project. Another focus is on the dialogue with users. The aim
is to develop customised decadal forecast products in
The goal is to explore medium-term climate prediction co-operation with users.
and develop a global forecasting system for decadal
climate predictions. This model system will be used Upon the successful completion of the project it is
for forecasting future changes both in the mean cli- planned to integrate the model system directly into
mate conditions and in the climate's extreme manifes- the DWD's operational service.
tations of weather on timescales up to ten years. As a
Achievements
The MiKlip research activities include a number of To illustrate the current state of the research on
experiments on predictability, process understanding decadal climate prediction (which, at present, must
and proving the forecast skill. in no way be used for decision-making), some of the
results of the development phase published at the
beginning of 2017 are shown below.
20The decadal climate prediction system is aimed at 2018–2021, etc., until 2023–2026) and for larger spa-
representing climate trends over longer time periods tial scales (e.g. 250–500 km). The mean values are cal-
(e.g. the 4-year periods over the years 2017–2020, culated from the results of single ensemble members.
▲ Four-year mean temperature anomalies relative to the period 1981–2010: observed development and forecast. The forecasts of the ensem-
ble means for the 4-year global mean surface temperature indicate a continuous increase and are higher than the values observed so far. The
anomaly calculated for the forecast horizon 2017–2020 is +0.6 °C. The values are shown in different colours depending on the forecast skill
level in the past.
Source: MiKlip forecasts website (http://www.fona-miklip.de/decadal-forecast/forecasts-archive/decadal-forecast-for-2017-2026/ )
temperature anomalies (°C) relative to 1981 - 2010
▲ Temperature anomalies on the example of the 4-year mean for the period 2017–2020 relative to the period 1981–2010. Only those grid
boxes which reached a certain forecast skill level in the past are coloured. The trend of the temperature anomaly varies regionally. Tempera-
tures that are below those in the reference period, however, are only expected in very few regions. A relative strong, positive anomaly shows
in some regions within the Arctic Circle.
Source: MiKlip forecasts website (http://www.fona-miklip.de/decadal-forecast/forecasts-archive/decadal-forecast-for-2017-2026/ )
21Climate projections produced by
the DWD
Climate models are able to project the future climate based on scenarios. Ensembles of a
sufficiently large number of climate projections, which are globally available through the
collaboration with a multitude of institutions, allow statistical statements to be made about
possible future climate conditions. The results from the analysis of such climate ensembles, for
example, form the basis for the DWD's German Climate Atlas. The DWD furthermore contributes
to the further development of regionalisation methods aimed at better describing the impacts of
a changing world climate on the climate conditions, for example in Germany.
DWD's activities in the field of climate projection
So far, the DWD's activities have mainly been dedicat- BMBF. The DWD is a partner in both projects. The
ed to regional climate projections, and this especially CMIP5 simulations assessed by the IPCC's Fifth
for Europe and Germany. To this aim, globally avail- Assessment Report are evaluated systematically for
able data from the latest climate projections are collect- Germany and complemented by further regional cli-
ed, analysed and made available to the users. mate projections based on both dynamical and statis-
tical methods.
Regional climate projection activities are currently co-
ordinated by the Coordinated Regional Climate Down- In connection with the German contribution to the
scaling Experiment (CORDEX) of the World Climate global CMIP6 simulations and the IPCC's Sixth
Research Programme (WCRP). The simulations which Assessment Report (AR6), the DWD participates in the
are currently available for Europe use a grid size of BMBF-funded collaborative project for the 'Provi-
approx. 50 km (0.44°) and 12.5 km (0.11°). Like for the sion of the national contribution to the IPCC/AR6 data-
climate predictions, projection results are often present- base and support of CMIP6+ activities in Germany'
ed as deviations from a fairly near reference period. (CMIP6-DICAD).
These deviations are also referred to as climate change
signal. The DWD has based its work on the MPI-M's Earth
system model (see graphical illustration on page 10)
These international activities are supported at the na- and thus supports the international CMIP6 ensem-
tional level by various research projects. Examples are ble of climate projections by delivering scenario
the Network of Experts funded by the Federal Min- experiments. Another goal pursued by the DWD in the
istry of Transport and Digital Infrastructure (BMVI) or context of this project is to further develop the ICON
the collaborative project ReKliEs-De (Regional Climate model for climatological time periods together with
Projections Ensemble for Germany) funded by the implementing a finer, local-scale grid resolution over
Europe.
22Achievements
New global and regional climate projections are pro- The specific user requirements have always to be
duced at regular time intervals using updated scenar- taken into account when dealing with these tasks.
ios and improved models. They are relevant for cli-
mate impact research and informed policy-making. For Germany, the analysis of the climate projections
Considering uncertainties in the scenarios, in the cli- for the business-as-usual emission scenario (RCP8.5)
mate system and in the models used, the key task here shows an increase in surface temperatures by 2.8–5.2
is to determine robust change signals for relevant cli- °C in the period 2071-2100 (compared to 1971–2000).
mate parameters and indices. Special methodological The projected changes in precipitation vary largely
challenges arise in connection with the derivation of between the different regional climate models. Ac-
statements about extreme atmospheric, oceanograph- cording to the projections, Germany can expect in-
ic and hydrological conditions. creasing or decreasing precipitation up to ±26 %.
▶ Temperature and precipitation change signals (areal means for
Germany) for the period 2071–2100 compared to the reference peri-
od 1971–2000 in the business-as-usual scenario. The graphic illus-
trates the spread between the temperature and precipitation chan-
ges projected by the various models. While all climate projections
consistently hint at increasing temperatures, even though at differ-
ently pronounced levels, the change in precipitation totals is less
clear. Increases as well as decreases in annual precipitation are
projected. Source: DWD/ReKliEs-De Newsletter No. 2 (adapted)
The Deutscher Wetterdienst provides advice and support for users of climate
data on issues related to adaptation to climate change.
The services offered include
• consultancy regarding all questions about climate change;
• statistical analyses of climate projection data;
• release of climate projection data and products
(for example via the DWD's Climate Data Center)
Any questions regarding this can be addressed to the DWD at
klima.offenbach@dwd.de
2324
Priorities for future work

The Deutscher Wetterdienst, in line with its statutory mandate, provides meteorological and
climatological information ranging from weather forecasts through to climate projections. For the
time horizons beyond those covered by traditional weather forecasts, this is done with the help of
climate models. Today's climate models cover all essential components of the climate system. But
they still need further improvement in order to provide an even better description of the climate
system with all its components and all interactions between these and to increase the quality of
resulting predictions and projections. Increasing the availability of observation data and analysing
ensembles are vital preconditions for reducing uncertainties. Moreover, statistical models offer a
promising approach and thus can be increasingly used in the future for ensemble enhancement.
A further challenge is the provision of results with higher spatial resolutions down to the local/
municipal level. The use of increasingly finer grids in numerical models brings other components
of the climate system into focus, which, because of their complexity, had so far not been
sufficiently clear in modelling. Examples are the climate impact of buildings and atmospheric
chemistry. Such questions are addressed through climate research and will, if successfully solved,
be included in the next generation of climate models.

Seasonal and decadal predictions, in particular, require more work to be done to reduce
uncertainties and improve their validity at the regional level. The particular importance of this
type of prediction has been emphasised within the framework of the ongoing World Climate
Research Programme (WCRP). An important factor in the development of climate predictions
and climate projections is the collaboration with the potential users, such as the insurance, wind
energy and transport sectors, disaster management institutions and farming industry.

The DWD's long-term goal is to achieve seamless climate prediction/projection capabilities at all
temporal and spatial scales. The work on it has already started with the changeover to the ICON
model. It is expected that climate predictions will be improved largely by this new state-of-the-
art model system. The DWD's activities are aimed at supplying the users with improved climate
prediction and climate projection products.

                                                                                                     25
Publishing details Authors Jennifer Brauch, Kristina Fröhlich, Barbara Früh, Heidi Seybert, Christian Steger Editorial team Barbara Früh, Heidi Seybert Layout and typesetting Michael Kügler, Marcel Reichel, Heidi Seybert Translation Gabriele Engel Picture credits DWD: 3 (left, middle: Claudia Hinz), 5 ESA: 22, ESA-ATG Medialab: 24 Panthermedia.net: 3 (right: Ingram V. Cicorella), 8 (kptan), 16 (Robby Böhme), 18 (top: Markus Gann, bottom: Ueli Bögle), 20 (Klaus Raab) Pixabay: 4, 6, 12, 14 Figures Front cover: DWD/Fotalia.de (earth globe: Anton Balazh, historical sea map: caz) DWD (unless otherwise specified) Online edition This publication is available in electronic form on our website at www.dwd.de/climateforecastsandprojections The online issue is subject to license: http://creativecommons.org/ licenses/by-nc-nd/4.0/deed.de Citation information DWD (2018): Climate predictions and climate projections; Deutscher Wetterdienst, Offenbach am Main, Germany, 28 pages. ISBN 978-3-88148-512-8 (Print) ISBN 978-3-88148-513-5 (Online) Editorial deadline (German edition): August 2017 26
27
Visit our climate
                                                                                 research page

Deutscher Wetterdienst
Climate and Environment Consultancy Department
Central Climate Office
                                                                                                     DWD 1st edition 500 / 06.18

Frankfurter Strasse 135
63067 Offenbach
GERMANY                                          Through our website at www.dwd.de
Tel: +49 (0) 69 / 8062 - 2912                    you have also access to our pages on
Fax: +49 (0) 69 / 8062 - 2993
E-Mail: klima.offenbach@dwd.de
International co-operation on climate change mitigation and climate research In December 2018, the 24th Conference of the Parties (COP24) to the United Nations Framework Convention on Climate Change (UNFCCC) was held in Katowice, Poland. Like the preceding two COP sessions, the Climate Change Conferences in Bonn and in Marrakech, this conference focused on the implementation of the efforts for climate pro- tection agreed during the Paris Climate Change Conference (COP21) in December 2015. COP21 brought a decisive breakthrough when 197 countries came, for the first time ever, to a general and legally binding global agreement on climate change. The agreement includes a global plan for action aimed at keeping the global temperature rise well below 2 °C, if possible even below 1.5 °C compared to pre-industrial levels in order to reduce the impacts of climate change. Despite the USA having announced their withdrawal from the agreement, COP24 has achieved further important progress because the international com- munity has agreed on common rules for its implementation. All countries should apply com- parable standards for measuring and reporting their greenhouse gas emissions. It was laid down that from 2023 a global stocktake on the progress made in mitigating climate change should be carried out every five years and it was specified which information should be considered in that context. Consultations were held within the framework of the so-called “Talanoa Dialogue” to examine how to improve climate actions. The special report on the impacts of global warming of 1.5 °C and associated policy measures, published just before COP24 by the Intergovernmental Panel on Climate Change (IPCC), received high attention in the dialogue. The issue of market mechanisms like emissions trading should be addressed at the next COP25 in Chile (probably in January 2020). The scientific basis for the Paris Agreement was the Fifth Assessment Report (AR5) of the IPCC published in 2013/2014. The IPCC was founded by the United Nations Environment Programme (UNEP) and the World Meteorological Organization (WMO) and acts as an inter- national coordination and a scientific body. The reports of the IPCC refer to scientific publica- tions of many experts. The reports describe the possible development of the Earth‘s climate and the resulting impacts up to the end of the 21st century, revealing evidence that, without any reduction in greenhouse gas emissions, it is very probable that the Earth‘s climate and its manifestations will have changed considerably compared to today. Climate research plays an important societal role at the global level, in Europe and in Germany. It is not only focused on exploring the natural scientific foundations of climate change or on developing climate models and running global, regional and localised climate simulations, it also examines the expected impacts and helps to identify possible measures for adapting to the climate change. The preparations for the IPCC‘s Sixth Assessment Report have started; its publication is planned before 2022. In it, account will be taken of the latest scientific findings that result from climate simulations.
Publisher
Deutscher Wetterdienst
Climate and Environment Consultancy Department
Central Climate Office
Frankfurter Strasse 135
D-63067 Offenbach/Main

Translation of German edition “Die internationale Zusammenarbeit
zum Schutz und zur Erforschung des Klimas, Februar 2019“
You can also read