Reviving failed projects: Comparing the short
term and long term performance in EU-funded
                 airport failures
←
→
Page content transcription
If your browser does not render page correctly, please read the page content below
Reviving failed projects: Comparing the short
term and long term performance in EU-funded
airport failures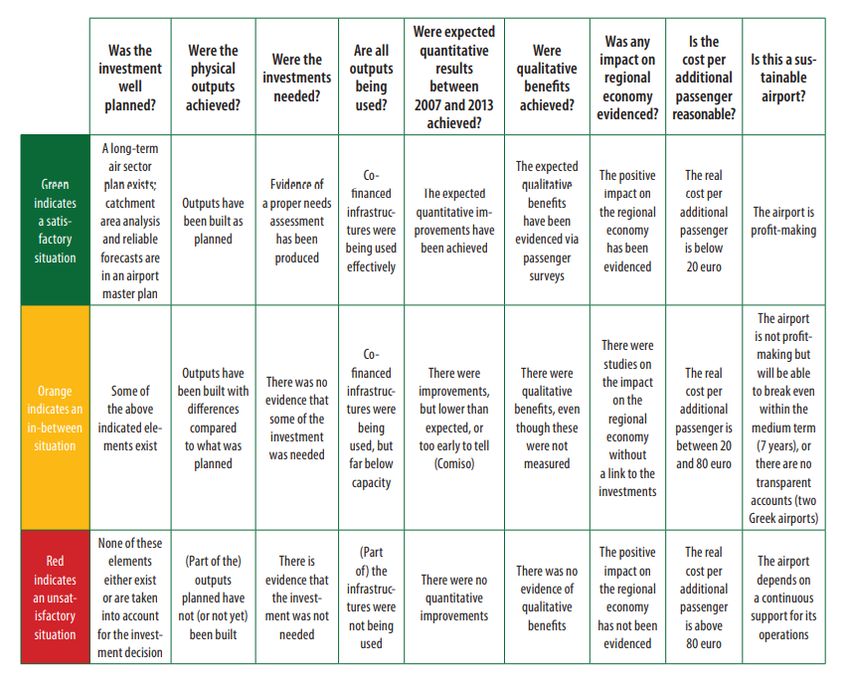
COLOPHON

Title:            Reviving failed projects: Comparing the short term and the long term
                  performance in EU-funded airport failures.
Author:           Jorn Alkema

Contact:          j.alkema.1@student.rug.nl

Student Number:   S3820149

Bachelor:         Spatial Planning & Design

University:       University of Groningen

Version:          Final Version

Date:             11 June 2021

Supervisor:       Drs. K.V. Bandsma

                                                                                         2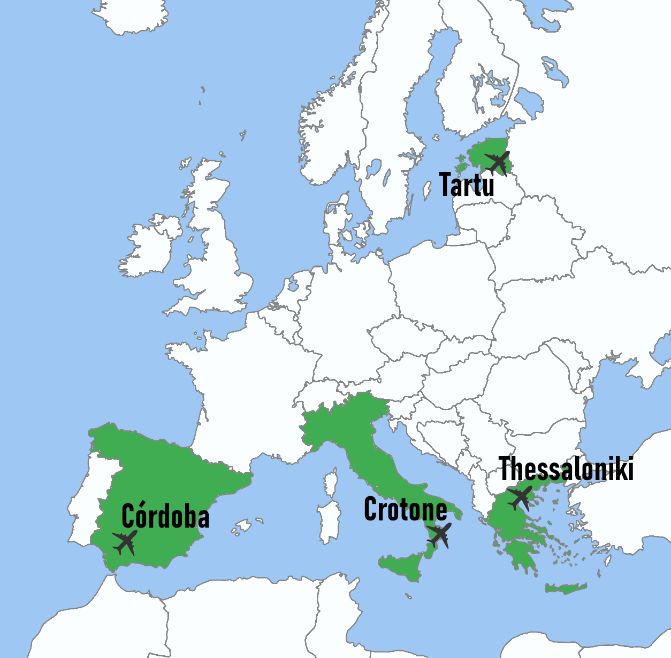
TABLE OF CONTENTS

ABSTRACT                                                5
INTRODUCTION                                            6
   ECA Report                                           6
   Research Questions                                   7
   Relevance                                            7
   Structure                                            8
THEORETICAL FRAMEWORK                                   9
   Introduction                                         9
   What is Project Success and Failure                  9
   Management and facilities                            9
   Defining Project Revival                             9
   Airports And Tourism                                 10
   Conceptual Model                                     10
METHODOLOGY                                             12
   Quantitative Research Method                         12
   Cases                                                12
   Research and Quantitative Data                       12
   Research and Assessment                              13
       ECA Assessment                                   13
       New Assessment                                   13
       Assessment Table                                 14
   Data Collection                                      14
   Comparative Analysis                                 14
   Discussion                                           14
RESULTS                                                 15
Córdoba Airport                                         15
   Data Comparison                                      15
   Assessment                                           16
       ECA - 2007-2013                                  16
       New assessment - 2013-2019                       16
   Assessment Table                                     17
Crotone Airport                                         18
   Data Comparison                                      18
   Assessment                                           19
       ECA - 2007-2013                                  19
       New assessment - 2013-2019                       19
   Assessment Table                                     20
Thessaloniki Airport                                    21
   Data Comparison                                      21

                                                             3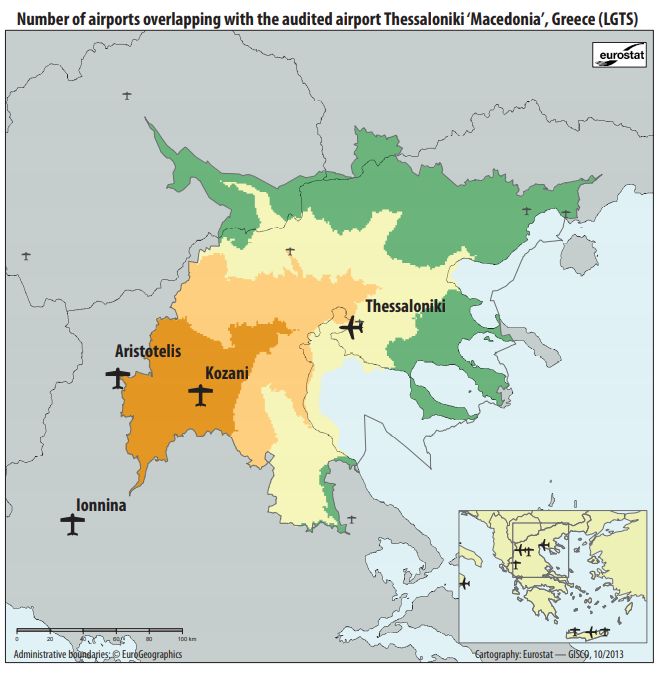
Assessment 22
ECA - 2007-2013 22
New assessment - 2013-2019 22
Assessment Table 23
Crotone Airport 24
Data Comparison 24
Assessment 25
ECA - 2007-2013 25
New assessment - 2013-2019 25
Assessment Table 26
Conclusions of the Results 27
CONCLUSION 28
Reflection 28
Further Research 28
REFERENCES 29
Scientific articles 29
Books 29
Online Sources 30
Databases 31
APPENDIX 32
Table of Contents 32
1 Córdoba Airport - Additional Data 33
Table with passenger data and source 33
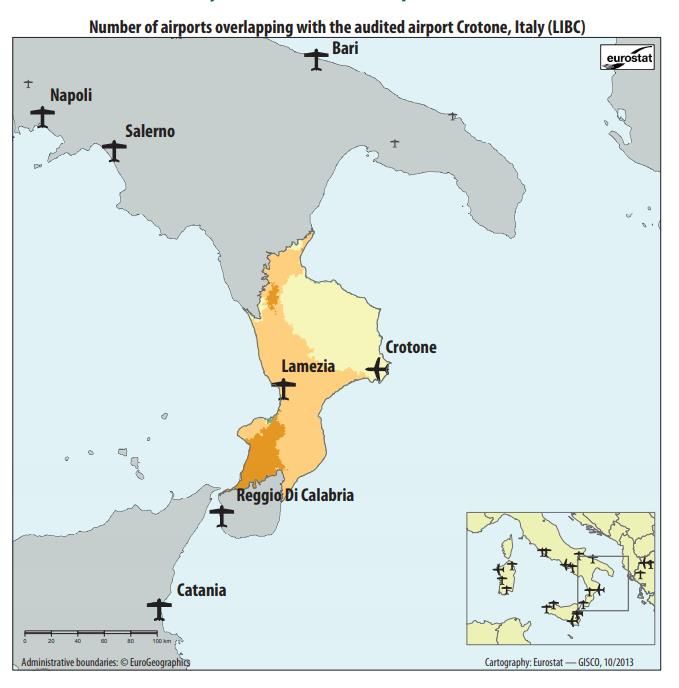
Map of overlapping airports 34
2 Crotone Airport - Additional Data 35
Table with passenger data and source 35
Map of overlapping airports 36
3 Thessaloniki Airport - Additional Data 37
Table with passenger data and source 37
Map of overlapping airports 38
4 Tartu Airport - Additional Data 39
Table with passenger data and source 39
Map of overlapping airports 40
5 ECA Report – General Assessment Table 41
6 ECA Report – Grading Criteria for General Assessment Table 42
4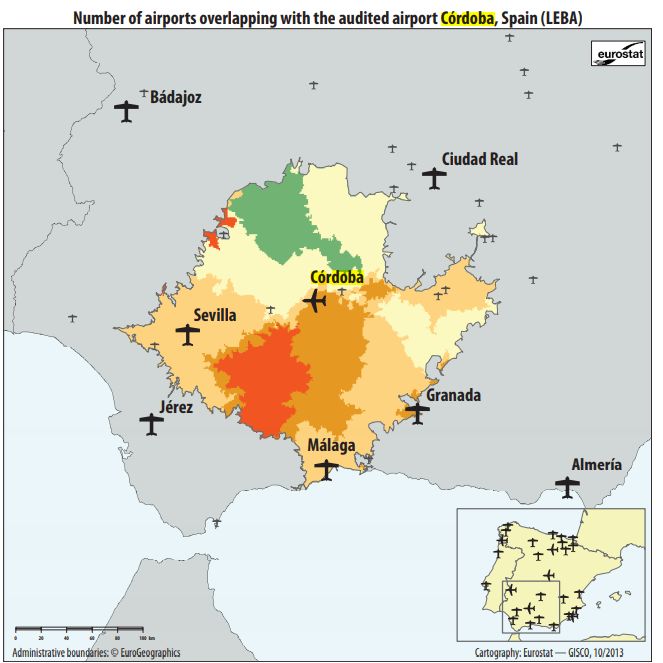
ABSTRACT
        A critical report by the European Court of Auditors investigated the EU-funded renovation
and building projects at 20 airports in 5 countries in Europe. It deemed all airport a ‘poor value
for money’. This thesis looked at the long term relevance of the investments by looking at the
performance of 4 of the 20 airports during the 2013-2019 period. A good long term strategy may
in some cases result in project revival however, but as few projects are the same, not many
research progress has been made regarding project revival. Using a comparative quantitative
approach, this thesis looked into whether project revival was present in these cases and what we
could learn form it. The research on the long term found promising trends at 3 of the 4 airports.
2 of 4 airports can be considered sustainable airports and one of them can even be called a
success. The results confirmed existing literature on the relevance of long term analyses when
assessing project performance. Project revival thus was apparent in 3 of the 4 cases, which
showed similar conditions in the 2013-2019 period, such as takeovers by larger entities, good
catchment areas, rising tourism numbers and a good use of the EU-funds.

                                                                                                     5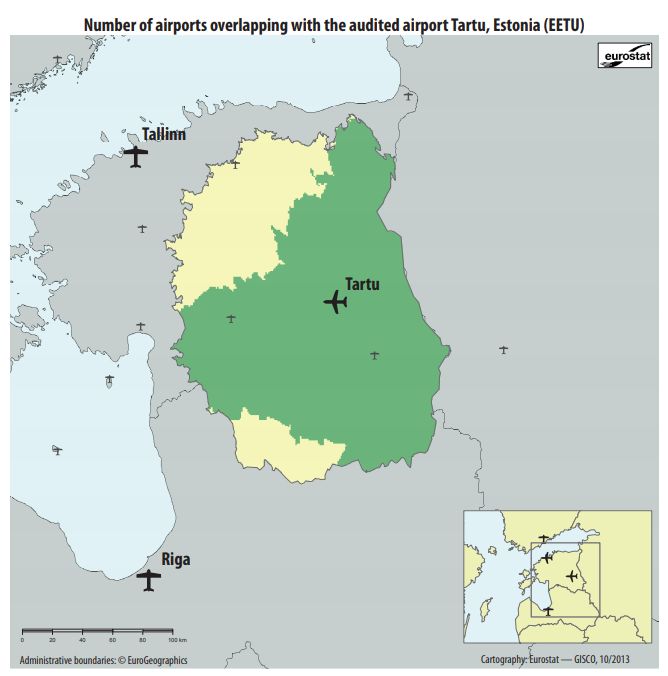
INTRODUCTION

          The 21 century saw an enormous rise in tourism travel and air travel (Law, 2018).
Airports saw steep rises in traffic and many governments stepped in to expand or fund their new
or growing airports. But many of these airports did not achieved their intended goal and stagnate
or fall into decline. Not only debatable investments have found their way into the air travel sector,
with many airports being dependent on the indefinite rise of tourism, the financial crises of the
last decades have proven to be detrimental to the sector. The EU also is no stranger to airport
failures (Harter, 2012; Crisp, 2014; Hutchinson, 2015). Massively exceeding costs, disappointing
returns or just poor investments seem the most common reasons for airport failure.
          These three reasons of project failure were all apparent in a report by the European Court
of Auditors from 2014. The audit focused on 20 EU‑funded airports in five member states
(Estonia, Greece, Spain, Italy and Poland). These airports received a total EU funding of 666
million euro. However, most of the airports failed in the research period (2007-2013) and were
dubbed by the audit as a poor value for money. Most often the funds were spent on the wrong
things or were not even needed in the first place. Although every airport in the research had
finished their renovations and projects by the end of 2013 and could be covered in the report, it
fails to make a long term analysis of these failed airports. As De Wit (1988) stated not all failed
projects fail in the end, some may eventually land on their feet and become great successes. To
test this statement, this thesis will focus on the performance of several of the airports studied by
the ECA and see whether there is a positive or negative trend. Several crises, such as the global
financial crisis of 2008 had enormous impacts on the air travel sector (Ringbeck et al., 2009).
Many national crises continued in the following years, especially in Europe’s peripheral countries,
in which all airports in the report are situated. This could have affected the results of the report
and obscured the potential of certain cases. Besides that it has been evident that air travel has
been on the rise once more (Law, 2018), thus bringing new opportunity to the airports. Therefore
we can assume the airports have seen more favourable circumstances and we can assume a more
positive performance since the ECA assessments were made in 2013.
          Researching how different airports made different approaches and resulted in different
outcomes, may give an insight in how failed projects may be revived. During or after completion,
many unexpected factors can influence a project and often times there is no preventing the
outcome, which follows. An unexpected ill-timed financial crisis can halt a very well organised
project. Obviously, preventing project failure is preferable, but as bad investment and project
failure is still apparent all over the world, a greater knowledge about project revival can prove to
be beneficial for many cases. Although one might suggest every project is different, reasons for
failure can be similar in different sectors. Thus suggesting a similar occurrence in project revival
is not unthinkable. Of course there is not one solution for all failed projects, but finding beneficial
developments in revived projects can always be tested to other failures.

ECA-Report
         The report made by the ECA (2014), we will be the base of this research. If ‘the report’ is
mentioned, I will be talking about their research. I will build upon their findings and try to test
their legitimacy in the long term. Even though the report was overall very clear, the Audit was
vague in several instances and did not support their statements or findings with scientific support
at all. Many claims and the general assessment was based on individual observation by the Audit.
To try giving a more complete view of the cases and causes of failure, I will try to define certain

                                                                                                          6
concepts and test them to the report. Besides that I will try to incorporate these missing concepts
and theories in my own research, so this thesis may expand on the scope of the research by the
Audit.
        It is also important to explain the short term assessment en long term assessment in this
thesis. Short term and long term don’t refer to an universal span of time and can therefore be
vague or unclear. Therefore short term in this case is the 2007-2013 assessment by the ECA. Only
5 of the 20 projects finished construction before 2007, so in many instances this assessment
period is a lot shorter. The long term will be the period form 2013 onwards, with exclusion of the
corona pandemic period, thus till 2019. Using this time frame this thesis will have a similar
research period as the ECA and avoid deviations because of data affected by the COVID crisis. The
pandemic has had an enormous impact on air travel and airports. With no insight in post
pandemic trends, this period is excluded from the statistical assessment. When referring to short
term, this report refers to the audit’s assessment period of 2007-2013 and when mentioning the
long term it refers to 2013-2019 period.

Relevance
         This thesis tries to research the impact of poor EU investments in the long term as the
ECA did for the short term, and expand on their research by trying to find an explanation for the
downfall or revival of a project in the long term. This can be very relevant for poor performing
project now and in the future. Every project has their own special conditions and circumstances
under which it fails or succeeds. Conditions meaning the state of things directly related to the
airport; management, passenger numbers, catchment area, etc. And circumstances being the state
of things which are not directly related the airport; crises, tourism, politics, etc. Through
researching revived projects, similar failing projects could get an overview of what to do and what
not to do when they are trying to improve performance of their project (Jiang et al., 2002).
Although, the focus here is on airports, but when assuming project revival is possible in the long
term under certain conditions, with the right research, this should be possible in many other
fields too. So its relevant for us to explain long term performance and look at which conditions
and circumstances concluded in which outcomes. Of course we should strive to prevent project
failure and poor project investment, but as this seems to be impossible to prevent entirely, project
revival may offer a great solution for many cases. As project revival may seem primarily of social
and policy relevance, further research on the subject can also achieve scientific relevance.
Knowing the relevance of certain conditions and circumstances on airport/project failure or
success, can make researching success and failure more straightforward. Also mapping out these
conditions and circumstances in different sectors may be of great use when researching the
failure, success, revival or decline of a project.

Research Questions
With that said, the following research questions are proposed:
‘To what extent is project revival apparent while looking at the long term change in the failed
airport projects in respect to the short term?’
With the subquestions:
        - What is project revival?
        - How does one measure if an airport has been revived?

                                                                                                       7
- Is there a positive or negative long term trend when comparing statistics from 2007-
2013 to those of 2013-2019,
- What conditions and circumstances contributed in the eventual situation of the
airports in 2019?
- Which conditions and circumstances resulted in beneficial outcomes and which did
not?
Structure
To answer these questions this thesis will first discuss the theories about project failure,
project success and project revival. Then the methodological structure of the research and terms
of assessment are explained. After which I will present and compare the data and findings on the
four airports separately and consequently conclude whether my findings differ from the ECA
statements from 2014. Finally I will present and try to explain my findings in a conclusion.
8THEORETICAL FRAMEWORK
Introduction
To answer the first two sub questions some concept we need to know what is meant with
project revival and how to measure when a project has been revived. To explore that we have to
know what defines project failure and project succes.
To answer sub questions 4 and 5, explanation is needed on conditions and circumstances.
What internal and external factors influence the performance of an airport and which impact
project failure and success.
What is Project Failure and Success
According to De Wit (1988), project success and project management success are two
separate subjects. Project management including how and by who a project is regulated. Although
often intertwined, project management success does not always accomplish project success or
vice versa. Other writers confirm management is key to project success (Prabhakar, 2008; Jiang
et al. 2002). This difference is apparent in most airports’ cases, but is not included by the ECA.
The new assessments will try to include the differentiation between both subjects.
It seems most research agrees that success is a relative and subjective measurement and
thus is not considered to be a simple definable concept (Prabhakar, 2008; Anderson et al., 2006;
Prasser, 2007). They do agree on multiple premises; Project success is stakeholder dependent
and thus a project can both be deemed a success and failure at the same time, by different
stakeholders. Furthermore, success is dependent on performance and performance in its turn
being dependent on previously set objectives or goals by said stakeholders. For this research to
include stakeholder perceivance a qualitative research would be needed. Although, this research
does not neglect the value of qualitative data when assessing airport success, but will not expand
on it either as other research has already proven this link exist (Beak, 2019; Jiang et al. 2002).
Management and Facilities
De wit (1988) mentions the division between success and management success. Airport
management is key to their performance (Beak, 2019) and includes several things such as the
handling of staff, security and who is in charge. The latter is most interesting to us as we do not
need to acquire qualitative data to research for our cases.
According to Losada et al. (2012) airports are heavily dependent on their revenue to
uphold their maintenance and quality of facilities. Especially smaller airports have problems with
this when the are not part of a larger airport group. Revenue is mostly generated from the
passengers, so the amount of passenger passing through an airport is essential for its
performance. Those facilities, such as a good functioning terminal, good connections with
surrounding areas via public transport/taxi’s and adequate runway and apron space are essential
to the growth of the airport, which it needs to process passengers. An endless loop, which easily
falls apart in smaller privatised airports. Being part of larger airport groups is therefore most
beneficial for smaller airports (Losada et al., 2012).
Defining Project Revival
Project revival has been used as the literal resurrection of abandoned projects (Doraismay, 2017),
but this definition does not apply to this thesis. Going by the literal meaning given by the oxford
dictionary, revival means ‘an improvement in the condition or strength of something’. The
9definition used for project revival in this thesis will be as follows: ‘A notable improvement in the
conditions, circumstances and performance of an airport.’
Assessing success is difficult in a sense that success for one, does not necessarily means
success for the other. Slight success or great opportunity to success might also be considered an
improvement in performance an therefore considered as project revival. How notable such an
improvement is will always be to the assessor, which should in every case strive to be
independent. Conditions and circumstances are easier to define however. When assessing
whether a project is revived an assessor should capture as much of the relevant internal and
external factors in their assessment as possible.
Airports and Tourism
Even though it's not viable to look at the whole of tourism and the effects on airports, it’s
important to consider a couple of things.
Harvey et al. (2009) and Lei et al. (2011) note that financial crises are a massive
contributor to tourism decline and because air travel mostly consists of tourism travel (Graham
et al., 2008), we can assume that financial crises can indirectly have an enormous impact on
vulnerable airports.
Because crises and (inter)national (financial, social or political) problems can influence
tourism patterns and money flows so much, the aviation industry is a very unpredictable and
changeable sector. Elaborate long term plans for airports have proven to be unsuccessful because
of this, as the theatre of air travel is so susceptible to change that predicting the situation of an
airport a decade in advance is very hard (Kwakkel et al., 2010). Consequently one can assume
that a long term assessment can say more about an airports performance, than a short term
assessment, because so much can have changed.
Conceptual Model
Using the above, the following model is made. When a project, in this case an airport project, is
initiated goals are set by stakeholders. With the completion of the project several conditions
determine success or failure. First off whether the goals are achieved and how the stakeholder
perceive this. The projects time and cost overrun might influence the achieved goals and
stakeholder perceivance. The overall performance of the project and the management during and
after completion have their own share in the success or failure. Circumstances surrounding the
project or external factors, such as a concurrent crisis, political unrest, etc. may also influence
failure or success. Depending on all these conditions and circumstances a project is either
declared or perceived as a success or a failure. Over time, the conditions and circumstances
surrounding a project might change or stay the same, resulting in three possible outcomes; A
project stays a failure or success; A failed project is revived and becomes a success; A project
success falls into decline and becomes a failure.
10Figure 1: Arrows indicate the transition to a next stage in a project. Solid lines are part of or linked with the connected
boxes. The dotted lines indicate how conditions and circumstances influence the success or failure of a project.
11METHODOLOGY
Quantitative Research
To answer the question, ‘To what extent is project revival apparent while looking at the long term
change in the failed airport projects in respect to the short term?’, we need to gather the short
term data, search for the long term data and finally compare them to the conditions for success
and projects revival.
It's vital to gather and organize existing data from all necessary cases to make comparison
more approachable and sufficient. Thus this study will use a secondary quantitative research
method, as it makes research with high quality data possible, which otherwise would not be viable
(Healy, 2018). With this method, data can be acquired from various sources. After which a
comparative approach will be conducted on the various cases and data points.
Cases
From the 20 airports assessed by the
audit four of the most poor performing airports
were chosen from the remaining countries.
Córdoba Airport (Spain), Crotone Airport (Italy),
Thessaloniki Airport (Greece) and Tartu Airport
(Estonia). The location of the airports within
Europe are visible on Figure 2.
Research and Quantitative Data
To answer the sub-question 3 to 5 this
report will base its data points on those
established in the report by the ECA. In Table 1
the first column shows the data from the report
and in the second column the new data needed for
comparison. Passenger trends are interesting as Figure 2: Map with the locations of the four airports.
they show us how well an airport is doing in respect to previous years. Passengers/m2 per year
give us indication of the use of the airport facilities and if they are too spacious or too small for
the number of passengers passing through each year. In some cases a forecast is made for the
coming years on how much passengers are expected. Seeing whether these expectation are met,
gives us insight in the achieved goals and performance of the airport.
12Statistical data from ECA-Report (2007- New data and missing data from the report (2007-2019)
2013)
Passenger trends (2007, 2010, 2013) Passenger trends (2007-2019)
passenger / m2 per year(2013) passenger / m2 per year (2007-2019)
Forecast Accuracy (based on forecast in 2013) Forecast Accuracy (based on forecast in 2013)
Assessment and performance New assessment and performance
General Assessment and supporting comments New assessment
Table 1: Table with data from the report and the new data needed for comparative research
Research and Assessment
ECA Assessment
The Assessment by the ECA was based on several questions listed below.
• Was the investment well planned?
• Were the physical outputs achieved?
• Were the investments needed?
• Are all outputs being used?
• Were expected quantitative results achieved?
• Were qualitative benefits achieved?
• Was any impact on regional economy evidenced?
• Is the cost per additional passenger reasonable?
• Is this a sustainable airport?
To answer these questions the Audit made a colour rating system, which is included in Appendix
6. To compare the situation from 2013 with 2019 the same questions will be asked for 2019, with
the same colour rating system in mind. But as mentioned in the theoretical framework to truly
test the sub questions 4 and 5, the conditions and circumstances which let to the 2019 situation
must be included too.
New Assessment
The new Assessment will include a research on the circumstances surrounding the airport
from 2007 to 2019. To see which external factors let to which consequences for the airport and if
they were of positive or negative impact on their situation. These circumstances include; the
impact of crises, the impact of tourism rise, the regional opportunity and the economic and
political situation of the region.
Besides external factors we will also look at the conditions in which the researched airports
operated. So we can see how internal matters influenced the airports performances for the past
years. These conditions include how the airport was management and by whom, development in
passenger trends, catchment areas and competition and how airport facility expansions and
renovations were concluded and were used.
13Assessment Table
Although this thesis researches the whole period of 2013-2019, only for 2019 a general
assessment is made. Making an assessment for previous years is unnecessary as the assessment
of 2019 makes the old irrelevant. An assessment table is included for every airport. All colour
ratings are in accordance with the criteria stated by the ECA, which is included in appendix 6.
Data Collection
Data collection will be done through collection via various online sources. For statistical
data, the ECA report can provide a great deal of information, but all new data has to come from
airport company data. Search terms include ‘passenger numbers [Airport]’,’Annual Report
[Airport]’ and the main sites of the airports. For the conditions and circumstances various
different sources were used: Info from the main websites, annual reports, news articles, various
Wikipedia pages and other informative sites.
Comparative Analysis
As explained in the theory, project revival is mostly based on whether the performance
has substantially bettered. The best way to do this is by comparing the 2013 data with 2019 data,
therefore this thesis will do a comparative analysis. Analysing the data will be done with various
tables, analysis of the passenger trends during the 2007-2019 period and a great amount of
background data from that same period. This will then be reflected on the assessment by the ECA,
after which I will conclude my own assessment on whether an airport has been revived or is still
to be labelled a failure. I also will revisit the general assessment by the ECA, which was concluded
in a table with colour rated criteria.
Discussion
In the end several data points included in the report by the ECA had no clear source or
calculations and some even seemed like vague estimation (Includes cost per additional
passenger). For other data points I found no information to replicate calculations and check
certain assessment points as the report gave no information on how these values were achieved
or gathered(Includes quality of forecasting, qualitative value of the airport and regional impact).
Furthermore the assessment by the ECA slightly touched upon economic crises as causes
of failure, but does not connect this with the failure of specific airports. Words like
‘(mis)management’, ‘corruption’ or ‘takeovers’ are never mentioned in the report although it
seems these factors can influence airport performance and are in fact present in these countries
(Charron et al., 2014). All critique seems focussed on the funding commissions, which lacked a
clear supervising role over the funded projects. Most of these other factors are included in the
new assessment and shine a new light on the causes of the failure of these projects.
14RESULTS
CÓRDOBA AIRPORT
Aeropuerto de Córdoba is a small airport in Spain in the province of Andalusia, near the
city of Córdoba. From 2006 till 2008 the airport received a total 13.468.562 euros of EU-funds,
with additional funds by the Spanish government. In 2008 the already large runway of the airport
was expanded even further costing more than 70 million euro of which 12,6 million came from
the EU. The ECA stated that upon further investigation the Spanish institutions had never any
reason to expand, as the runway was more than capable to handle the planes coming in and out
for the following decade. When construction finished, the 2008 financial crisis hit the world and
Spain was thrown into a great depression. In Cordoba, passenger numbers plummeted (Table 2;
Figure 3) all the way till the end of the crisis in 2014. Cordoba was marked as the worst
performing airport by the ECA-Report.
Data comparison
Data point 2007 2010 2013 2016 2019
Passenger trends 22.410 7.852 6.955 7.636 10.700
passenger / m2 per year 67
Forecast Accuracy (based - 4% 6%
on forecast in 2013) (179. 000) (179. 000)
Table 2: Table of several data points for Córdoba Airport from the ECA Report and supplemented by new statistics. (ECA,
2014; AENA, 2021)
Figure 3: Passenger trends for Córdoba Airport 2007-2009 (AENA, 2021)
15Assessment
ECA - 2007-2013
Córdoba scored so bad in the assessment (See Table 3) that the Audit was almost shocked how
a project like this could have received EU-funding. The only positive score Córdoba received was
because they completed their intended construction, although this was not without delay.
New assessment - 2013-2019
Spain is heavily dependent on tourism and tourism travel. As the crisis hit Spain, it hit the rest
of Europe too, resulting in a decline in tourism in the region (Smeral, 2009). With this in mind the
failure of Córdoba could not have been avoided. The large expansion of the runway and apron
could have been avoided when the parties involved actually researched the need for it. As in many
cases authorities were too optimistic about passenger increase. A study by Choy (1991) already
showed that government tourism plans have little probability of influencing market forces to
achieve economic success in destination areas. Although it seems that from 2014 onwards
Cordoba has slowly, but steadily gotten back on their feet, but now the Covid pandemic has shut
down the airport completely.
Córdoba is surrounded by large airports like Sevilla and Malaga, who both saw a decline
in 2013 too, but since then Malagas passengers have risen from 13 to 20 million in 2019 and
Sevilla saw a rise from 3.5 to 7.5 million in 2019 (AENA, 2021) further crippling chances of
Cordoba gaining ground.
Taking into account the effect of Covid, AENA will most definitely put its resources into
Sevilla, Malaga and other large airports, instead of its smaller assets as seems to be the most likely
trend according to a study by Suau-Sanchez (2020). Thus, my conclusion is that Cordoba Airport
has not been able to revive itself from failure and seems not to be able in the foreseeable future.
16Assessment Table
As of 2019 none of the investment had proven necessary an were largely not in use. Quantitative
results were also not achieved and were still far below the set goals. No information was available
on qualitative benefits or regional impact. Concluding the above assessment current conditions
and circumstances deem Córdoba Airport unsustainable.
Assessment point 2013 2019
(ECA, 2014)
Was the investment well planned? -
Were the physical outputs achieved? -
Were the investments needed?
Are all outputs being used?
Were expected quantitative results achieved?
Were qualitative benefits achieved?
Was any impact on regional economy evidenced?
Is the cost per additional passenger reasonable?
Is this a sustainable airport?
Table 3: New and old assessment of Córdoba Airport next to the general assessment made by the ECA in 2014. In Appendix 6
you can find criteria for the colour rating for all the assessment points.
17CROTONE AIRPORT
Aeroporto di Crotone-Sant'Anna is a small airport in the southern tip of Italy. In the period
from 2006 till 2011 the airport received 4.736.007 euro from EU-funds. Almost 3.5 million was
spent on expansion and renovation of the runways, taxiways and apron. The other funds went
into the expansion of the terminal and safety systems. The renovation of the terminal was actually
needed according to the ECA. Crotone also was one of three airports which did not have any delay
in building and renovation schedules, cost per additional passenger was feasible and passenger
numbers rose to an all time high in 2012. Despite these promising accomplishments, the airport
made losses between 2007 and 2012. When passenger numbers dropped by 84% in 2013 (Table
4 and Figure 4), the economic crisis in Italy hit an all time low (Dw.com, 2014) and no money was
available to save the small airport from bankruptcy. In early 2015 Crotone Airport was declared
bankrupt and the airport closed in 2016. In 2017 the management of the airport was given to the
Calabrian Airport Company (SACAL) and subsequently reopened, with great success, hitting an
all time high of 169.780 passengers in 2019
Data Comparison
Data point 2007 2010 2013 2016 2019
Passenger trends 106.122 103.828 25.180 0 169.780
passenger / m2 per year 225 104 25 0 69
Forecast Accuracy (based 8% 55%
on forecast in 2013) (306. 000) (306. 000)
Table 4: Table of several data points for Crotone Airport from the ECA Report and supplemented by new statistics. (ECA, 2014;
Assaeroporti, 2021)
Figure 4: Passenger trends for Crotone Airport 2007-2009 (Assaeroporti, 2021)
18Assessment
ECA - 2007-2013
Crotone received the worst score out of the 5 Italian airports included in the ECA report.
Although some criteria were met, when the research ended in 2013 Crotone saw the worst
decline in passenger numbers of all the cases and was deemed unsustainable by the Audit (Table
5).
New assessment - 2013-2019
According to the ECA report, Crotone Airport failed. It failed to reach its forecasted passengers
and even with rising statistics the airport did not make any profit. From the report and other
sources nothing makes us assume losses during the period 2007-2012. Mismanagement
therefore seems the most likely problem for the failure at Crotone. After the Airport went
bankrupt and SACAL took over, Crotone became bigger than it ever was within 2 years. If not for
COVID and following the new trend, the airport would have reached its 2013 goal of 306.000
passengers in 2021. However, Crotone is situated in the southern tip of Italy, which makes the
catchment area naturally rather small. Besides that the near and bigger airport of Lamezia also
saw a steep rise in passengers in the past years.
Therefore I conclude that Crotone Airport has been able to revive itself, but can not yet be
called a success. Although it has to be seen how the pandemic has affected tourism and how that
in turn will impact SACAL, chances are likely that Crotone will bounce back as it did in the 2018-
2019 period, eventually reaching its forecasted statistics.
19Assessment Table
Not all the investments proved to be necessary, but all the outputs are as of 2019 used on a regular
basis. Looking at current trends, quantitative results will be achieved in a few years. With SACAL
now in charge, certain qualitative benefits are now in place, like better security and more regular
flights. No regional impact was reported in relation to the airport. In correlation with the
assessment above and the rising number of passengers, Crotone Airport might yet become a
sustainable project.
Assessment 2013 2019
(ECA, 2014)
Was the investment well planned? -
Were the physical outputs achieved? -
Were the investments needed?
Are all outputs being used?
Were expected quantitative results achieved?
Were qualitative benefits achieved?
Was any impact on regional economy evidenced?
Is the cost per additional passenger reasonable?
Is this a sustainable airport?
Table 5: New assessment of Crotone Airport next to the general assessment made by the ECA in 2014. In Appendix 6 you can
find criteria for the colour rating for all the assessment points.
20THESSALONIKI AIRPORT
Thessaloniki Airport "Makedonia" is a large airport in the Macedonia province in
Northern Greece. It's the third largest airport of the country, after Athens and Heraklion. The
airport lies near the city of Thessaloniki, which is the second largest city of Greece. The Airport
received €54.054.434 million in the period from 2001 till 2009, of which 11.779.105 went to the
terminal expansion, 25.433.541 went to apron and runway construction and the remaining
16.841.788 went into cargo related apron and facilities. Thessaloniki was actually 1 of 4 airports
where expansion was deemed necessary by the ECA. Despite this, the expansion of the terminal
had a delay of over 4.5 years and the whole cargo expansion was deemed unnecessary by the ECA-
report. The airport passenger numbers rose from 2.2 million in 1994 to 4 million in 2007, but
then stagnated till 2013. In late 2014, early 2015 the airport was acquired by Fraport, a German
based company. Under Fraport the passenger numbers peeked at almost 7 million in 2019 (Table
6 and Figure 5). From 2015 Thessaloniki saw an enormous rise in cargo freight, with an
astounding 10% increase in 2017
Data Comparison
Data point 2007 2010 2013 2016 2019
Passenger trends 4,167,969 3.910.751 4.039.576 5.735.581 6.895.331
passenger / m2 per year 290 150 155 220 265
Forecast Accuracy (based not available not available
on forecast in 2013)
Table 6: Table of several data points for Thessaloniki Airport from the ECA Report and supplemented by new statistics. (ECA,
2014; Fraport Greece, 2021; Wikipedia, 2021)
Figure 5: Passenger trends for Thessaloniki Airport 2007-2009 (Fraport Greece, 2021; Wikipedia, 2021)
21Assessment
ECA - 2007-2013
Thessaloniki as one of the larger airports in the audit, but during the renewal projects
there were many mistakes among the successes. The stagnation of passenger traffic did not see
an upward trend after the completion of the new terminal and other facilities. Therefore the audit
was not sure whether Thessaloniki would be considered sustainable (See Table7).
New assessment - 2013-2019
Although Thessaloniki Airport was not deemed a failure and actually showed quite
positive numbers in various assessment points, the airport was definitely not called a success by
the ECA. Expansion and renovation did not come with passenger increase and many new facilities
stood empty in the early years of its construction. Therefore the airport was presented as not
profitable. After the research by the ECA, Thessaloniki Airport was privatised, acquired by a new
company, saw an almost 75% increase in passengers (till 2019) and saw a massive increase in
freight transport. Thus making the cargo expansion years earlier a useful investment in the end.
And with the Chinese now involved in the port of Thessaloniki (Van Leijen 2020), this rise will
probably continue in the coming years. Looking at the graphs and both assessments, Thessaloniki
Airport may be one of the best examples of how long term trends can not be neglected in research
(De Wit, 1988). In the past years Fraport has expanded the airport and terminal even more and
expects an 48% increase in passengers by 2026.
Covid has damaged passenger and freight traffic greatly, but with the current conditions
and beneficial circumstances around Thessaloniki, I won’t see any reason for the airport not
bouncing back in a few years. Pre-Covid Macedonia saw the most tourism of mainland Greece
(ELSTAT, 2018) and the two closest airports are so small that Thessaloniki does not have any
strong competition nearby. Thus I conclude Thessaloniki airport has been able to prove itself a
sustainable airport and can be considered a success after all.
22Assessment Table
Eventually all outputs were achieved and were all still in use by the end of 2019. During the new
assessment periods Fraport has expended the airport even more to hold up with capacity. The
investments were needed, although the ECA was correct in saying freight storage was not needed
or in use by 2013. These buildings have since seen another expansion and are now in full time
use. Quantitative measures were achieved. Qualitative measures were achieved when the
terminal expansion was completed. Tourism in the Makedonia province grew simultaneously to
the expansion of the airports capacity and thus has a regional impact. In line with the assessment
and favourable circumstances in regional development and China involved in trade, Thessaloniki
has great opportunity to expand even further, but is deemed as a sustainable airport.
Assessment 2013 2019
(ECA, 2014)
Was the investment well planned? -
Were the physical outputs achieved?
Were the investments needed?
Are all outputs being used?
Were expected quantitative results achieved?
Were qualitative benefits achieved?
Was any impact on regional economy evidenced?
Is the cost per additional passenger reasonable?
Is this a sustainable airport?
Table 7: New assessment of Thessaloniki Airport next to the general assessment made by the ECA in 2014. In Appendix 6 you
can find criteria for the colour rating for all the assessment points.
23TARTU AIRPORT
Tartu Airport is the second largest airport of Estonia. The airport of Talinn is the biggest
in the country and was the only airport of Estonia receiving large passenger planes, till Tartu’s
expansion and renovation from 2008 to 2012. EU funds for the airport totalled to €11.805.499,-
and were primarily used for a new larger runway and a new terminal.
Data from the report shows a more than 1000% increase from 2007 to 2013, the largest
change in the research by the ECA. However, the same figures also show a decline from 2010 to
2013. This was due to several regional airlines breaking ties with the airport, which was never
mentioned in the report. After 2013 Tartu Airport was absorbed by Talinn Airport and is now
managed and maintained by them. The data from the ECA and the new data gathered by this
research are presented in Table 8 and Figure 6.
After the takeover by Tallinn, Tartu has again expanded its passenger range resulting in a
2000% increase in passengers in the period 2007-2019. The passenger trends for the whole
research period are presented in the graph in Figure 5. Because of the increase in passengers, the
amount of passengers per m2 per year went up too and reached 46 in 2019, still a bit short from
the margin of 50 passengers per m2 proposed by the ECA. Concluding this, the passenger forecast
made for Tartu Airport has been reached and passed in the previous years.
Data comparison
Data point 2007 2010 2013 2016 2019
Passenger trends 1.182 23.504 13.790 29.594 28.322
passenger / m2 per year 2 39 22 - 46
Forecast Accuracy (based -71% +59%
on forecast in 2013)
Table 8: Table of several data points for Tartu Airport from the ECA Report and supplemented by new statistics. (ECA, 2014;
ECAA, 2021)
Figure 6: Passenger trends for Tartu Airport 2007-2019 (ECAA, 2021)
24Assessment
ECA - 2007-2013
Considering the small size of Tartu the airport was assessed fairly positive (Table 9). Similarly
sized airports in other countries performed worse. Nonetheless the ECA was not sure about Tartu
and deemed the airport not sustainable, with any estimation of 7 years for return of investments.
However Tartu’s geographical position seemed optimal.
New assessment - 2013-2019
Tartu did not seem a failure to the ECA, but after the opening of the airports new terminal and
expanded runway it saw a decline of passengers till 2013. The airport saw the largest increase of
passengers of all airports. However, to call this a success is not fair. The airport only received
commercial flights for the first time in 2010 and numbers before that moment should therefore
not be used for comparing statistics with other airports. Still the takeover by Tallinn airport was
a great success for the airport, according to an annual report by Tallinn Airport (2018).Tallinn
was also include in the report and was the best scoring airport by the ECA and has since seen an
almost 67% increase in travellers with almost 3,3 million passengers in 2019 (ECA, 2014 & TAT,
2020). In 2019 most flights in and out of Tartu are Regional (to Riga and Helsinki). If not for Covid
and the Baltic states seeing a rise in tourism (Jacobsen, 2018), Tallinn would have had to expand
or redirect flights to Tartu.
Thus my conclusion for Tartu is that it is doing fine under the wing of Tallinn Airport. But
if it will expand or receive more flights is now in Tallinn’s hands to. It is possible that the airport
will remain a regional airport and will stagnate on the 40.000 passengers per year. But it’s fair to
say the opportunity is there and therefore Tartu is deemed a sustainable airport.
25Assessment Table
Already by 2013 physical outputs were achieved and by 2019 all outputs are in use. Qualitative
benefits have improved under Tallinn Airport, regular flights and public transport connections
are now in place. Although the rise in passenger numbers cannot be directly linked to be impactful
on the regional economy, it did coincide with a rise n tourism in the Baltics. Cost per additional
passenger is now reasonable under Tallinn’s wing. With the above assessment and beneficial
conditions and circumstances surrounding Tartu, the airport is considered sustainable.
Assessment 2013 2019
(ECA, 2014)
Was the investment well planned? -
Were the physical outputs achieved?
Were the investments needed?
Are all outputs being used?
Were expected quantitative results achieved?
Were qualitative benefits achieved?
Was any impact on regional economy evidenced?
Is the cost per additional passenger reasonable?
Is this a sustainable airport?
Table 9: New assessment of Tartu Airport next to the general assessment made by the ECA in 2014. In Appendix 6 you can
find criteria for the colour rating for all the assessment points.
26Conclusion of the results
Concluding the results of the data research and the assessment, the sub questions 3, 4
and 5 can be answered as follows.
Is there a positive or negative long term trend when comparing statistics from 2007-2013 to
those of 2013-2019?
As can be seen in figure 2 through 5, Cordoba, Thessaloniki and Tartu saw positive trends
in the past several years. Crotone too saw a rise in passengers from 2013 to 2019, but that number
was lower than the initial number of passengers in 2007. Nonetheless, this shows us that, as was
enticipated in the introduction, tourism rise and increase in passengers in the air travel sector
(Law, 2018) is visible in graphs for all of the assessed airports and compard to the final numbers
in 2013 all airports have seen an increase in passengers.
What conditions contributed in the eventual situation of the airports in 2019?
Management seems to play a great role in airport success in the long term (Beak, 2019;
De Wit, 1988). Córdoba was and is part of the AENA, which controls most airports in Spain.
Crotone and Tartu were privately owned and saw a takeover by a larger airport group. Where
government owned Thessaloniki saw a takeover by a greater private cooperation. Larger
cooperation’s seem to bring new opportunity for international flights, which is an accessory of
their size and reach. Besides that they bring security of existence, as Córdoba and Crotone would
not have survived if not for their larger airport groups.
Passenger trends may not seem like a condition and more like a product of several
conditions and circumstances. Although it indeed is, higher passenger numbers often results in a
more stable source for revenue, which is vital to keep an airport operating (Losada et al., 2012).
Airport facility expansion/renovation, although in many cases seemed unnecessary
according to the ECA, proved to be beneficial for eventual growth. The expansion of the runway
in Crotone did not save it from bankruptcy, but made the airport more interesting to bigger
corporations and eventually was taken over by SACAL. Thessaloniki’s freight expansion stood
empty for many years, but Fraport saw opportunity in the air freight infrastructure and has since
their take over of the airport been in full use. We can however not assume that every
‘unnecessary’ expansion will result in opportunity and eventually be used. In Córdoba’s case,
none of the expansions to the airport were used since it’s completion.
Which circumstances resulted in beneficial outcomes and which did not?
Various Crises have impacted the assessed airports. Financial crises impact the flow of
tourism, which all our airports depended on. The private smaller airport endure the most
severe problems from this (Losada et al., 2012).
Regional opportunity seems important too. too many competitors in the vicinity is not
beneficial for growth. With less competitors there is more room for expansion and a bigger
change of making deals with more airlines. Rising tourism numbers in the region around the
airports also expand on this potential, because a rise in tourism may coincide with a rise in air
travel.
27CONCLUSION
• Only one airport can be considered a failure by assessment criteria.
• 3 of the 4 airports examined have seen absorption or takeovers by larger entities after
2013 and have considerably benefited from this.
• 3 of the 4 airports have been able to revive themselves and 2 of them can be deemed
sustainable airports. Only Thessaloniki will be credited with being considered a success.
So to answer the question; ‘To what extent is project revival apparent while looking at the long
term change in the failed airport projects in respect to the short term?’ It is apparent in 3 of the 4
airports, which clearly show a better performance in 2019 than in 2013. Although revival of only
2 of 4 airports can be directly linked to the 2000-2013 EU-funds, it is apparent that airports are
very susceptible by many factors. In Cordoba and Crotone, failure could be directly linked to
crises, mismanagement or ownership by small private corporations. Through the absorption of
Crotone Airport by SACAL, the airport might still have a chance of success, which would seem
impossible if you don’t consider the long term data gathered in this research. Through the case of
Thessaloniki we can verify that project success is in part a concept of time, but is also dependent
on a dozen of other factors. Tartu’s case now seems very dependent on tourism increase in the
Baltic States.
During this research I also found that, the larger the airport, the larger the passenger
increase was in the last few years (2013-2019). Not only was this evidenced in the graphs of the
4 airports I researched, but the neighbouring and competitor airports, which were also examined,
all showed similar trends. This would suggest large airports are more susceptible to change and
can thus grow their numbers far more rapidly in the right circumstances, but will consequently
be hit harder in less fortunate times. Take overs by larger entities seem to have positive impacts
on most of the cases. However, in the case of Córdoba, which was already part of a larger
organisation, this did not benefit the airport. The significance of airport groups and larger
corporations on airport success can be a topic for future research.
Reflection
Considering the scale of this research, researching more of the 20 airports would have
given a far clearer answer to the research questions, but due time and word constraints that
simply was not possible. Also this research does not account for the Covid pandemic and only
some assumptions can be made about the trends and performance after tourism can slowly start
again. Furthermore stakeholder satisfaction and other qualitative aspects are not used, because
the ECA report did not have qualitative data, qualitative research could not have been reflected
back on data from 2013.
Further research
As the pandemic has shown, the aviation sector is very unpredictable. So knowing how
and why airports succeed or fail and how they revive themselves or decline over time, can help
in gaining more strategic knowledge of airports and the aviation sector as a whole. Further
research can build upon this statement. Applying the same research on more airports might give
a broader and better scope of what is needed for revival. It might be useful to look more into the
effect of catchment areas and management by larger corporations on airport performance, as
both subjects have not been fully explored in this thesis.
28REFERENCES
Scientific Papers
Andersen, E. S., Birchall, D., Arne Jessen, S. & Money, A. H. (2006). Exploring project success.
Baltic Journal of Management, 1(2), 127-147.
Beak, J., Lee, Y. & Lee, Y. (2019) The Impact on the Performance by Airport Policy and
Leadership. Journal of Advanced Navigation Technology 23(1), 20-35.
Choy, D. (1991). Tourism planning. Tourism Management, 12(4), 313-330.
De Wit, A. (1988). Measurement of project success. International Journal of Project Management,
6(3), 164-170.
Doraisamy, S. V. (2017). Abandoned project restoration model (APRM) for residential
construction projects. Philosophy Thesis. University of Tun Hussein Onn Malaysia.
Harvey, G. & Turnbull, P. (2009). The impact of the financial crisis on labour in the civil aviation
industry: final report, International Labour Organization.
Jiang, J. J., & Klien, G. et al. (2002). "Pre-project partnering impact on an information system
project, project team and project manager." European Journal of Information Systems. 11, 86-97.
Kwakkel, J., Walker, W. and Marchau, V. (2010) Adaptive Airport Strategic Planning. European
Journal of Transport and Infrastructure Research, 10(3).
Lei, Z., & O’Connell, J. F. (2011). The evolving landscape of Chinese aviation policies and impact
of a deregulating environment on Chinese carriers. Journal of Transport Geography, 19(4), 829-
839.
Losada, J., Eraso, J., & García, P. (2012). AIRPORT MANAGEMENT: THE SURVIVAL OF SMALL
AIRPORTS. International Journal of Transport Economics / Rivista Internazionale Di Economia Dei
Trasporti, 39(3), 349-367.
Prabhakar, G. P. (2008) What is Project Success: A Literature Review. International Journal of
business management, 3(9), 3-10.
Ringbeck, J. & Pietsch, T. (2009). Crisis Aftermath: Pathways to a More Resilient Travel &
Tourism Sector. World Economic Forum.
Smeral, E. (2009). The Impact of the Financial and Economic Crisis on European Tourism.
Journal of Travel Research, 48(1), 3-13.
Suau-Sanchez, P., Voltes-Dorta, A. & Cugueró-Escofet, N. (2020). An early assessment of the
impact of COVID-19 on air transport: Just another crisis or the end of aviation as we know it?
Journal of Transport Geography, 102749.
29Books
Graham, A., Papatheodorou, A. & Forsyth, P. (2008). Aviation and Tourism: Implications for
Leisure Travel. Hampshire: Ashgate Publishing Limited, pp.1-4.
Healy, A. (2018). Comparative Research Using Secondary Data Analysis: Exploring Europe’s
Changing Food Consumption Practices. London: SAGE Publications, Ltd.
Prasser, S. (2007). ‘Overcoming the ‘White Elephant’ Syndrome in Big and Iconic Projects in the
Public and Private Sectors’, in Wanna, J. Improving Implementation: Organisational Change and
Project Management ( pp. 47-67). Canberra: ANU Press.
Online articles
Collins, N. (2010). White Elephants and Wasted Millions: A Warning To the World Cup Hopefuls.
Bleacher Report. Available at: https://bleacherreport.com/articles/515728-white-elephants-
and-wasted-millions-a-warning-to-the-world-cup-hopefuls (Accessed 22 February 2021).
Crisp, J. (2014). EU millions wasted on white elephant airports, say auditors. www.euractiv.com.
Available at: https://www.euractiv.com/section/regional-policy/news/eu-millions-wasted-on-
white-elephant-airports-say-auditors/ (Accessed 11 June 2021).
Dw.com. (2014). Italy's sovereign debt explodes as economy shrinks in 2013. DW. Available at:
https://www.dw.com/en/italys-sovereign-debt-explodes-as-economy-shrinks-in-2013/a-
17469523 (Accessed 14 May 2021).
Harter, P. (2012). The white elephants that dragged Spain into the red. BBC News. Available at:
https://www.bbc.com/news/magazine-18855961 (Accessed 11 June 2021).
Hutchinson, J. (2015). Engineers declare roof on Berlin's €5.4BN airport 'too heavy'. Mail Online.
Available at: https://www.dailymail.co.uk/travel/travel_news/article-3244454/And-thought-
Germans-efficient-problems-Berlin-s-5-4BILLION-white-elephant-airport-engineers-declare-
new-roof-heavy.html (Accessed 22 February 2021).
Jacobsen, B. P. (2018) State of the Tourism Industry in the Baltic Sea Region, 2018 Edition. BSTC.
Available at:
https://bstc.eu/fileadmin/bstc.eu/Downloads/Final_Report_Tourism_Industry_in_BSR_2018.pd
f
Lacalle, D. (2019). The New Green Deal Is Just Old White Elephants. Dlacalle.com. Available at:
https://www.dlacalle.com/en/the-new-green-deal-is-just-old-white-elephants/ (Accessed 22
February 2021).
Law, W. (2018). Tourism in Europe Is Steadily Growing. Tourism-review.com. Available at:
https://www.tourism-review.com/tourism-in-europe-expects-a-record-year-news10438
(Accessed 11 June 2021).
Van Leijen, M. (2020). Chinese invest in other Greek port, this time Thessaloniki. RailFreight.com.
Available at: https://www.railfreight.com/intermodal/2020/07/14/chinese-invest-in-other-
greek-port-this-time-thessaloniki/ (Accessed 14 May 2021).
30Data sources
Assaeroporti, (2021). Air traffic Statistics. Available at: https://assaeroporti.com/statistiche/
Accessed 14 May 2021
AENA, (2021). Air traffic Statistics. Available at:
http://www.aena.es/csee/Satellite?Language=ES_ES&c=Page&cid=1113582476721&pagenam
e=Estadisticas%2FEstadisticas&periodoInforme=Anual (Accessed 14 May 2021)
ECAA, 2021. Statistics. Republic of Estonia Transport Administration.
https://www.ecaa.ee/en/practical-information-licenses/statistics (Accessed 14 May 2021)
ELSTAT, 2018. Greece In Figures. Hellenic Statistical Authority.
https://www.statistics.gr/documents/20181/1515741/GreeceInFigures_2018Q4_EN.pdf/e64e
b95a-766b-4540-847b-43dd555b5aa4 (Accessed 14 May 2021)
Fraport Greece, 2021. https://www.fraport-greece.com/eng/our-expertise-and-
services/aviation/traffic-figures (Accessed 14 May 2021)
Tallinn Airport, 2018. Annual Report. https://www.tallinn-airport.ee/wordpress/wp-
content/uploads/2019/06/Tallinna-Lennujaam-eng.pdf (Accessed 14 May 2021)
Wikipedia, 2020. Annual Statistics. https://en.wikipedia.org/wiki/Thessaloniki_Airport
Accessed (Accessed 14 May 2021)
31Appendices
Table of Contents
1 Córdoba Airport - Additional Data 31
Table with passenger data and source 31
Map of overlapping airports 32
2 Crotone Airport - Additional Data 33
Table with passenger data and source 33
Map of overlapping airports 34
3 Thessaloniki Airport - Additional Data 35
Table with passenger data and source 35
Map of overlapping airports 36
4 Tartu Airport - Additional Data 37
Table with passenger data and source 37
Map of overlapping airports 38
5 ECA Report – General Assessment Table 39
6 ECA Report – Grading Criteria for General Assessment Table 40
321 - Córdoba Airport Additional Data
1a – Passenger Data with sources.
Year Passengers Source
2007 22.410 (AENA, 2021)
2008 22.230 (AENA, 2021)
2009 15.474 (AENA, 2021)
2010 7.852 (AENA, 2021)
2011 8.442 (AENA, 2021)
2012 9.844 (AENA, 2021)
2013 6.956 (AENA, 2021)
2014 6.598 (AENA, 2021)
2015 7.357 (AENA, 2021)
2016 7.636 (AENA, 2021)
2017 8.064 (AENA, 2021)
2018 8.254 (AENA, 2021)
2019 10.700 (AENA, 2021)
331b – Overlapping catchment area, map by the ECA (2014), with data from Eurostat.
34You can also read