EFFECTS OF THE COVID-19 PANDEMIC ON THE GAUTENG CITY-REGION
←
→
Page content transcription
If your browser does not render page correctly, please read the page content below
GCRO DATA BRIEF
                                                                                                # NO.11

       EFFECTS OF THE COVID-19 PANDEMIC ON THE
                          GAUTENG CITY-REGION
FINDINGS FROM THE GCRO’S QUALITY OF LIFE SURVEY 6 (2020/21)

                                                                                              SEPTEMBER 2021
                                                                                                       Authors:
                      Gillian Maree, Christina Culwick Fatti, Graeme Götz, Christian Hamann, and Alexandra Parker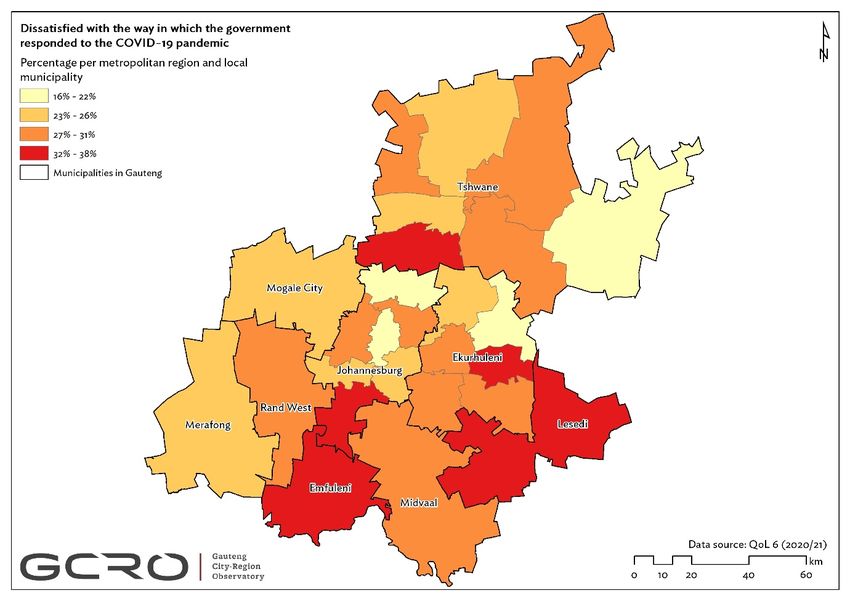
Effects of the COVID-19 pandemic
on the Gauteng City-Region:
Findings from the GCRO's Quality of
Life Survey 6 (2020/21)

Authors: Gillian Maree, Christina Culwick Fatti, Graeme Götz, Christian Hamann and
Alexandra Parker

Date: September 2021

Type of output: Data Brief #11

Research theme: Histories and futures

ISBN: xxx

DOI: 10.36634/2021.db.2

Design: xxx

Cover Image: James Oatway

© 2021 Gauteng City-Region Observatory

Published by the Gauteng City-Region Observatory (GCRO), a partnership of the University of
Johannesburg, the University of the Witwatersrand, Johannesburg, the Gauteng Provincial
Government and organised local government in Gauteng (SALGA).

Suggested citation: Maree, G., Culwick Fatti, C., Götz, G., Hamann, C., & Parker, A. (2021).
Effects of the COVID-19 pandemic on the Gauteng City-Region: Findings from the GCRO's Quality
of Life Survey 6 (2020/21). GCRO Data Brief No. 11. Johannesburg: Gauteng City-Region
Observatory.
Effects of the COVID-19 pandemic on the Gauteng City-Region

Table of contents
Table of contents                                                                        1
Headline findings                                                                        1
Introduction                                                                             3
COVID-19 in households                                                                   5
Household responses to COVID-19                                                         10
  Changes in household behaviour in response to COVID-19                                10
  Changes in mobility and travel patterns                                               12
Economic impacts of the pandemic on households                                          17
  Reduced salaries, job losses and business closures                                    17
  Recovery from job losses and business closures                                        20
  Impacts on time and ability to do work                                                21
  Wider socio-economic impacts                                                          23
Social impacts of the pandemic on households                                            28
  Health and well-being                                                                 28
  Increasing care of children and other family members                                  30
Social relief during the COVID-19 pandemic                                              33
Satisfaction with government responses to the COVID-19 pandemic                         35
Conclusions and implications                                                            38
References                                                                              40
Headline findings
● By the completion of the Quality of Life Survey 6 (2020/21) (QoL 2020/21) fieldwork in
May 2021, 2.7% of households reported COVID-19 infections within their households
and 2.2% of households reported not being able to access COVID-19 testing when they
needed it. Concerningly, in some municipalities of the province, the proportion of
respondents saying they were refused a COVID-19 test is higher than the proportion who
say that their household had COVID-19.
● The economic impact of the pandemic has been widespread and severe, with more than
half (55%) of all respondents being impacted directly. This has translated into not only
increased stress and pressure on households, but those directly impacted were also more
likely to have missed debt repayments, been unable to pay bills and to skip meals.
● COVID-19 has had deep socio-economic impacts, but these impacts vary by race, sex and
income group. Wealthier households were relatively more shielded from job losses. Black
Africans and the lowest income groups have been heavily impacted. Some social and
economic support has protected some of the most vulnerable.
● In response to the pandemic, most households did change behaviour, with 92% of
households reporting they avoided public spaces and gatherings and 89% of households
reporting they bought alcohol-based sanitiser. A smaller but not insignificant number of
households were likely to change their mode of transport (25%) or how they buy groceries
(35%).
● Education was impacted even after restrictions were lifted: 39% of households with
children kept children away from school when they were allowed to return, and of those
households, 63% did not have access to a working computer and 80% did not have
internet access, constraining the potential for learning at home. Households keeping
children away from school were more likely to be poor. As a result, the impact on
children’s education may be greater for households already at a disadvantage and extends
beyond school closures.
● As many as one in four respondents changed their main mode of transport. Respondents
in households with a working car were less likely to change their transport mode (22%) as
were respondents in higher income groups and White respondents. There is also a
difference between the sexes: female respondents were more likely to change their
transport mode than male respondents.
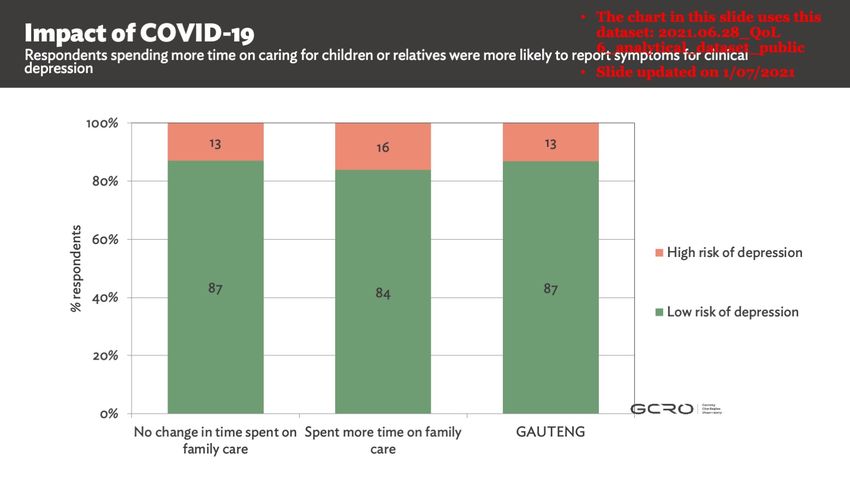
● More than a quarter of respondents (28%) reported that they had spent more time than
usual looking after children or other family members since March 2020. The additional
caring of relatives has fallen disproportionately to women, with 50% of female
respondents with family commitments spending more time on caring for relatives than
male respondents (28%).
● One in ten respondents who owned a business had to close it permanently in the
pandemic. Only 5% of applicable White respondents say they permanently closed a
business, compared to 10% of Black Africans and 16% of Indians/Asians.
● A third of all households applied for the COVID-19 Social Relief of Distress (SRD) grant
of R350 and two thirds of those who applied received the grant. Almost a quarter (23%) of
the entire sample said that someone in their household was receiving the SRD grant.
1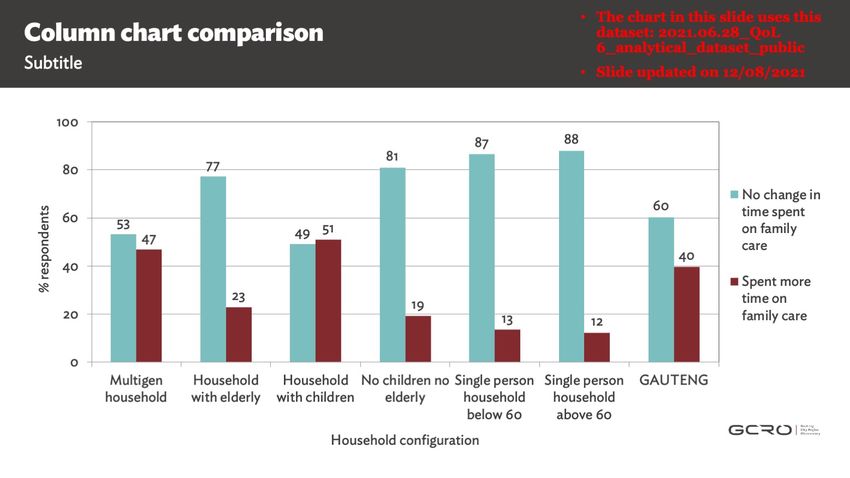
Effects of the COVID-19 pandemic on the Gauteng City-Region

    Thirteen percent of respondents reported receiving food support from government or
    NGOs since March 2020.
●   Two thirds of respondents (62%) are satisfied with the way in which the government
    responded to the COVID-19 pandemic. This is substantially higher than satisfaction with
    national government in general. Satisfaction with the government’s pandemic response
    changed during data collection and was at its lowest during the height of the second wave.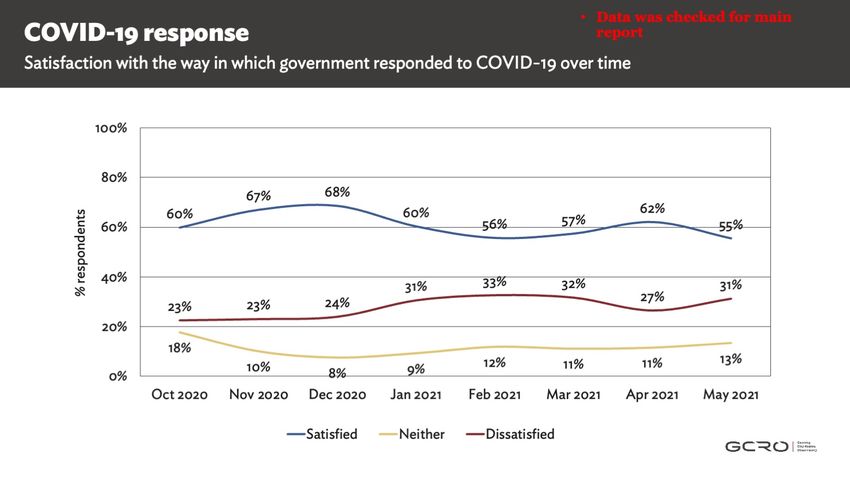
Effects of the COVID-19 pandemic on the Gauteng City-Region

Introduction
The Quality of Life Survey (QoL) is a flagship project of the Gauteng City-Region Observatory
(GCRO) and has been run every two years since 2009. QoL provides an understanding of the
quality of life, socio-economic conditions, satisfaction with services and government, psycho-
social attitudes and experiences of residents in the Gauteng City-Region (GCR). The longitudinal
nature of the survey means that these conditions and experiences can be reported on over time.

The sixth iteration of QoL was run between October 2020 and May 2021 in the midst of the
COVID-19 pandemic. Lockdowns in South Africa meant that data collection for QoL 2020/21
could not begin as originally intended in April 2020. The resulting delay of six months allowed for
a set of questions to be included in the survey that asked how COVID-19 may have impacted
households or shifted perceptions. A report released at the launch of QoL 2020/21 contains a
summary of the key findings from the COVID-19 questions that were asked (de Kadt et al., 2021).
This GCRO Data Brief examines the responses to COVID-19-specific questions in more detail
and looks at some of the broader impacts on households, society, the economy and governance.

The GCRO has worked with the Gauteng Provincial Government and key role-players during the
pandemic to provide research, data and insights to help inform response planning to COVID-19.
QoL data has been key to these outputs. The March 2020 Map of the Month looked to understand
the localised risk factors that might contribute to the spread of COVID-19, and might amplify its
health and socio-economic impact, in Gauteng communities. Specifically, the maps explored two
key themes: (1) the multiple risk factors to maintaining basic preventative hygiene and social
distancing; and (2) the multiple risk factors in the context of major shutdowns and potential
outbreaks (de Kadt et al., 2020). Further work explored areas such as households vulnerable to
income disruption, challenges to accessing food during lockdown, the impact on the elderly and
different household configurations, as well as gendered impacts. The GCRO has also had access
to geocoded COVID-19 case data via the Gauteng Department of Health Mpilo dataset and has
used this data to help understand spatial patterns of the virus, ward-level analysis of data trends
as well as age and gender trends in infections. Research outputs are available from a dedicated
GCRO webpage: https://www.gcro.ac.za/research/project/detail/responding-covid-19-
pandemic-gauteng/.

Results from QoL 2020/21 highlight the substantial and profound impact that COVID-19 has had
on overall quality of life, health and well-being of residents in the GCR (de Kadt et al., 2021). By
comparing the results of this most recent survey to previous iterations, the data allows us to
understand where recent shifts and changes may differ from trends that were occurring before
the pandemic. It is not always possible to show that the changes are as a result of the pandemic or
other stressors and events that happened, but it does allow a deeper understanding of how the
changes have happened and who has been impacted. This information is crucial to enable
evidence-led policy and to direct efforts to help with recovery.

There are limitations to the data analysis we are able to provide here. QoL 2020/21 fieldwork was
conducted between October 2020 and May 2021, covering only the first two waves of COVID-19
infections. The third wave of COVID-19 has been significantly higher, with more severe disease,
hospitalisations and deaths in Gauteng, so many respondents who were not affected in the first
two waves may have been so after fieldwork ended.
Effects of the COVID-19 pandemic on the Gauteng City-Region

The first section of this Data Brief details how respondents’ households were directly impacted
by the COVID-19 virus. This is followed by an exploration of how households responded to the
pandemic with a focus on household behaviour, transport and mobility changes. There are two
sections that examine the impacts of the pandemic: the first looks at the economic impacts and
the second explores the social impacts. This is followed by a section on social relief and
households that received food support. The Data Brief draws to a close with a section on
government’s response to the pandemic and the satisfaction therewith, before ending with some
conclusions and implications.
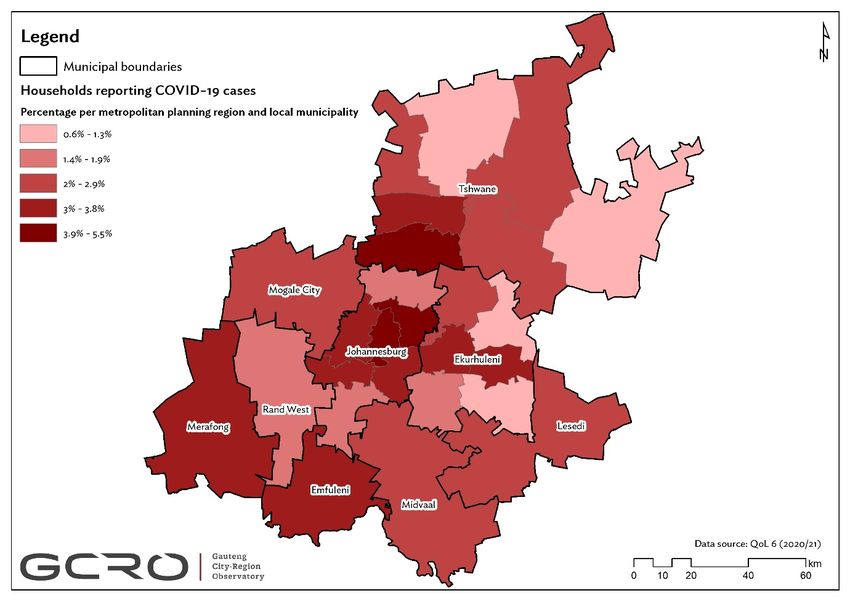
Effects of the COVID-19 pandemic on the Gauteng City-Region

COVID-19 in households
The Quality of Life 6 (2020/21) Survey (QoL 2020/21) was conducted between October 2020 and
May 2021, covering the second wave but excluding the third wave. Respondents to QoL 2020/21
were asked if COVID-19 had been diagnosed in their households and 2.7% reported having
COVID-19. The question in QoL 2020/21 provides an indication of COVID-19 infections in
households but did not ask for further details on who was diagnosed or how. It is possible that
different members of a household tested positive for COVID-19 at different times, and, as
discussed in more detail below, it is also possible that respondents who reported COVID-19 in the
household may also have reported being personally denied testing at a different time.

Using Statistics South Africa’s 2020 mid-year population and household size estimates, the QoL
2020/21 data can be extrapolated to approximately 424 702 infections (Statistics South Africa,
2020). Official statistics for COVID-19 cases on 27 May 2021 when fieldwork was completed
stood at 450 377, suggesting that the QoL 2020/21 figures do reflect official positive test numbers
(IBM Research, 2021).

There is spatial variation where households reported COVID-19, with higher than average
proportions in Emfuleni (4%), Merafong (3%) and Johannesburg (3%) (Figure 1).

Figure 1: Map of Gauteng showing respondents reporting COVID-19 in their households, by metropolitan
planning region and local municipality. Data source: GCRO QoL 6 (2020/21).

There is evidence in QoL 2020/21 that those who reported having COVID-19 in their household
do not represent the full extent of how the pandemic has spread in Gauteng. Respondents were
Effects of the COVID-19 pandemic on the Gauteng City-Region

asked whether they had tried to test for COVID-19 since March 2020 but had been refused. An
average of 2.2% of respondents sought testing but were refused.

Comparing the percentages of those who said they had had COVID-19 in their household and
those who tried to test but were denied, by race and income indicators, raises serious concerns.
Figure 2 shows that Indian/Asian and White households were disproportionately more likely to
have reported having COVID-19 in their households and the least likely to have been refused a
test. By contrast, Black African respondents were the least likely to say that they or a member of
their household had COVID-19. At 2.2%, they were more likely to say that they had been refused a
COVID-19 test than White respondents at 1.6%.

Figure 2: Percentage of respondents reporting COVID-19 in their household and respondents who tried to test for
COVID-19 and were refused, by race. Data source: GCRO QoL 6 (2020/21).

The picture is even starker when the two indicators are compared by income group, as shown in

Figure 3. A striking 11% of respondents in the highest income group earning more than R51 201
per household per month saw COVID-19 in their households. This is compared to some 1% in the
lowest income categories. A mere 0.8% of those in the highest income bracket tried to test for
COVID-19 since March 2020 but were refused, compared to 2.4% for those with monthly
household incomes of R1–R800.

It is possible that lower reported rates of COVID-19 in some households may reflect greater
concerns over being stigmatised for having COVID-19. The race and income differences of those
saying they tried to test for COVID-19 but were refused suggests that the more significant reason
was uneven access to quality healthcare, where many who could not afford private testing were
turned away from the sites available to them (Mkhize et al., 2021). It is also likely that higher
income households, who are more likely to have access to private vehicles and medical aid,
experienced fewer barriers to accessing healthcare. Shortages of diagnostic test materials in the
public sector are also likely to have influenced access to testing (Tomlinson, 2020).
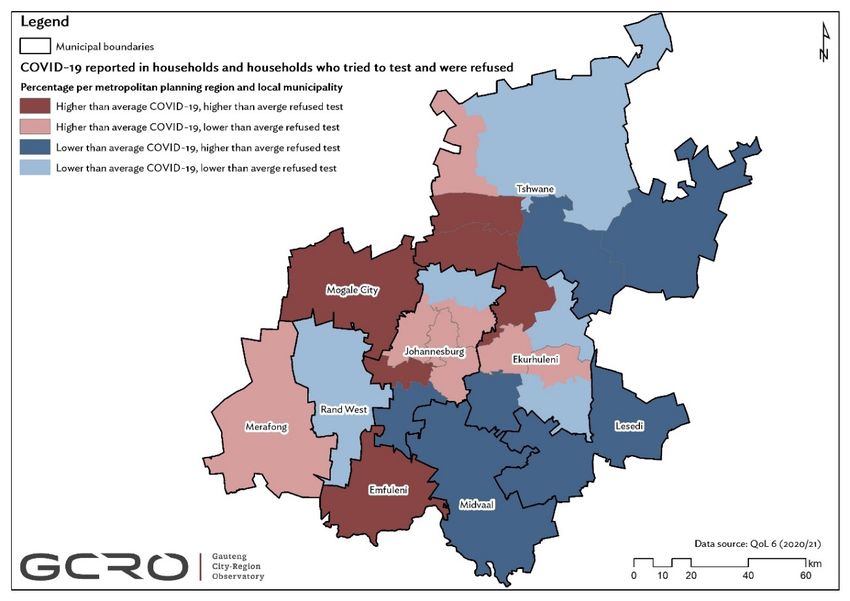
Effects of the COVID-19 pandemic on the Gauteng City-Region

Figure 3: Percentage of respondents reporting COVID-19 in their households and respondents who tried to test
for COVID-19 and were denied, by income group. Data source: GCRO QoL 6 (2020/21).

The percentages of those reporting COVID-19 in the household, and those saying they were
refused a test, varies spatially. Concerningly, in some municipalities of the province, the
proportion of respondents saying they were refused is higher than the proportion who say that
their household had COVID-19 (Figure 4). Respondents in Lesedi, Midvaal and Mogale City were
more likely to report having tried to test for COVID-19 and been refused (in Midvaal and Mogale
City at 4%) than they were to have reported COVID-19 in their households (all three
municipalities at roughly 3%).

Figure 4: Percentage of respondents reporting COVID-19 in their households and respondents who tried to test
for COVID-19 but were denied, by municipality. Data source: GCRO QoL 6 (2020/21).

There are notable spatial differences across Gauteng within the metro planning regions. Figure 5
plots COVID-19 in households against households that tried to test for COVID-19 and were
denied against the Gauteng average. The top right quadrant shows the metro planning regions
and municipalities that reported above average proportions of COVID-19 in households and
above average numbers being denied access to testing. Areas in the bottom left quadrant have
Effects of the COVID-19 pandemic on the Gauteng City-Region

reported below average proportions of COVID-19 in households and were less likely to have been
denied access to testing. Respondents in the City of Tshwane Region 7 (including
Bronkhorstspruit and Ekangala) were the most likely to struggle to access testing when they tried
to. Central portions of Johannesburg and Ekurhuleni, Soshanguve and Merafong have reported
above average presence of COVID-19 but are the least likely to struggle to access testing. Soweto,
central and western Tshwane, Tembisa, Ivory Park and Emfuleni are also more likely to have
COVID-19 cases, but worryingly reported higher levels of being refused access to testing. South-
east Gauteng and eastern parts of Tshwane had lower incidence of COVID-19 in households but
were also more likely to struggle to access testing. This data is then mapped in Figure 6.

Figure 5: Percentage of respondents reporting COVID-19 in their households and respondents who tried to test
for COVID-19 and were denied, plotted against the Gauteng mean. Data source: GCRO QoL 6 (2020/21).
Effects of the COVID-19 pandemic on the Gauteng City-Region

Figure 6: Map of Gauteng showing the percentage of respondents reporting COVID-19 in their households and
respondents who tried to test for COVID-19 and were denied, by metropolitan planning region and local
municipality. Data source: GCRO QoL 6 (2020/21).
Effects of the COVID-19 pandemic on the Gauteng City-Region

Household responses to COVID-19

Changes in household behaviour in response to COVID-19
Households responded to the COVID-19 pandemic in numerous ways and some responses were
more widespread than others (see Figure 7). Nine out of ten respondents avoided indoor public
spaces and public gatherings such as shops, malls or spaces of worship. Similarly, nine out of ten
respondents bought alcohol-based sanitisers. Two fifths of households with children kept their
children away from school when they were allowed to return, a third of households changed
where or how their household buys groceries and only one in four changed their main mode of
transport.

Figure 7: Percentage of respondent behaviour changes or household responses to the COVID-19 pandemic. Data
source: GCRO QoL 6 (2020/21).

Avoiding public spaces or gatherings may not be an easy choice for some, such as street traders or
others who make a living in a public space, but as this was mandatory during lockdown levels 5
and 4, the data shows that it was consistently adopted by different population or income groups
across the survey (92% across Gauteng). Only single-person households were slightly less likely
to avoid public spaces (90%), which is perhaps indicative of the challenges of living alone in
lockdown conditions.

Buying alcohol-based sanitiser was widely adopted (89%) but comes with some financial costs,
and so we see some differences across income groups. Figure 8 shows that lower income groups
were slightly less likely to buy alcohol-based sanitiser. Strong messaging about sanitiser during
the pandemic most likely contributed to the high proportion of respondents who bought sanitiser
despite the cost. Alcohol-based sanitiser would also be an important alternative to soap and
water in informal dwellings where access to water may be more limited.
Effects of the COVID-19 pandemic on the Gauteng City-Region

Figure 8: Percentage of respondents who bought alcohol-based sanitiser, by income. Data source: GCRO QoL 6
(2020/21).

Since the first school closure from 18 March 2020, South Africa’s lockdown regulations included
multiple school closures of different durations. In addition, once schools reopened, many schools
had to limit children’s attendance to every second day in order to comply with social distancing
regulations within classrooms (Mohohlwane et al., 2020). So while attendance rates returned to
pre-pandemic levels in November 2020, this was undermined by the fact that many learners
were only attending half the number of school days (Mohohlwane et al., 2020). In May 2021, 10%
of parents reported that at least one of their children had not returned to school in 2021 at all
(Shepherd et al., 2021). This has had a profound impact on children’s education and learning
during the pandemic with every day of non-attendance equating to as much as 1.5 days of
learning lost (Shepherd et al., 2021) and, between March 2020 to June 2021, the equivalent of
70% to a full year of lost learning (Shepherd et al., 2021).

This is further compounded by the fact that many parents remained concerned about the risk of
their children attending school – more than half of parents were very worried in February 2021,
and parents in low income households were more likely to be very worried (Shepherd et al.,
2021). Results from QoL 2020/21 show a notable 39% of households with children kept their
children away from school when they were allowed to return. This varied spatially and was as
high as 48% in Johannesburg and as low as 12% in Merafong. QoL 2020/21 data confirms
findings by Shephard et al (2021) that those from lower income groups were more likely to keep
children away from school once they were able to return (Figure 9). Of those households with
children who kept children home from school when they were allowed to return, 63% did not
have access to a working computer and 80% did not have internet access. This would have
severely constrained options for children’s learning at home, although it should be noted that
families and schools have adapted in different ways to learning and teaching in the pandemic.
The data suggests even deeper impacts on the opportunities for learning of children in poorer
households than just the impact of school closures.
Effects of the COVID-19 pandemic on the Gauteng City-Region

Figure 9: Percentage of respondents who kept children away from school once they were allowed to return, by
population group and income. Data source: GCRO QoL 6 (2020/21).

More than a third of respondents changed how or where they buy their groceries. There are a
number of possible reasons for why this was the case. Some respondents may have switched to
online shopping to reduce their risk of transmission in the shops while other respondents may
have switched to different stores – either smaller shops to avoid people, or different retailers to
save money. Our data does not provide any conclusive patterns to explain which respondents
were more likely to change their shopping behaviours or why they did so.

Changes in mobility and travel patterns
QoL 2020/21 data shows some significant changes to transport patterns as a result of the
COVID-19 pandemic. As many as one in four respondents changed their main mode of transport.
Having access to a car is a contributing factor to whether respondents changed their main mode
of transport. Respondents in households with a working car were less likely to change their
transport mode (22%) than respondents in households with no functioning car (28%). Relatedly,
respondents in higher income groups and White respondents were also less likely to change their
mode of transport (Figure 10). There is also a difference between the sexes: female respondents
were more likely to change their transport mode than male respondents and this is also likely
related to their lower levels of access to a working car.
Effects of the COVID-19 pandemic on the Gauteng City-Region

Figure 10: Percentage of respondents who changed their main mode of transport, by car ownership, sex and
income. Data source: GCRO QoL 6 (2020/21).

QoL 2020/21 shows a drop in the percentage of people travelling to work, to look for work and to
places of study as their most frequent trip, compared to previous surveys (Figure 11). There has
been a significant increase in the percentage of respondents citing shopping as the most frequent
trip purpose, from 29% (2017/18) to 44% (2020/21).

These changes reflect the relative proportions of the purposes of trip-making. It is possible that
respondents travelled to shops just as frequently in the pre-pandemic surveys, but since travel to
work and to look for work has decreased over the last year, the percentage of those citing
shopping as the purpose of their most frequent trip has increased.

Figure 11: Percentage of respondents reporting the purpose of their most frequent trip, by survey iteration. Data
sources: GCRO QoL 6 (2020/21), GCRO QoL 5 (2017/18) and GCRO QoL 4 (2015/16).

There has been a major shift in mobility patterns with respect to how long respondents are taking
to get to their destinations. Respondent’s most frequent trips are now more likely to be short
trips of 15 minutes or less, and less likely to be longer than 30 minutes, compared to previous
Effects of the COVID-19 pandemic on the Gauteng City-Region

surveys. The reason for this may not be that people are making more short trips than they were
before, but rather that their most frequent trip is less likely to be long.

This trend is most evident in trips to the shops. Shopping trips appear to have become more local,
with nearly half (48%) of respondents taking 15 minutes or less to reach the shops (Figure 12).
There has been a corresponding drop in trips to the shops taking longer than 15 minutes. On
average, respondents seem to also be making shorter trips to work than in previous surveys, with
58% reaching work in less than 30 minutes (Figure 13).

Figure 12: Percentage of respondents whose most frequent trip is for shopping, reported travel time, by survey
iteration. Data sources: GCRO QoL 6 (2020/21), GCRO QoL 5 (2017/18) and GCRO QoL 4 (2015/16).

Figure 13: Percentage of respondents whose most frequent trip is to work, reported travel time, by survey
iteration. Data sources: GCRO QoL 6 (2020/21), GCRO QoL 5 (2017/18) and GCRO QoL 4 (2015/16).

Private vehicles and minibus taxis remain the primary modes of transport for most frequent trips
in Gauteng (33% and 43% respectively), followed by walking (19%).
Effects of the COVID-19 pandemic on the Gauteng City-Region

Figure 14 shows that there has been a notable decrease in the percentage of people using trains as
their main mode, dropping from 4% in 2015/16 to less than 1% in 2020/21. This could be
attributed to a modal shift resulting from train closures during lockdown level 5, together with
extensive train infrastructure vandalism in 2020 and 2021.

Figure 14: Main mode of transport used in the most frequent trip, by survey iteration. Data sources: GCRO QoL 6
(2020/21) and GCRO QoL 4 (2015/16).

One in four respondents noted that they had changed their main mode of travel to mitigate
COVID-19 risk. These transport mode changes do not seem to have significantly changed the
overall proportion of people using different transport modes since 2015/16 (Figure 14). This may
be due to changes being temporary rather than permanent, or even that changes were made but
not for people’s most frequent trip.

Although respondents did not provide detail as to which modes they changed from and to, or for
what duration of time, of those who reported changing mode to mitigate COVID-19 risk the
majority say that the mode of their most frequent trip is minibus taxi (52%), followed by private
vehicle (23%) and walking (19%). Figure 15 shows that compared to those who did not change
mode, those who did were more likely to use minibus taxis and less likely to use private vehicles.
These figures differ by sex, where male respondents who changed mode were more likely to walk
or use private vehicles compared to females, the majority of whom use minibus taxis as their
main mode (Figure 16).

In other parts of the world, the pandemic has spurred a growth in cycling. This trend has not been
evident in South Africa, likely because of the barriers to cycling as a mode of transport, including
long distances and unsafe conditions.
Effects of the COVID-19 pandemic on the Gauteng City-Region

Figure 15: Percentage of respondents who changed their main transport mode to mitigate COVID-19 risk, by
mode of transport. Data source: GCRO QoL 6 (2020/21).

Figure 16: Percentage of respondents who changed their main transport mode to mitigate COVID-19 risk, by sex
and mode of transport. Data source: GCRO QoL 6 (2020/21).
Effects of the COVID-19 pandemic on the Gauteng City-Region

Economic impacts of the pandemic on households

Reduced salaries, job losses and business closures
A number of questions were introduced into the Quality of Life 6 (2020/21) Survey questionnaire
to get some indication of the impact that COVID-19 and pandemic-related lockdowns may have
had on the economic circumstances of households. We asked whether the respondent had, since
March 2020, seen their salary and working hours reduced, lost a job, or permanently closed a
business.

One fifth (19%) of all respondents say their salary and working hours have been reduced since
March 2020. If we discount those who responded that the question was not applicable to them,
an extraordinary one third (30%) of applicable respondents saw salary and working hours
reduced under the pandemic.

Figure 17 looks in more detail at who says their salary and working hours were reduced, broken
down by race, sex, highest level of education completed, and monthly income of the household to
which the respondent belongs.

Figure 17: Percentage of applicable respondents who had their salaries and working hours reduced since March
2020, by race, sex, education and income group. Data source: GCRO QoL 6 (2020/21).

Interestingly, the proportion of respondents put on short time and reduced salary does not vary
considerably by race, although it is higher at 34% for employed White respondents than for Black
African respondents at 29%. It is also intriguing that the proportion affected is larger in the
higher income brackets than it is for the two lowest income brackets of R1–R800 and R801–
R3 200. The largest proportion of respondents impacted falls in the lower-middle class with a
monthly household income of R3 201 to R12 800. A broadly similar pattern can be seen with
levels of education, which are known from previous QoL surveys to correlate strongly with
Effects of the COVID-19 pandemic on the Gauteng City-Region

position on the socio-economic ladder.1 Of applicable respondents with matric qualification or
higher, 32% have seen their salaries and working hours reduced since March 2020. By contrast,
23% of working respondents with no education have seen pay and hours reduced. Thirty-two
percent of employed men saw reduced hours and pay, compared with 28% for women.

While this may seem to present a picture of wealthier respondents being more affected than
those from poorer circumstances, this data needs to be considered together with the results from
two other indicators, on job losses and business closures.

Roughly one in ten (11%) of all respondents said they had lost a job since March 2020.
Discounting those who did not previously have a job, almost one fifth (18%) of applicable
respondents lost a job at some point during the pandemic.

As shown in Figure 18, all races were impacted by job losses, but White respondents less so than
the other population groups. Some 12% of applicable White respondents lost a job, compared to
19% for Black African, 20% for Coloured and 20% for Indian/Asian respondents. There were no
marked differences between male and female respondents saying that they had lost a job. Those
with a tertiary education seem to have been less affected than those with no or incomplete
schooling: 13% of those with higher degrees lost a job since March 2020 compared to a quarter of
those with no education.

There is a strong association between job loss and levels of monthly household income, but of
course the line of causation is not easy to determine. Thirty percent of those in the lowest income
bracket lost a job, compared to 6% in the highest bracket. However, it is not clear whether this
means that the poorest households disproportionately suffered from COVID-related job losses,
or that job losses drove many who were previously in higher income brackets into poverty. While
the latter may seem to be a more logical conclusion, the larger impact on Black African, Coloured
and Indian/Asian respondents compared with White respondents, as well as the larger impact on
those with lower levels of education relative to those with higher degrees, may indicate that
wealthier households were relatively more shielded from job losses.

1
 Using QoL V (2017/18) data in evidence, the mean monthly household income of a respondent with no education or
only primary schooling is approximately R3 000 per month. A respondent with matric typically has a monthly
household income three times that at around R10 000, and someone with a higher education qualification (‘more’) has
three times that again with a mean monthly household income of some R30 000.
Effects of the COVID-19 pandemic on the Gauteng City-Region

Figure 18: Percentage of applicable respondents who lost a job since March 2020, by race, sex, education and
income group. Data source: GCRO QoL 6 (2020/21).

Overall, 4% of respondents say they had to permanently close a business since March 2020.
Discounting those who responded that the question was not applicable to them, one in ten
respondents closed a business in the pandemic. Again the figures differ markedly by race. Only
5% of applicable White respondents say they permanently closed a business, compared to 10% of
Black Africans and 16% of Indians/Asians. The impact of business closures seems to be lower
among applicable respondents with no education than among those with more schooling, but the
proportion of those with higher education indicating business closures was lower than those
with just some schooling or matric.

Eleven percent of respondents in the lowest household monthly income category (R1–R800) shut
businesses, compared to just 4% in the highest income category. However, again it cannot be said
definitively whether this correlation is because less well-established businesses at the lower end
of the economic spectrum – providing more meagre revenues to their owners – suffered a
disproportionate impact, or because business closures forced more households previously at
higher levels of the economic spectrum into poverty.

Figure 19: Percentage of respondents who had to close a business permanently since March 2020, by race, sex,
education and income group. Data source: GCRO QoL 6 (2020/21).
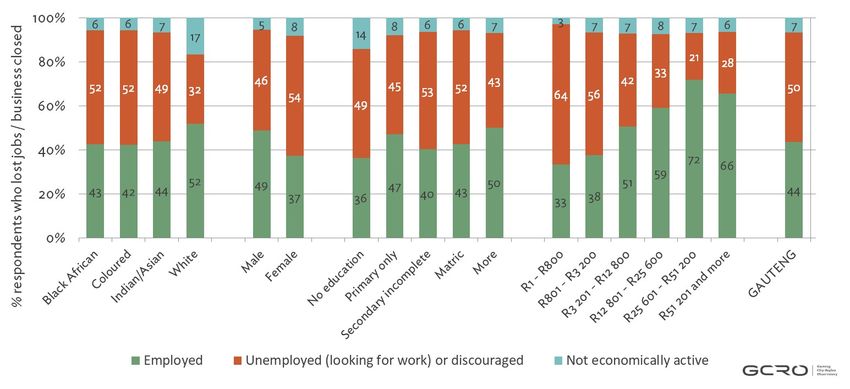
Effects of the COVID-19 pandemic on the Gauteng City-Region

While the evidence is mixed, the data does suggest the following conclusions. First, White
respondents and those from wealthier households have seen the greater impact of reduced
working hours and salaries (Figure 19). But this is a lesser pain than job losses and business
closures, where Black Africans and those on lower rungs of the socio-economic ladder seem to
have suffered far more of an impact. Second, while White respondents and those from wealthier
households seem to have been relatively more protected from business closures and, especially,
employment losses, it cannot be said definitively that the already poor have been
disproportionately impacted relative to those in the lower-middle and middle classes. Looking
past the ambiguous correlation between loss of livelihood and current income brackets, the fact
that those with some education and matric have also been heavily impacted by job losses and
business closures may indicate that many households previously in the middle of the economic
spectrum have been very vulnerable to shocks.

Recovery from job losses and business closures
To examine more closely the issue of who has been more vulnerable, or resilient, in the face of the
COVID-19 crisis, we considered the current employment status of those who say they lost
livelihoods since March 2020. Not all respondents who say they lost a job or permanently closed
a business stayed without work. Taking those who lost a job or closed a business as a subsample
(n=1 993), 44% indicate that they are now currently working, or have been appointed to a new job
and are waiting to start. Fifty percent say they are unemployed and looking for work or have given
up looking for work (discouraged work seekers). The remainder, 7%, indicate that they are no
longer in the labour market, with the most significant category here being respondents now
retired or on pension.

When the current employment status of those who lost a job or closed a business is broken down
by race, sex, education and income group (Figure 20), a differential ability of respondents to
bounce back from the economic shocks of the COVID-19 period is revealed.

Figure 20 shows that not only did White respondents see lower proportions of job losses and
business closures than other population groups, but they were also able to recover more easily. Of
White respondents who lost a job or closed a business since March 2020, 52% are currently
working, and 32% are unemployed and looking for work or have given up looking for work. By
contrast, amongst the same subsample of Black African respondents, 43% are employed and 52%
are unemployed. Intriguingly, when compared to other population groups, a relatively large
proportion of White respondents who lost a job or closed a business are no longer in the labour
market. The largest share of this not economically active category is now on pension.

The proportion of those who lost jobs or closed a business, but are now working, follows a
predictable pattern when broken down by income group. Higher monthly household incomes
correlate with larger proportions employed and lower unemployment. But again it cannot be said
from this analysis whether higher incomes follow a greater ability to find new employment, or
whether historically wealthier households have been more resilient. However, cutting the data by
education levels – once again, historically a marker of position on the economic spectrum –
shows a mixed picture. Indeed, new employment amongst those with tertiary education, at 50%,
is significantly higher than among those with no education at 36%. But the employment status of
Effects of the COVID-19 pandemic on the Gauteng City-Region

those who have lost jobs or businesses with only some primary education is better than those
with incomplete secondary schooling or matric.

One clear conclusion that can be drawn from this data is that men have been able to bounce back
from last year’s economic shocks more easily than women. The analysis above showed very little
difference between men and women in terms of salary and working hours reduced, jobs lost and
businesses closed – if anything, men seemed to be slightly more impacted. But relative
vulnerability looks quite different when the current economic status of men and women who
have lost livelihoods is compared. Forty-nine percent of men who lost jobs or closed businesses
are now working, compared to just 37% of women; and 46% of these men are now unemployed
and looking for work, or have given up looking for work, compared to 54% of women. This finding
confirms data from the NIDS-CRAM survey which indicates that men have largely recovered
their pre-pandemic employment levels while women have not been able to (Casale and Shepherd,
2021).

Figure 20: Current employment status of percentage of respondents who lost a job or had to close a business
permanently since March 2020, by race, sex, education and income group. Data source: GCRO QoL 6 (2020/21).

Impacts on time and ability to do work
QoL 2020/21 indicates that the COVID-19 period has had other more subtle economic impacts,
notably on the time and ability of respondents to do work, and in turn to earn a living. Here the
data also shows significant and concerning gender disparities.

We asked respondents whether they had spent more time than usual looking after children or
family members since March 2020, and then looked at the responses for those who were
economically active – either employed, or unemployed and looking for work. Of all respondents
in the labour market, 30% say they spent more time than usual looking after children and family
members since March 2020. Counting only those who said this was applicable to them, most
likely those with children, this rose to 41%. The proportion of those trying to work or to find work
burdened with additional child and family care was lower among White respondents, at 36%,
than for other population groups. The proportion was lower for those with more education. The
Effects of the COVID-19 pandemic on the Gauteng City-Region

percentage spending more time than usual looking after dependents did not vary much by income
group but, interestingly, the highest income group of R51 201 and above saw a higher proportion
than most other categories, at 44%. This is most likely because this category can traditionally
afford childcare, which was not available for a number of months under level 5 lockdown.

There is a very large difference between economically active men and women in terms of
additional time spent looking after dependents (Figure 21). Some 52% of economically active
women were affected compared to just 29% of men, indicating that some of the burdens of
lockdown fell much more heavily on women. More detail on respondents caring for children and
family members is provided in the next section.

Figure 21: Percentage of applicable respondents in the labour market (either employed or unemployed and
looking for work) who had to spend more time than usual looking after children and family members since March
2020, by race, sex, education and income group. Data source: GCRO QoL 6 (2020/21).

Interestingly, similar gender disparities can be seen for those respondents who say that their
health sometimes or always affects their ability to do their daily work (Figure 22). Twenty-seven
percent of women report that their health impacts on daily work compared to just 19% of men.
Health impacts on work also appear to have fallen more heavily on those in lower income
brackets, with 22% of those in the R1–R800 income category, and 27% in the R801–R3 200
bracket, reporting that health sometimes or always affects their daily work. This compares to
14% in the highest bracket. There were wide disparities between respondents with different
levels of education. At over 40%, more than double those with no or little education say their
health affects daily work than those with tertiary qualifications at 16%. The most likely
explanation for this is that those with little or no education are likely to be older respondents.
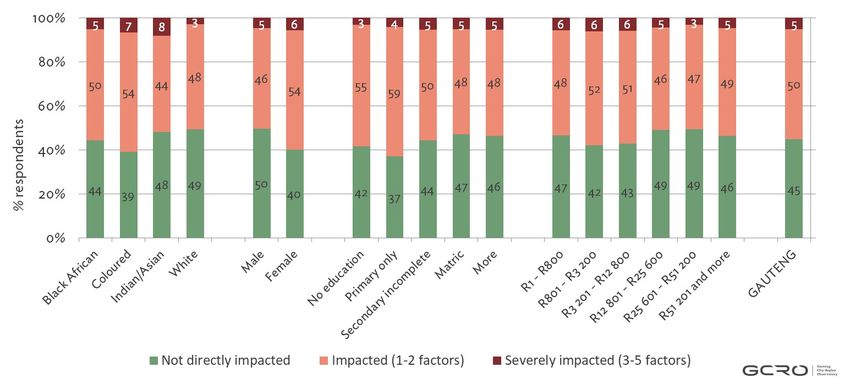
Effects of the COVID-19 pandemic on the Gauteng City-Region

Figure 22: Percentage of respondents reporting that health sometimes or always affects daily work, by race, sex,
education and income group. Data source: GCRO QoL 6 (2020/21).

Wider socio-economic impacts
To further explore which sections of society had been most affected, the five indicators discussed
above can be aggregated into a single basket able to reflect on the depth of ‘direct’ economic
impacts felt by different respondents. In turn, this basket of indicators can be used to discern the
extent to which those more deeply affected by the crisis have experienced more indirect socio-
economic challenges, relative to others not impacted, and also to previous QoL survey results.

Figure 23 lists the five indicators and the percentage of respondents impacted. Note that these
are not typical measures associated with households in poverty – such as living in informal
dwellings, a lack of key assets, or hunger – as we wanted to discern economic impacts across the
economic spectrum that were relevant to the last year of crisis wrought by a pandemic. Figure 23
also shows the percentage of respondents impacted by just one of the five factors and the
percentage who were burdened more heavily by multiple factors. Just under 45% were not
impacted by any of the five factors, which means that 55% were affected by at least one economic
impact indicator. Over a third (37%) were impacted by one, and a not insignificant 13% were
impacted by two. Approximately 5% were deeply affected by three or more of the five factors.

Figure 24 synthesises the analysis above into a single picture, contrasting the percentage of
respondents not impacted with those impacted by either one or two factors, and those more
deeply impacted by between three and five factors. It shows that on this basket of five direct
economic impact indicators, Black African and Coloured respondents have been more heavily
impacted than White or Indian/Asian respondents (although it does need to be noted that 8% of
Indians/Asians were more deeply affected by between three and five of the factors). Those with
higher levels of education were relatively more economically unscathed on any of the five
measures than those with no education or only primary schooling. And combining the measures
discussed above makes it clearer that women were more impacted than men – 50% of men did
not suffer any impact compared to 40% of women.
Effects of the COVID-19 pandemic on the Gauteng City-Region

Figure 23: Five indicators reflecting direct economic impacts on households, and percentage of respondents
impacted by one of more factors. Data source: GCRO QoL 6 (2020/21).

Figure 24: Impact of a basket of five direct economic impacts, by race, sex, education and income. Data source:
GCRO QoL 6 (2020/21).

This basket of economic impact indicators then provides a basis for analysing the extent to which
those who have been affected directly in some way are experiencing a wider set of secondary
socio-economic challenges, relative to those not impacted, and also in comparison to
respondents in QoL 2017/18. We looked at a range of financial and economic indicators across
the two survey years, and considered differential impacts by income groups, and by those
economically impacted or not. The results in Figure 25 (a to d) are indicative of some of the
sweeping impacts.

Figure 25(a) shows that in 2017/18, 47% of those who had debt reported that they had missed a
debt repayment in the last three months. This already high proportion climbed ten percentage
Effects of the COVID-19 pandemic on the Gauteng City-Region

points to 57% in 2020/21. The largest increases were in the lowest income groups. In 2017/18,
62% of those in the R1–R800 income bracket were struggling to repay debts. In 2020/21, this
grew 12 percentage points to 74%. A similar percentage point growth was seen in the lower-
middle income band of R3 201–R12 800, where respondents reporting missed repayments grew
from 46% to 58%. By contrast, the highest income bracket saw respondents struggling with debt
decrease from 22% to 17%.

When the picture of who is struggling with debt is further broken down by who has been
economically impacted or not, a more nuanced class picture emerges. Overall, it is clear that the
higher percentage of those struggling with debt is driven by the respondents who have been
economically impacted – 62% of these are struggling with debt compared to just 49% of those not
directly impacted. Figure 25a also shows that in the lowest income category those who have been
directly economically impacted over the last year are only slightly more likely to say they are
struggling with debt than those not impacted. Both groups are very high, at over 70%, but the
difference is relatively small compared to the splits seen in the lower-middle and middle income
categories. For those in the living wage monthly household income bracket of R3 201–R12 800
per month, there is no difference in the percentage struggling with debt in 2017/18 and those not
economically impacted in the last year – both are at 46%. However, the overall percentage of
those struggling with debt in 2020/21 is driven up significantly by those who have been impacted
economically, at 66%. Similarly, for those in the lower-middle class bracket of R3 201–R12 800,
47% of the economically affected are struggling with debt, compared to 31% of those who have
been economically shielded, a figure not much different from the 29% in 2017/18.

Figure 25 (b) shows how the percentage of respondents with unpaid municipal accounts
increased overall by three percentage points, but with larger increases in the lower and middle
income categories. In the highest income bracket, those with unpaid municipal accounts stayed
static at just 6%. However, again the figures differ markedly by whether respondents overall, and
in each bracket, have been affected by any of five economic impacts. Overall, the percentage
increase has been driven by the 24% of those who have been economically impacted saying they
have municipal arrears, compared to the 19% who have remained unscathed and the 18% in
2017/18. Once again, economic impacts relate to wider splits among those in the middle of the
economic spectrum. In the living wage bracket of R3 201–R12 800 per month, 24% of those who
have suffered economic impacts say they have unpaid municipal arrears, compared to 17% of
those shielded – the same proportion as in 2017/18.

In 2017/18, 66% of respondents were dissatisfied or very dissatisfied with the amount of money
available to them personally. In 2020/21, this has increased to 78% (Figure 25 (c)). Strikingly, the
largest percentage increase was in the middle income bands of R12 801–R25 600, where those
dissatisfied rose 22 percentage points from 46% to 68%, and the upper middle band of R25 60–
R51 200, where those dissatisfied with available money grew a massive 25 percentage points
from 34% to 59%. In these bands, those economically impacted and those not both drove the
percentage higher. Intriguingly, in the lowest income band of R1–R800, whether a respondent
was economically impacted or not made no difference to the level of dissatisfaction with the
amount of money available. Amongst both groups, 89% were dissatisfied.

There is an especially notable insight on one particular indicator of COVID-19 socio-economic
impacts by income group. One of the clearest measures of poverty is whether a household said
Effects of the COVID-19 pandemic on the Gauteng City-Region

that either adults or children in the households had missed a meal in the past year because there
was insufficient money to buy food. Historically, and again in QoL 2020/21, the lower income
brackets report the highest levels of skipping meals (Figure 25 (d)). Between 2017/18 and
2020/21, the percentage of respondents saying they or another adult in the household had missed
a meal increased only marginally from 25% to 26%. In the lowest income bracket of R1–R800, the
percentage fell from 46% to 43% and in the R801–R3 200 bracket, it dropped from 35% to 34%.
There were slightly larger increases in the middle income groups, such as a rise from 6% to 8% in
the R12 801–R25 600 bracket.

Here too the differences are much starker when the extent to which respondents have been
economically impacted is taken into account. Overall, the percentage of adult hunger grew from
25% to 26% because 29% of those who were economically impacted say they or another adult in
the household skipped a meal. Of those shielded from economic impacts, a significantly smaller
21% saw adult hunger in their household.

The decrease in adult hunger in the lowest income category is attributable to the 38% of those in
this group who suffered no additional economic hardship over the last year saying that adults had
skipped a meal. But 47% of those who had been economically impacted in this income band
report adult hunger, above the 46% overall for 2017/18. A similar situation can be seen in the next
lowest income band. The overall decrease in hunger in these low income bands may possibly be
explained by the positive impact of the COVID-19 Social Relief of Distress grant and food support
provided by governments or NGOs to the most vulnerable (see Social Relief during the COVID-19
pandemic section in this Data Brief). But the higher proportion among those who have suffered
direct economic impacts over the last year also suggests that this support may not always have
reached those who most need it.
Effects of the COVID-19 pandemic on the Gauteng City-Region

Figure 25 (a to d): Indicators of wider socio-economic impacts, by income group, 2017/18 and 2020/21, and by directly economically impacted or not. Data sources: GCRO QoL 6
(2020/21) and GCRO QoL V (2017/18).2

          (a) Of those who had debt, missed a debt repayment in last 3 months                                         (b) Household has unpaid municipal accounts

        (c) Respondents dissatisfied with the money available to them personally                          (d) Adult skipped a meal in the last year because not enough money

2
 Note that percentages for the totals in each figure are based on those respondents who shared their monthly household incomes in a voluntary auto-complete section of the survey. Totals
would be slightly different if based on ALL survey respondents.
Effects of the COVID-19 pandemic on the Gauteng City-Region
Social impacts of the pandemic on households
Health and well-being
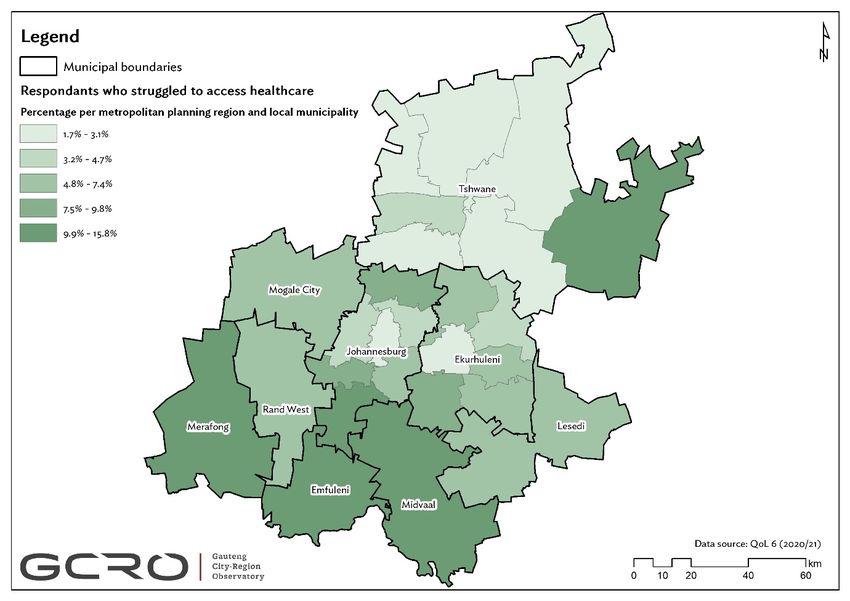
Since March 2020, 7% of respondents have struggled to access healthcare. This varies spatially,
where in some planning regions and local municipalities more than 13% of respondents have
struggled to access healthcare (Figure 26). Households in the south of Gauteng, Merafong and the far
east of Tshwane are the most likely to have struggled to access healthcare. Households centrally
located in the metros are the least likely to have struggled to access healthcare.
Figure 26: Map of Gauteng showing percentage of respondents who struggled to access healthcare, by metropolitan
planning region and local municipality. Data source: GCRO QoL 6 (2020/21).
From April 2020, studies have shown that a substantial proportion of South Africans are
experiencing stress during the pandemic (Alexander and Bohler-Muller, 2020a, 2020b). The self-
reported health of South Africans has declined and the risk of depression has increased. This is true
even for those who we might expect to be more resilient given the resources available to them. Using
NIDS-CRAM data, Oyenubi et al.(2021). show that “more poor respondents report bad health
relative to the pre-pandemic period” but, unexpectedly, more respondents from higher income
households report a greater risk of depression than before, relative to those from poorer households.
This is most likely because of the Conservation of Resources theory, which argues that people with
more resources or higher incomes are more likely to feel a greater loss of well-being in certain crisis
situations (Oyenubi et al.(2021).
28Effects of the COVID-19 pandemic on the Gauteng City-Region
QoL 2020/21 data seems to broadly support these findings. Figure 27 compares the percentage of
respondents reporting poor or very poor health, and those at high risk of depression, between
2017/18 and 2020/21 by income group. Those with lower incomes have poorer self-reported health
and are at higher risk of depression, and this has been exacerbated in 2020/21. Those in the middle
and upper middle income categories seemed to be slightly less at risk of depression in 2020/21. But
confirming the insights from Oyenubi et al.(2021) it is intriguing that those in the highest income
group of R51 201 or more a month reported an increase from 7% at risk of depression in 2017/18 to
9% in 2020/21.
Figure 27: Percentage of respondents’ reporting poor or very poor health, and at high risk of depression, by income
group, 2017/18 and 2020/21. Data sources: GCRO QoL 6 (2020/21) and GCRO QoL V (2017/18).
Poor or very poor health High risk of depression
12 17
R1 - R800 R1 - R800
14 19
12 15
R801 - R3 200 R801 - R3 200
15 17
6 12
R3 201 - R12 800 R3 201 - R12 800
11 13
2017/18 2017/18
R12 801 - R25 600
3 2020/21 R12 801 - R25 600
11 2020/21
6 9
R25 601 - R51 200 3 R25 601 - R51 200 10
4 7
3 7
R51 201 and more R51 201 and more
6 9
0 10 20 30 40 50 0 10 20 30 40 50
% respondents % respondents
QoL 2020/21 data indicates that those respondents who reported struggling to access healthcare
were also more likely to report poor health status and be at high risk of depression. Those
respondents who struggled to access healthcare since March 2020 were more likely to suffer from
poor or very poor health status (22% compared to 11% of those who did not struggle to access
healthcare) (Figure 28). Almost one in four respondents (23%) who struggled to access healthcare
are at high risk of depression compared to only 13% of those who had no problem accessing
healthcare. The reverse is also true. Only 6% of those reporting good or excellent health struggled to
access healthcare since March 2020, while 13% of those with poor or very poor health struggled. Of
those at low risk of depression 6% struggled to access health care, compared to 12% of those at high
risk of depression. The data therefore suggests that a not insubstantial number of people who really
needed healthcare in the last year were not able to get it.
Results from the NIDS-CRAM survey waves have shown that people experiencing a risk of
depression have shifted over the course of the pandemic and this risk is strongly influenced by
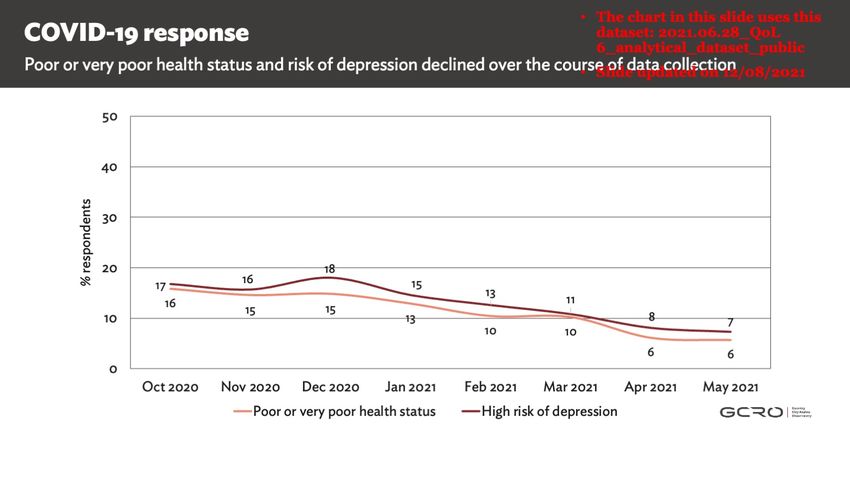
hunger (Hunt et al., 2021). This is also reflected in the QoL 2020/21 data. The proportion of
respondents with poor or very poor health status and the proportion of those at risk of depression
were high when data collection started in October 2020, with risk of depression peaking in
29Effects of the COVID-19 pandemic on the Gauteng City-Region
December 2020, just before the peak of the second wave of COVID-19 infections (Figure 29).
However, both health conditions showed a gradual improvement over the course of data collection.3
Figure 28: Percentage of respondents’ self-reported health status and respondents who struggled to access healthcare
in the last year. Data source: GCRO QoL 6 (2020/21).
Figure 29: Percentage of respondents’ poor or very poor health status and respondents experiencing a high risk of
depression over the duration of data collection. Data source: GCRO QoL 6 (2020/21).
Increasing care of children and other family members
As noted in the section on household responses, more than a quarter of respondents (28%) reported
that they had spent more time than usual looking after children or other family members since
March 2020 and just less than a third of respondents (29%) indicated that they did not have family
caring commitments. The additional caring of relatives has fallen disproportionately to women, with
50% of female respondents with family commitments spending more time on caring for relatives
than male respondents (28%). This reflects findings from other studies that show that while both
3
The progress with fieldwork varied between 803 and 4 104 interviews per month. Although these samples per month
provide statistically valid results, they might not be representative of all areas and population groups.
30You can also read


