Evaluation of Various Methods to Calculate the EGG Contact Quotient
←
→
Page content transcription
If your browser does not render page correctly, please read the page content below
Diploma Thesis in Music Acoustics

                       (Examensarbete 20 p)

Evaluation of Various Methods to Calculate
        the EGG Contact Quotient
                        Christian Herbst
                    Mozarteum, Salzburg, Austria

       Work carried out under the ERASMUS exchange programme.

                 Supervisor: Professor Sten Ternström

                             Approved:
                  Examiner: Docent Anders Askenfelt

                      ……………………………

                        Stockholm 2004-11-16

               Department of Speech, Music and Hearing
                         Lindstedtsvägen 24
                    Kungliga Tekniska Högskolan
                        S-100 44 Stockholm.
Herbst                      Evaluation of Various Methods to Calculate the EGG Contact Quotient   2

         EVALUATION OF VARIOUS METHODS TO CALCULATE THE EGG
                          CONTACT QUOTIENT

Christian Herbst (herbst@speech.kth.se)
University Mozarteum, Salzburg/Austria

         The EGG contact quotient (CQegg) is the ratio of the duration of the 'contact phase'
         to the entire glottal cycle period. Various methods for determining the contacting and
         de-contacting 'events' and then the CQegg have been advanced by different
         authors. There are criterion-level methods which look for threshold crossings in the
         short-term peak-to-peak amplitude of the EGG signal; peak-picking methods applied
         to the first derivative of the EGG signal (DEGG); and hybrid methods that use both
         the EGG signal and its first derivative. The results from six published EGG-based
         methods for calculating the CQegg were compared with the closed quotients derived
         from simultaneous videokymographic imaging (CQkym). Two trained male singers
         were asked to phonate at 295 Hz (D4) in falsetto and in chest register, with two
         degrees of adduction in both registers. The maximum difference in the computed
         CQegg between methods was 0.3 (out of 1.0). The CQegg was generally lower than
         the CQkym. Within subjects, the CQegg co-varied with the CQkym, but with
         changing offsets depending on method. DEGG methods had a low success rate in
         determining the CQegg, due to the occurrence of multiple peaks in the DEGG
         signal. No reasonable results can be expected for falsetto phonation with little
         adduction (untrained, non-counter-tenor-style falsetto). Basic criterion-level methods
         with thresholds of 0.2 or 0.25 gave the best match to the CQkym data. The temporal
         and spatial resolution of the kymograms were however only just adequate for this
         study. The results suggest that contacting and de-contacting events that are derived
         from the electroglottographic signal might not refer to the same physical events as
         do the beginning and cessation of airflow. Hence the concept of contacting and de-
         contacting 'phases' may be more appropriate than contacting and de-contacting
         'events'.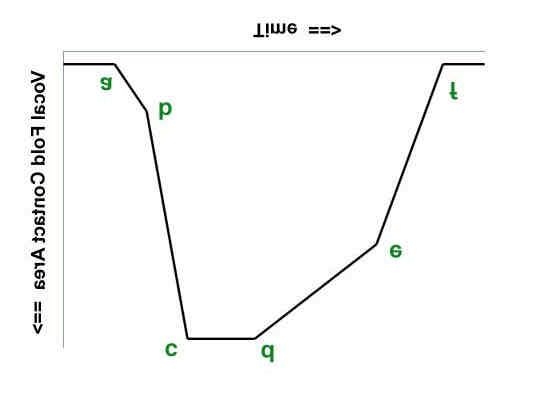
Herbst                                 Evaluation of Various Methods to Calculate the EGG Contact Quotient                                      3

1.     INTRODUCTION ..................................................................................................... 4
     1.1   The electroglottographic signal..........................................................................................4
     1.2   The EGG contact quotient .................................................................................................5
     1.3   Methods for determining the EGG contact quotient ...........................................................6
     1.4   Pilot study..........................................................................................................................8
     1.5   Purpose of this investigation............................................................................................10

2.     METHOD ............................................................................................................... 11
     2.1    Data acquisition...............................................................................................................11
     2.2    Analysis of videokymographic data .................................................................................13
     2.3    Algorithm applied to calculate the EGG signal contact quotient.......................................14
       2.3.1 Calculation of the EGG signal energy..........................................................................14
       2.3.2 Removal of DC offset and signal normalization ...........................................................14
       2.3.3 Pitch detection.............................................................................................................14
       2.3.4 Calculation of jitter factor, and pitch data quality assessment......................................14
       2.3.5 Detection of single vocal fold vibratory cycles in the EGG signal ................................. 14
       2.3.6 Calculation of signal derivatives...................................................................................15
       2.3.7 Determination of contacting events..............................................................................15
       2.3.8 Determination of de-contacting events ........................................................................16
       2.3.9 Calculation of contact quotient.....................................................................................18
       2.3.10    Calculation of jitter factor and CQ data quality assessment .....................................18
     2.4    Analysis of recorded electroglottographic data ................................................................19

3.     RESULTS .............................................................................................................. 21
     3.1  Videokymographic data ...................................................................................................22
     3.2  Electroglottographic data................................................................................................. 23

4.      DISCUSSION ........................................................................................................ 26

5.      CONCLUSIONS .................................................................................................... 28

6.      ACKNOWLEDGEMENTS ...................................................................................... 29

7.      REFERENCES ...................................................................................................... 30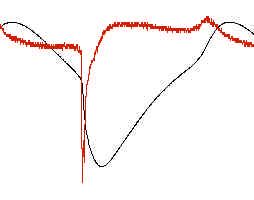
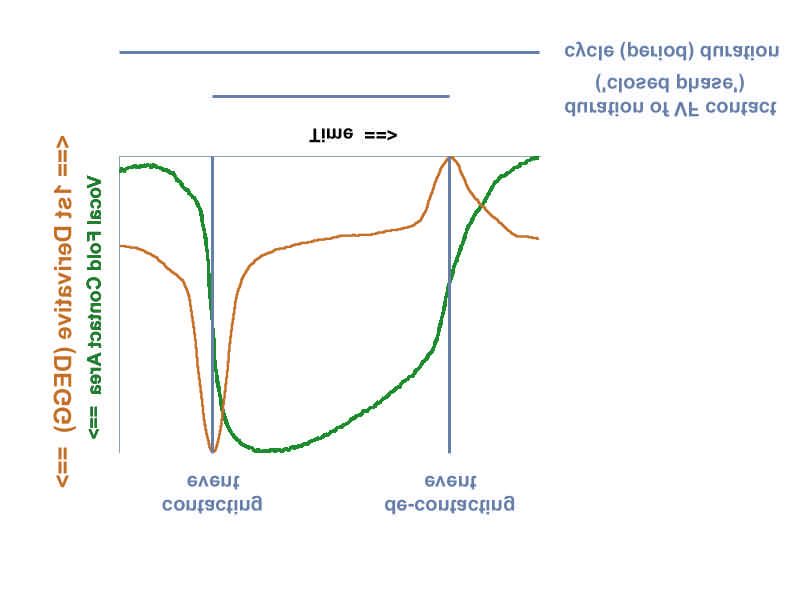
Herbst                           Evaluation of Various Methods to Calculate the EGG Contact Quotient                    4

1. INTRODUCTION

1.1 The electroglottographic signal
Electroglottography, first invented by Fabre (Fabre, 1957), is a non-invasive method to measure
variations in the contact area between the two vocal folds, as a function of time. A small, high-
frequency current, usually having a frequency between 300 kHz and several megahertz, is passed
through two electrodes that are placed on each side of the larynx. Since human tissue is a fairly
good electrical conductor compared to air, the opening and closing of the vocal folds will cause
variations in the electrical impedance across the larynx.

Baken and Orlikoff, 2000, give an excellent overview of electroglottography and its applications, as
do Baken, 1992, Kitzing, 1990 and Colton and Conture, 1990. The latter also describe the possible
misinterpretations of the electroglottographic signal.

Earlier research (e.g. Baer et al., 1983 or Childers et al., 1983) suggests that there is a close
relation between peaks in the rate of change of the EGG signal, and the closing and opening
events of the vocal folds. Rothenberg, 1981, identified certain landmarks that are related to the
movement and position of the vocal folds during phonation (Figure 1). This model is shown here as
represented by Baken and Orlikoff, 2000.

Figure 1: A model representing the landmarks in the electroglottographic signal of one cycle of vocal fold vibration.

a) Increase in vocal fold contact begins, starting at the lower margins of the vocal folds.
b) Vocal folds begin to touch fully; closure at the upper margins of the vocal folds.
c) Maximum contact reached. Especially in chest register, this might correlate with full closure of
   the vocal folds. However, the EGG signal alone does not indicate that closure is complete.
d) End of maximum contact. The opening phase begins, starting at the lower margins of the vocal
   folds.
e) Start of separation of the upper margins of the vocal folds.
f) Minimal vocal fold contact reached. Since the vocal folds are oscillating, we know that the glottis
   is open at this point.
Herbst                          Evaluation of Various Methods to Calculate the EGG Contact Quotient     5

1.2    The EGG contact quotient

Electroglottography is a non-invasive method that can be performed at relatively low cost. It has
achieved a certain popularity as a tool for assessing phonatory behaviour in clinical practice. There
have also been attempts to introduce electroglottography as a real-time feedback tool in the voice
studio to be used in teaching situations (Garner and Howard, 1999; Batty et al., 2002; Miller et al.,
2004).

It would be desirable to have access to a single parameter that could be computed from the
electroglottographic signal, and which would reflect the movement and status of the vocal folds
during phonation. Such a parameter might be derived from the duration of the vocal fold contact
during each single vibratory cycle. Rothenberg introduced a measure of the 'relative vocal fold
abduction' (Rothenberg, 1988), generally known as the 'contact quotient' or CQ.

As shown in Figure 2, the contact quotient is used to compare the duration of the contact phase to
the period of the vibratory cycle. This is done by defining the temporal positions of a contacting
event and a de-contacting event.

Figure 2: Calculation of the EGG contact quotient by defining contacting and de-contacting events.

The EGG contact quotient is sometimes also referred to as 'Closed Quotient' or 'EGG Closed
Quotient'. However, until there is consensus as to where exactly the contacting and de-contacting
events are to be located in each consecutive cycle of the EGG signal, and whether those contacting
and de-contacting events indeed coincide with the events of glottal closure and opening, we will use
the term 'contact quotient' instead of 'Closed Quotient' to avoid confusion. A different attempt to
bypass this problem is made by Hacki, who prefers the term 'Quasi Closed Quotient' or qCQ
(Hacki, 1996). Throughout this article, we will refer to the EGG contact quotient as CQEGG.
Herbst                      Evaluation of Various Methods to Calculate the EGG Contact Quotient              6

1.3   Methods for determining the EGG contact quotient

During the last fifteen years, several methods to calculate the CQEGG have been suggested and
applied in research.

Rothenberg, 1988, proposed a 'criterion-level method' for estimating the 'relative vocal fold
abduction' per duty cycle of the EGG signal. The peak-to-peak amplitude of each vibratory cycle is
computed. The contacting event is defined as that point in time when the signal strength exceeds a
certain 'criterion level' or 'threshold level', which is usually indicated as a percentage of the peak-to-
peak amplitude. In past research, criterion levels between 20 % and 50 % have been used. The
duration of the closed phase is defined as the time difference between the de-contacting and the
contacting events, and the CQEGG is computed as the duration of the closed phase divided by the
period duration (Figure 3).

Recently, Henrich et al., 2004, proposed a method called DECOM to calculate the CQEGG based
only on the first derivative of the EGG signal (DEGG). The authors concluded that the algorithm
results correlate with Open Quotient measurements derived from the inverse-filtered glottal flow,
provided that single opening and closing peaks are found in the DEGG signal.

The DEGG signal represents the rate of change in the vocal fold contact area, as shown in Figure
4. A positive peak indicates the maximum rate of increase in vocal contact area, while the negative
peak conversely indicates the maximum rate of decreasing area. It has been suggested that such
peaks coincide with the events of glottal closure and opening respectively (Childers et al., 1983,
Childers et al., 1986, Baer et al., 1983, and recently Henrich et al., 2004). Baer et al., 1983, report
that this might not apply to the glottal opening in female voices. Henrich et al. observe that such a
conclusion can only be made, if there is one unambiguous peak in each of the opening and closing
sections of the DEGG signal. If there are multiple peaks, the timing of the glottal event remains
undetermined.

Rothenberg, 1988, points out that the derivative of weak signals with a large high-frequency noise
component is even noisier and therefore not well suited to peak detection.

A hybrid method for the calculation of the CQEGG has been proposed by Howard (Howard et al.,
1990, Howard, 1995). The contacting event is defined by the peak in the DEGG signal during the
closing phase, whilst the de-contacting event is assumed to be the point in time when the EGG
signal strength falls below a criterion level of ca. 42 % (three sevenths).
Herbst                           Evaluation of Various Methods to Calculate the EGG Contact Quotient                        7

Figure 3: Calculation of the EGG contact quotient by a criterion-level method. In this case, a threshold of 25 % of the local
signal peak-to-peak amplitude is used.

Figure 4: Calculation of the EGG contact based on the first derivative of the EGG signal (DEGG). The contacting and de-
contacting events are identified as the positive and negative peak in the DEGG signal.
Herbst                     Evaluation of Various Methods to Calculate the EGG Contact Quotient         8

1.4 Pilot study
Whilst conducting a pilot study to compare the different methods for calculating the CQEGG, we
found a certain level of disagreement between the results of the different methods. A difference of
0.1 to 0.2 of CQEGG values between the average results of different methods was quite common;
the maximum difference encountered was 0.35.

Figure 5 shows the results of the calculation of the CQEGG values using the different methods
described above. The performed phonatory task was a repetition of octave glides from F#2 (185
Hz) to F#3 (F#2 / F#3 / F#2 / F#3 / F#2) on the vowel [a], performed by an experienced amateur
choir singer (baritone) with no vocal pathology. At the low notes (F#2) there is a considerable
ambiguity of the data as returned by the various methods to determine the contacting and de-
contacting events, resulting in a maximum difference in CQEGG of 0.3. Figure 6 represents one cycle
of the EGG signal and its normalized first derivative, taken at a temporal offset of 4.5 seconds. The
ambiguous CQEGG data values can be explained by the following considerations:

   a) The part of the closing phase up to the point where the upper margins of the vocal folds
      begin to touch is rather long (region between landmark a and b in the model shown in
      Figure 1), which influences the results of criterion-level methods.
   b) The opening phase is rather long and does not show a pronounced ‘knee’, resulting in large
      differences between various criterion-level methods.
   c) The first derivative calculated as the difference between adjacent samples looks somewhat
      ‘fuzzy’ and has a great number of local peaks which might not be relevant for the detection
      of opening and closing events. It is a question of whether and how the EGG signal may be
      pre-processed to give the ‘right’ results.
   d) Even if small local peaks in the DEGG signal are neglected, there are two very pronounced
      negative peaks for the opening phase, which are separated by approximately 40 % of the
      cycle duration. Theoretically, there are three ways to deal with this phenomenon:

             • Assume that no CQEGG can be calculated for cycles with multiple peaks in either
               the closing or the opening phase of the DEGG signal (Henrich, 2004).
             • Define that the strongest peak represents the (de)contacting event.
             • Assume that the (de)contacting event is represented by some sort of average
               between the peaks.

         The latter two approaches do not necessarily correspond with physiological evidence and
         might result in arbitrary data.

In addition to a great disagreement in calculated CQEGG data between various methods, it appeared
that for weak falsetto phonation the resulting values of about 0.5 might have no correspondence
with the actual closed quotient which tends to be considerably lower. Sundberg and Högset, 2001,
report that professional counter tenors exhibited closed quotient values, as derived from glottal flow,
in a range of zero to 0.33 for falsetto phonation. It is conceivable that in untrained singers, falsetto
phonation will produce even lower closed quotients, and incomplete closure is generally to be
expected.
Herbst Evaluation of Various Methods to Calculate the EGG Contact Quotient 9 Figure 5: The CQEGG data for a series of octave glides from F#2 (185 Hz) to F#3, as calculated with different methods at a sampling rate of 1000 Hz. The methods used in this pilot study are described below in Table 2. The region between four and five seconds in the audio signal, where the CQEGG values differ by as much as 0.3, represents the second repetition of the note F#2 after a downward glide from F#3.
Herbst                         Evaluation of Various Methods to Calculate the EGG Contact Quotient                     10

Figure 6: One single cycle of the EGG signal (black) and its normalized first derivative (orange), calculated as the
difference between adjacent samples. The data was taken from the EGG signal analyzed in Figure 5 at a temporal
offset of 4.5 seconds (see text).

1.5 Purpose of this investigation
The purpose of this investigation is to explore the possibilities of using the EGG CQEGG as a tool
for assessing registration quality in classical singing.

The outcome of the pilot study described above motivated us to carry out a more detailed
investigation of the differences between the various methods used in the field so far, and to try
to assess their reliability. We were particularly interested in the question whether the results of
one of those methods would correlate with the Closed Quotient as derived from
videokymographic imaging (CQKYM).
Herbst                            Evaluation of Various Methods to Calculate the EGG Contact Quotient            11

2. METHOD

2.1    Data acquisition

Two subjects (CH and HJ) participated in the experiment. Both are baritones with considerable
singing training and professional experience in classical singing. In addition, subject CH works
as a singing teacher and HJ as a choir conductor.

Both subjects had two training sessions, during which they learned to monitor themselves with
videostroboscopy/videokymography while singing. In particular, they acquired the skill to
phonate in distinct registers (chest and falsetto) with independent control of the degree of glottal
adduction. The adduction was assessed during the training sessions by inspecting whether the
arytenoids were pressed together or spread apart, which determined whether the cartillagenous
portion of the glottis was closed or not.

The subjects were asked to produce several repetitions of four types of phonation: chest with
maximal and minimal adduction, and falsetto with maximal and minimal adduction. These types
will be referred to as shown in table Table 1:

Phonation Short                    Visual Evidence (Videostroboscopy)                    Remarks
Type      Description
Type 1         Falsetto, little    Cartillagenous glottis open                           Described by the subjects
               adduction                                                                 as “untrained singers'
                                                                                         falsetto”
Type 2         Falsetto, much      Cartillagenous glottis closed                         Described by the subjects
               adduction                                                                 as counter tenor singing
                                                                                         style.
Type 3         Chest, little       Not possible to determine whether cartillagenous        Described by the subjects
               adduction           glottis is open or not: could be either ‘almost opened’ as “head voice” or “mixed
                                   or ‘almost closed’, varying from sample to sample       voice”.
Type 4         Chest, much         Cartillagenous glottis closed, vocal processes        Described by the subjects
               adduction           pressed together                                      as “full chest voice” or
                                                                                         “operatic voice”

Table 1: The phonation type classification used for this investigation.

The pitch of each utterance was D4, having a fundamental frequency of about 294 Hz. Each
sample had a minimum duration of one second. The videokymographic samples had to have a
clear image with good contrast and focus. The scan line, which is the top line in the picture in
'video' mode, had to be properly positioned at the vocal folds at the beginning and the end of the
videokymographic sample. The target area for the scan line was the location of maximal vocal
fold amplitude, corresponding to the region between 33 % and 50 % of the vocal fold length, as
seen from the anterior end.
Herbst Evaluation of Various Methods to Calculate the EGG Contact Quotient 12
Three conditions of visual, auditory and proprioceptive matching had to be met upon verifying
that the subjects performed the phonation task with the designated phonatory settings regarding
register and degree of adduction:
1.) The subjects, having as trained singers an excellent control of subtle glottal
settings, must have perceived that their phonation was of the targeted phonation
type.
2.) The perceptual quality of the phonation must have matched the auditory
impression that had been had during the videostroboscopic training sessions.
3.) The videokymographic data must have shown a distinct pattern, which it had in
common with all the other samples of the particular singer phonating in the
targeted phonation type.
The videokymographic samples where recorded with a Lambert Instruments Kymocam CCD
camera using 70 (subject HJ) and 90 degree (subject CH) rigid endoscopes and a Wolf 5131
light source. The video signal has been digitized using a Pinnacle DV 500 System at a sampling
rate of 7812.5 Hz and has been stored as AVI files using the Intel Indeo 5.0 codec. The EGG
signal was recorded simultaneously with a Glottal Enterprises MC2-1 two channel
electroglottograph [as described by Rothenberg (1992)], with the lower cut-off frequency
adjusted at 2 Hz. For reference purposes the acoustic signal was recorded, too. Both the
acoustic and the EGG signal were stored in the videokymographic AVI files using PCM
encoding at a sampling rate of 48000 Hz (i.e. no compression was used), and were later
extracted to WAV files with VirtualDubMod (http://virtualdubmod.sourceforge.net) for further
analysis.Herbst Evaluation of Various Methods to Calculate the EGG Contact Quotient 13
2.2 Analysis of videokymographic data
For the analysis we only considered videokymographic samples where there was
• a stable and constant vocal fold oscillation without any perturbations and
changes in adduction or register settings,
• a clear image, and where
• the videokymographic scan line was in a region between 33 % and 50 % of the
vocal fold length, as seen from the anterior end
The videokymographic data was analysed with an application called VKIS (Version 2.2, created
by Ales Vetesnik and Jan G. Švec, © Medical Healthcom, Ltd., Prague 2002). From the start,
the middle and the end of each videokymographic sample images were extracted and exported
as bitmaps with a 24 bit colour depth. Each image contained a videokymographic chain
consisting of four to five complete vibratory cycles of the vocal folds. At the given phonation
frequency (around 294 Hz in all cases), each vocal fold vibratory cycle was represented by
about 27 pixels vertically, the glottal width (indicated here only for reference purposes) was
represented by 5 to 25 pixels, depending on the distance of the camera from the glottis, and the
amplitude of vocal fold vibration.
The events of glottal closure and opening were determined manually by placing a horizontal line
a) at the point where the initial contact between the vocal folds occurred and b) where the
contact between the vocal folds was finally released. Upon the occurrence of a vertical phase
difference between the upper and lower part of the vocal fold, the event of contact has been
defined as the point where the vocal folds just meet, which in case of the bitmap images
corresponds to the region where there was a clear change from the black representing the
opened glottis to some shade of grey. In falsetto phonation with minimal adduction it was
difficult to determine whether there was a closure at all or not, due to the nature of the
videokymographic images which gave, as has been mentioned above, only a low image
resolution.
Once the opening and closure events were detected, the number of pixels measured for the
closed part of a vibratory cycle was divided by the number of pixels representing one whole
period. This was repeated for four consecutive cycles per exported bitmap; the results (twelve
data points per videokymographic sample) were averaged and represented the manually
determined closed videokymographic closed quotient (CQKYM).
In total, 31 samples have been analyzed, and 352 opening and closing events have been
detected manually.Herbst Evaluation of Various Methods to Calculate the EGG Contact Quotient 14 2.3 Algorithm applied to calculate the EGG signal contact quotient The electroglottographic data has been analyzed using a C++ software library, developed by the author C.H. In particular, the following steps are performed upon data analysis: 2.3.1 Calculation of the EGG signal energy A window of a certain length (the default value is 100 ms) is slided over the signal and the RMS value as a function of time is calculated. The computed data is used later to determine those portions of the signal where its energy is below the noise floor. 2.3.2 Removal of DC offset and signal normalization The DC offset is removed, and the signal is normalized in a way that its absolute maximum equals 0.99 (-1 to 1 being the range of allowed values). 2.3.3 Pitch detection An auto-correlation based pitch detection algorithm described by Paul Boersma (Boersma, 1993) has been implemented. (This is the same algorithm that is included in the software package Praat [ http://www.praat.org ] ). For the analysis described here, we have modified the default parameters proposed by P. Boersma as follows: TimeStep = 5 ms, MinimumPitch = 49 Hz (G1), VoicingThreshold = 0.6, SilenceThreshold = 0.05. 2.3.4 Calculation of jitter factor, and pitch data quality assessment The calculated pitch data is subjected to a jitter analysis by calculating the jitter factor as defined by Hollien et. al. (Hollien, Michel & Doherty, 1973) to aid in the elimination of unstable pitch regions: If, at a certain point of time, a jitter factor above 10 is detected, the pitch data in a region of 100 ms, centred at that particular point, is discarded. The corresponding portion of the EGG signal will not be taken into account upon CQ computation any further. This step has been introduced to ensure that only stable phonations and signals of a sufficiently good quality are considered in automated EGG signal analysis. 2.3.5 Detection of single vocal fold vibratory cycles in the EGG signal In this analysis step, single cycles in the EGG signal are detected, based on the pitch data computed earlier. Some general parameters such as local amplitude peaks and cycle length are determined. For optimal alignment of each single cycle, such as that the begin of the closing phase matches the begin of the cycle, and that the entire cycle is covered by the calculated period duration, the algorithm performs a preliminary detection of contacting events in the EGG signal by calculating the first derivative of each period, discards the negative data values and calculates the short-term-windowed RMS. The peak of the resulting signal is defined as the (preliminary) closing event. Each signal cycle is aligned in a way that this contacting event is located at fixed relative offset of 22 % of the period duration.
Herbst                     Evaluation of Various Methods to Calculate the EGG Contact Quotient        15

As a 'by-product' of this work, a program called 'Moving EGG' has been created, which extracts
single EGG cycles from a stereo audio file (left channel: audio, right channel: EGG signal) and
creates an AVI movie file to view the single EGG cycles in real-time while listening to the audio
signal. More information about Moving EGG is available on the web at http://www.moving-
egg.org

2.3.6 Calculation of signal derivatives
In certain types of contact quotient computation, the calculations are based on the first
derivative of the EGG signal (DEGG signal). The algorithm described here offers the basic
option to calculate the first derivative as the consecutive difference of two adjacent samples.
However, it appears that due to high frequency components in the signal the aforementioned
way of computing the derivative is not sufficient for the task at hand, since in both the closing
and the opening phase multiple local peaks would occur. Thus, we have introduced the option to
calculate the derivative as a linear regression fit by centring a window with a certain width
relative to the local period duration on consecutive samples of the particular cycle. After the
linear regression fit has been calculated, the window is advanced by one sample and the
procedure is repeated until the end of the analyzed cycle has been reached. In general, a
window size of 5 % of the local period duration has been used.

2.3.7 Determination of contacting events
The algorithm offers four different ways to determine the contacting event of each vocal fold
vibratory cycle:

2.3.7.1 Single peak in DEGG signal
The derivative of the EGG signal, calculated as described above, is modified in a way that all
negative values are set to zero. Peak detection (i.e. a detection of local maxima in the modified
DEGG signal) is performed. If only one single peak is found, the corresponding point of time in
the EGG signal is interpreted as the contacting event. If more than one peak is found, the
algorithm gives up and indicates a failure and no contact quotient value will be calculated for the
particular cycle. For a corresponding graphical representation, please refer to Figure 7, where
the peak detection for the opening phase is described.

2.3.7.2 Maximum peak in DEGG signal
The DEGG signal is modified as described above. If there is one single peak, it is interpreted as
the contacting event. If more than one peak is found, the maximum peak is defined as the
contacting event. This method has a greater chance of detecting contacting events than the
previous one. However, its results are not as reliable since in the case of multiple peaks the
relative location of the contacting event might exhibit sudden 'jumps' from one cycle to the next.
For a corresponding graphical representation, please refer to Figure 8, where the peak
detection for the opening phase is described.

2.3.7.3 Average peak in DEGG signal
The DEGG signal is modified as described above. If there is one single peak, it is interpreted as
the contacting event. If several peaks are found, the average closing event x event is calculated
as
Herbst                     Evaluation of Various Methods to Calculate the EGG Contact Quotient         16

                                      N
                                                  x i yci
                                  i       1
                        x event               N
                                                                                                 (1)
                                                      yic
                                          i       1

where N is the number of detected local peaks in the closing phase of the cycle and c 6 is a
power factor coefficient to shift emphasis to greater values. For a corresponding graphical
representation, please refer to Figure 9, where the peak detection for the opening phase is
described

2.3.7.4 Threshold crossing
The threshold crossing or 'criterion level' method establishes the local (cycle-based) minimum
and maximum of the original EGG signal. The contacting event is defined as the point where the
locally normalized EGG signal strength exceeds a certain threshold (0 < x < 1). Since the single
EGG signal cycles have already been aligned properly (see above), the detection of the
threshold crossing can start at the beginning of each single cycle. For a graphical
representation, please refer to Figure 3.

2.3.8 Determination of de-contacting events
The algorithm offers four different ways of determining the de-contacting event of each vocal
fold vibratory cycle:

2.3.8.1 Single peak in DEGG signal
This method is similar to the respective DEGG based methods used for detection of the
contacting event (as described above), with the difference that the negative part of the
derivative is taken into account. For a graphical representation, please refer to Figure 7.

2.3.8.2 Maximum peak in DEGG signal
This method is similar to the respective DEGG based methods used for detection of the
contacting event (as described above), with the difference that the negative part of the
derivative is taken into account. For a graphical representation, please refer to Figure 8.

2.3.8.3 Average peak in DEGG signal
This method is similar to the respective DEGG based methods used for detection of the
contacting event (as described above), with the difference that the negative part of the
derivative is taken into account. For a graphical representation, please refer to Figure 9.

2.3.8.4 Threshold crossing
This case is similar to the threshold crossing method used for detection of the contacting event.
Regarding the value of the threshold, two options are available: Either a fixed threshold can be
Herbst Evaluation of Various Methods to Calculate the EGG Contact Quotient 17 used (similar to the threshold method of detecting the contacting event), or a variable threshold derived from the signal strength at the determined contacting event of each particular cycle can be applied. The latter case is applicable only when a DEGG based method for contacting event determination has been used. For a graphical representation, please refer to Figure 3. Figure 7: Determination of the opening event by looking for a single peak in the DEGG signal of the opening phase. The algorithm produces no results when more than one peak is found. Figure 8: Determination of the opening event by looking for the strongest peak in the DEGG signal of the opening phase.
Herbst                         Evaluation of Various Methods to Calculate the EGG Contact Quotient                  18

Figure 9: Determination of the opening event by averaging the peaks found in the DEGG signal of the opening
phase. Equation (1) is applied, the weighting factor c is set to 6.

2.3.9 Calculation of contact quotient
The contact quotient for each cycle is calculated as

                                    xDecontacting xContacting i
                          CQi                                                                                 (2)
                                                     li

where i is the index of the particular cycle, xDecontacting and xContating are the relative
offsets of the de-contacting and contacting event respectively, and l is the length of the
particular cycle. Since the period duration varies with each cycle, the resulting series of CQ
values is converted to a signal with a fixed sampling rate (1000 Hz) by linear interpolation
between the CQEGG data of two consecutive glottal cycles.

2.3.10 Calculation of jitter factor and CQ data quality assessment
As with the pitch data (see above), the calculated CQ data is subjected to a jitter factor analysis.
Regions where the jitter factor exceeds a threshold of 3 are discarded. This step has been
introduced to assure some stability in the calculated data. The chosen jitter factor threshold is
low enough to get rid of unwanted artefacts due to noise and perturbations in the EGG signal,
but is high enough to allow abrupt register transitions and bifurcations to be reflected in the
calculated data.
Herbst Evaluation of Various Methods to Calculate the EGG Contact Quotient 19
2.4 Analysis of recorded electroglottographic data
The EGG signals corresponding to all the samples that have been chosen for computation of
the videokymographic closed quotient (CQKYM) were subjected to analysis with the algorithm
described above. The following methods for detecting the contacting and de-contacting events
were applied:
Method Name (Alias Reference Contacting De-Contacting Window Size for
Name) Event Event Linear
Regression Fit in
DEGG Signal (%
of cycle
duration)
CL 0.2 Sapienza et al., CL = 20 % CL = 20 % N/A
1998
CL 0.25 Orlikoff, 1991 CL = 25 % CL = 25 % N/A
CL 0.35 Rothenberg, CL = 35 % CL = 35 % N/A
1998; Voce Vista
Default (Miller et
al., 2004)
CL 0.5 Rothenberg, CL = 50 % CL = 50 % N/A
1998;
DEGG SINGLE 0.05 Henrich, 2004 DEGG (single DEGG (single peak 5%
peak only) only)
DEGG SINGLE 0.15 Henrich, 2004 DEGG (single DEGG (single peak 15 %
peak only) only)
DEGG SINGLE 0.3 Henrich, 2004 DEGG (single DEGG (single peak 30 %
peak only) only)
DEGG AVG N/A DEGG (average DEGG (average 5%
peaks) peaks)
DEGG MAX N/A DEGG (strongest DEGG (strongest 5%
peak) peak)
DEGG HYBRID 3/7 Howard, 1995 DEGG (strongest CL = 42 % (three 5%
peak) over seven)
DEGG ADAPTIVE N/A DEGG (average CL (adaptive; local 5%
peaks) signal strength at
detected
contacting event)
Table 2: An overview over the different methods used to calculate the CQEGG
The CQEGG was computed on a cycle-to-cycle basis, and the results were averaged for each
sample. This was possible because the quality criteria for the chosen samples (see above)
determined that the phonation had to be stable with regards to pitch, register (phonation type),
perceptual quality and videokymographic pattern. A post-hoc inspection of the calculated CQEGG
data revealed that also the latter was rather stable.
The single peak DEGG algorithms presented here (called DEGG SINGLE x) differ from the
algorithms used by Henrich et al., 2004, in that no biased intercorrelation function is calculated
for the signal to be analyzed and a synthetic signal of identical length and period (Henrich et al.,
2004, Par. III. B 5.). Instead, the EGG signal is smoothed by applying a linear regression fit with
varying window sizes of 5 % to 30 % of the local period, and peaks are detected in the time
domain.Herbst Evaluation of Various Methods to Calculate the EGG Contact Quotient 20
The automatic detection of peak doubling in the DECOM algorithm used by Henrich et al. (see
above quote) introduces arbitrary threshold values, which de-facto has the same effect as low-
pass filtering the EGG signal before processing it. The decision as to whether a single or
multiple peaks are found in the signal is dependent on the values of those thresholds; therefore,
data reliability is slightly decreased. The same, however, accounts for the method presented
here, which slightly distorts the results by applying a linear regression fit to the EGG signal. It
appears that the need to somehow prepare the EGG signal to return expected data values
arises in both cases: Whereas the method presented here eliminates noise in the signal before
calculating the derivative, Henrich et al. elegantly postpone this measure until the last step of
data processing.
In this context, it is important to realize that all methods examined in this experiment do, without
exception, require some sort of human intervention. Decisions as to how to pre-process the
EGG signal, how to set certain thresholds, and how to post-process the derived CQEGG data
must be made by the persons that implement and/or employ the various algorithms. The
reliability of the computed data suffers for two reasons:
a) As long as it is not entirely clear, which portion of the EGG signal constitutes the actual
signal, and which portion consists of unwanted artefacts, arbitrary parametrization
should not be performed.
b) It can be assumed that persons using methods to calculate the CQEGG do have some
idea as to which results to expect. This expectation may, however, influence the way in
which the algorithm parametrization is performed, thus creating classical self-fulfilling
prophecies.Herbst Evaluation of Various Methods to Calculate the EGG Contact Quotient 21
3. RESULTS
Figure 10 shows some typical results as calculated for one selected phonation sample. From
inspecting the results for the single phonation samples, the following trends emerge:
• The average value of the three data points computed for the CQKYM is generally higher
than the CQEGG values as derived by most of the methods.
• The different methods generally provide results that are stable over time in stable
phonation, separated from each other by a certain offset.
• The DEGG SINGLE algorithm does not seem to have a high success rate for the voice
samples used here.
• The CQEGG data calculated with criterion-level methods with low thresholds (20 % or 25
%) seems to agree best with the respective CQKYM data.
Figure 10: Typical results for the computation of CQKYM and CQEGG data for two seconds of phonation. The subject
CH sung in chest voice with a high degree of adduction. The x-axis represents time at a sampling rate of 1000 Hz,
the y-axis represents the calculated quotients. The CQKYM data, which is represented by only three data points, is
shown as a continuous graph to enhance its visibility.
To reveal general trends, all data was finally accumulated per phonation type.Herbst Evaluation of Various Methods to Calculate the EGG Contact Quotient 22
3.1 Videokymographic data
The cumulated results for the videokymographic data are listed in Table 4. There is a clear
increase of the CQKYM values with change in registration (from falsetto to chest) and increase of
adduction. The data collected for phonation type 1 (falsetto with little adduction) is unreliable
because the somewhat limited horizontal image resolution did not allow the determination of
glottal closure. The videostroboscopic images of comparable phonation samples showed that
both our subjects sang with incomplete glottal closure. However, since this does not constitute
strong evidence, we assume that our experiment did not produce valid CQKYM data for phonation
type 1.
CQKYM for all phonation types
CQKYM
Phonation Type Data Count CQKYM Avg CQKYM Min. CQKYM Max.
Std.Dev.
1 (Falsetto, little
18 0.11 0.13 0 0.29
adduction)
2 (Falsetto,
20 0.33 0.06 0.22 0.44
much adduction)
3 (Chest, little
24 0.52 0.07 0.4 0.64
adduction)
4 (Chest, much
26 0.67 0.07 0.4 0.77
adduction)
Table 3: CQKYM, as derived from videokymographic images. The values for both subjects are cumulated and
grouped per phonation type.Herbst Evaluation of Various Methods to Calculate the EGG Contact Quotient 23
3.2 Electroglottographic data
The CQEGG data for phonation type 1 (falsetto, little adduction) was generally rather high (values
between 0.35 and 0.6). Criterion-level methods produced the highest results, whereas DEGG
based methods generally tended to return lower values. However, the success rate of the latter
methods was very low, as can be seen in Table 4. The EGG signal for phonation type 1 was
generally very weak, it can be assumed that it contained much high frequency artefacts /
random noise. Therefore, results from DEGG based methods (except for the DEGG HYBRID
3/7 method) were not considered any further.
For phonation types 2, 3 and 4 the DEGG SINGLE methods had a rather low success rate
which could only be raised by increasing the window size for the linear regression straight line fit
to as much as 30 % of the period duration. Since such a large window size introduces a high
degree of uncertainty, we assume that the calculated data is not reliable and is therefore not
considered any further.
CQEGG for phonation type 1 (falsetto, little adduction)
Success Avg. Diff. Std. Dev.
Algorithm Avg. CQEGG
Rate Kym. (Kym.)
CL 0.2 0.857 0.612 0.507 0.533
CL 0.25 0.878 0.569 0.463 0.488
CL 0.35 0.882 0.497 0.390 0.414
CL 0.5 0.879 0.406 0.299 0.325
DEGG AVG 0.290 0.393 0.065 0.101
DEGG ADAPTIVE 0.460 0.420 0.254 0.284
DEGG HYBRID 3/7 0.830 0.450 0.345 0.368
DEGG MAX 0.269 0.392 0.066 0.103
DEGG SINGLE 0.05 0.000 N/A N/A N/A
DEGG SINGLE 0.15 0.000 N/A N/A N/A
DEGG SINGLE 0.3 0.123 0.358 0.267 0.333
Table 4: CQEGG data for phonation type 1 (falsetto with little adduction), cumulated for both subjects.Herbst Evaluation of Various Methods to Calculate the EGG Contact Quotient 24
CQEGG for phonation type 2 (falsetto, much adduction)
Success Avg. Diff. Std. Dev.
Algorithm Avg. CQEGG
Rate Kym. (Kym.)
CL 0.2 0.951 0.328 -0.001 0.078
CL 0.25 0.959 0.313 -0.016 0.076
CL 0.35 0.962 0.286 -0.042 0.081
CL 0.5 0.958 0.247 -0.082 0.102
DEGG AVG 0.866 0.261 -0.065 0.090
DEGG ADAPTIVE 0.950 0.288 -0.041 0.085
DEGG HYBRID 3/7 0.978 0.280 -0.048 0.084
DEGG MAX 0.852 0.260 -0.066 0.090
DEGG SINGLE 0.05 0.000 N/A N/A N/A
DEGG SINGLE 0.15 0.000 N/A N/A N/A
DEGG SINGLE 0.3 0.012 0.276 -0.254 0.297
Table 5: CQEGG data for phonation type 2 (falsetto with much adduction), cumulated for both subjects.
CQEGG for phonation type 3 (chest, little adduction)
Success Avg. Diff. Std. Dev.
Algorithm Avg. CQEGG
Rate Kym. (Kym.)
CL 0.2 0.965 0.540 0.013 0.030
CL 0.25 0.963 0.518 -0.008 0.029
CL 0.35 0.963 0.483 -0.044 0.052
CL 0.5 0.965 0.436 -0.091 0.095
DEGG AVG 0.961 0.473 -0.053 0.066
DEGG ADAPTIVE 0.966 0.451 -0.076 0.082
DEGG HYBRID 3/7 0.974 0.473 -0.054 0.060
DEGG MAX 0.956 0.473 -0.052 0.066
DEGG SINGLE 0.05 0.000 N/A N/A N/A
DEGG SINGLE 0.15 0.319 0.486 -0.221 0.296
DEGG SINGLE 0.3 0.857 0.473 -0.062 0.068
Table 6: CQEGG data for phonation type 3 (chest with little adduction), cumulated for both subjects.Herbst Evaluation of Various Methods to Calculate the EGG Contact Quotient 25
CQEGG for phonation type 4 (chest, much adduction)
Success Avg. Diff. Std. Dev.
Algorithm Avg. CQEGG
Rate Kym. (Kym.)
CL 0.2 0.925 0.67 0 0.05
CL 0.25 0.924 0.64 -0.03 0.05
CL 0.35 0.924 0.6 -0.07 0.08
CL 0.5 0.914 0.54 -0.12 0.13
DEGG AVG 0.914 0.58 -0.09 0.1
DEGG ADAPTIVE 0.917 0.54 -0.13 0.13
DEGG HYBRID 3/7 0.926 0.58 -0.09 0.1
DEGG MAX 0.913 0.58 -0.09 0.1
DEGG SINGLE 0.05 0.000 N/A N/A N/A
DEGG SINGLE 0.15 0.233 0.57 -0.23 0.34
DEGG SINGLE 0.3 0.692 0.58 -0.15 0.25
Table 7: CQEGG data for phonation type 4 (chest with much adduction), cumulated for both subjects.Herbst Evaluation of Various Methods to Calculate the EGG Contact Quotient 26 4. DISCUSSION With regards to phonation type 1 (falsetto with little adduction), there are considerable discrepancies between CQEGG and CQKYM data, the latter being much lower. Considering that videokymographic and videostroboscopic data support the evidence of incomplete glottal closure, the validity of the CQEGG data is questionable. A very weak signal and a possibly small amplitude of vocal fold vibration results in a signal that closely resembles a sinusoid. We therefore conclude that phonation type 1 EGG signals are not suitable for CQEGG calculation. In this context, it is important to notice that little adduction in falsetto does not necessarily correspond with a small amplitude of vocal fold vibration and a soft tone (as found in our subject HJ), but can also be seen in a large vocal fold vibratory amplitude and an acoustic output with almost the same energy as utterances of phonation type 2, as produced by subject CH. As far as phonation types 2, 3 and 4 are concerned, there is some degree of agreement between CQEGG and CQKYM data. Criterion-level methods with a threshold of 0.2 and 0.25 match the kymographic data best. Other methods tend to follow with a certain offset the trend that the CQKYM data shows with regards to phonation type. The DEGG SINGLE methods did, if at all, return values that are lower than those derived from the videokymographic signal. This was unexpected, since the comparison of high-speed films and EGG signals indicated that glottal closure and opening occur at the peaks of the first derivative of the EGG signal (Baer et al., 1983; Childers et al., 1983; Henrich et al., 2004). The discrepancy might be due to errors in the computation of the CQKYM data: • The position of the videokymographic scan line might have been improperly chosen, allowing for zipper-like opening or closure to influence the retrieved results. A post-hoc examination of videostroboscopic data of typical samples for each phonation type, as produced by each subject, revealed that CH had a zipper-like opening in phonation types 2, 3 and 4. The anterior portion initiated the opening, followed by the posterior portion. However, the initial opening took place at exactly the region where we aligned the videokymographic scan line, so the detected zipper-like opening does in this particular case not resemble an obstacle for correct data acquisition. • Since the extraction and calculation of the CQKYM data has been performed manually, we must consider the introduction of human errors. To minimize possible errors, portions of the data have been calculated again after several days, and no significant disagreements have been found. Special cases, where determination of opening and closing events was difficult, have received special attention and were discussed with a VKG expert (Jan Švec). • Videokymograpy produces data at a sampling rate of ca. 8 kHz. Considering that the average F0 of the phonations was around 295 Hz, an error of one sample results in change in CQKYM value of 0.036. The same argument, however, applies to high-speed filming, where the sampling rates are generally between 2 and 10 kHz. • The spatial resolution of the videokymographic images was worse than expected. The maximum glottal width encountered was covered by an area of no more than 25 pixels. Depending on vocal fold vibration amplitude, in some extreme cases the entire glottal width was covered by no more than 5 to 8 pixels. Aliasing and blurring also played a considerable role in decreasing the reliability of the results. More advanced image processing with a better resolution in the spatial domain, such as high-speed imaging, would improve the data reliability. Additionally, it might be possible that our subjects do not represent 'normal' voices, and that the number of subjects was too small.
Herbst                    Evaluation of Various Methods to Calculate the EGG Contact Quotient       27

However, under the assumption that the aforementioned issues do not have an impact on the
validity of our data, there are a couple of considerations that should be taken into account when
trying to understand the discrepancy in CQKYM and CQEGG data:

• Defining exact and distinct events of contacting and de-contacting can be problematic.
  Vertical phase differences in the vocal fold movement and zipper-like closure have a strong
  influence. In the case of incomplete closure, as it can occur in falsetto or pianissimo
  phonation, and also in phonations of (especially adolescent) female voices, the concept of
  'closure' can not be applied at all. Finally, artefacts in the EGG signal caused by low
  frequency noise (introduced e.g. by tongue or vertical laryngeal movement), strands of
  mucus across the vocal folds, and of course all kinds of vocal fold pathologies, might
  introduce slight (or even coarse) changes in the EGG wave form. It appears that all those
  issues might act as sources of errors in calculating the EGG contact quotient. In addition,
  choosing the right method to determine the (de)contacting events once it can be assumed
  that the EGG signal does indeed convey them in a proper form, does seem to be even more
  difficult a task.
• The difference between CQKYM and the CQEGG as calculated by the DEGG SINGLE, DEGG
  AVG and DEGG MAX methods might be due to the presence of a mucosal wave, which we
  not only found in both types of chest (phonation types 3 and 4), but also in phonation type 2
  utterances (falsetto, much adduction) in both our subjects. Such a mucosal wave could
  cause the maximal change in vocal fold contact area to happen after initiated closure and
  before initiated opening. This would reduce the duration of the 'contact phase', as related to
  the 'closed phase'. However, we must point out that this is only an assumption, and with the
  data collected in this experiment we can not produce enough evidence to prove this.
• Based on our data, we were not able to solve the question whether the EGG (de)contacting
  events, as determined by whatever method, do indeed represent the closing and opening
  events during a glottal cycle. A main obstacle was the fact that our experimental setup did
  not allow for an exact synchronisation of the EGG signal and the videokymographic data. On
  top of that, we may not conclude that because the CQEGG data as calculated by criterion-level
  methods with a threshold of 20 or 25 % did match the calculated CQKYM data, these methods
  do indeed succeed in exactly determining the (de)contacting events as correlates for glottal
  opening and closure. Our data does not support such an assumption, and the coincidence of
  values might have occurred by chance. However, as long as there is no proven correlation
  between EGG (de)contacting events and glottal opening and closure, we do not know exactly
  what information the CQEGG conveys, which is a huge constraint for the applicability and
  usability of this parameter.
• The concept of the contacting and de-contacting events in the EGG signal is somewhat
  construed, motivated by the desire to calculate the EGG signal duty cycle and thus the EGG
  contact quotient. A possibility would be to abandon the concept of (de)contacting events in
  favour of (de)contacting 'regions', over which the opening and closure of the vocal folds take
  place. At this point we are not able to provide a model that covers that theory, but from what
  has been elaborated we conclude that it can not be assumed that the CQEGG is an exact
  measure having an perfect physiological correlate in vocal fold movement behaviour. A
  certain amount of error in CQEGG value has therefore always to be taken into account, if one
  chooses to employ the CQEGG at all.
Herbst                     Evaluation of Various Methods to Calculate the EGG Contact Quotient        28

5. CONCLUSIONS

Based on the considerations above, we arrive at the following conclusions:

•   The electroglottographic signal representing type 1 phonations (falsetto with little adduction)
    is not suitable for CQEGG calculation.
•   The various methods for calculating the CQEGG lead to different results. Criterion-level
    methods with thresholds of 0.2 or 0.25 might be most appropriate to calculate the EGG
    contact quotient, at least when analyzing male voices.
•   The concept of contacting and de-contacting events in the EGG signal, and hence the EGG
    contact quotient itself, might be misleading, since the (de)contacting events in the EGG
    signal might not resemble the incidents of glottal closure and opening. Thus, we prefer to
    speak of contacting and de-contacting 'regions' in the EGG signal, and we assume that no
    exact EGG contact quotient can be calculated, until proven differently.
•   To underline the aforementioned fact, we prefer to speak of the 'relative EGG contact
    quotient' instead of the 'EGG contact quotient' or the 'EGG closed quotient'. When calculating
    the relative EGG contact quotient, the calculation method should always be indicated, to be
    able to compare results.
•   The relative EGG contact quotient is sensitive to trends in registration, since a change from
    falsetto to chest and a change from little to much adduction results in an increase of the
    contact quotient value, at least at an intra-subject level.
Herbst Evaluation of Various Methods to Calculate the EGG Contact Quotient 29 6. ACKNOWLEDGEMENTS We are mostly indebted to Jan Švec for his invaluable help in obtaining the videostroboscopic and videokymographic images and his aid in establishing a method to manually compute the CQKYM. Jan Švec’s work at the Department of Speech, Music and Hearing; Royal Institute of Technology was supported by an individual grant from the Wenner-Gren Foundation in Stockholm. We want to express out sincere thanks to Hans Larsson and all the other staff at the Department of Logopedics and Phoniatrics, Karolinska Institute, Huddinge University Hospital, Stockholm, for their help in acquiring the videostroboscopic and videokymographic data, and for letting us use their facilities. Our thanks go to Dr. Josef Schlömicher-Thier, Austrian Voice Institute, for letting us use his facilities to capture the electroglottographic data for the pilot study. Thanks go to Paul Boersma for sharing the source code of the auto-correlation pitch detection algorithm. Finally, we want to thank our subjects who participated in the study.
Herbst                   Evaluation of Various Methods to Calculate the EGG Contact Quotient       30

7. REFERENCES

  T.Baer, A.Löfqvist, and N.S.McGarr. "Laryngeal vibrations: A comparison between high-
  speed filming and glottographic techniques." JASA 73, no. 4(1983):1304-08.

  R.J.Baken. "Electroglottography." Journal of Voice 6, no. 2(1992):98-110.

  R.J.Baken and R.F.Orlikoff. "Correlates of Vocal Fold Motion: Electroglottography." In
  “Clinical Measurement of Speech and Voice”, pp. 413-427. Singular / Thompson Learning,
  2000.

  S.V.Batty, D.M.Howard, P.E.Garner, P.Turner, and A.D.White. "Clinical pilot study
  assessment of a portable real-time voice analyser." Log Phon Vocol 2002, no. 27(2002):59-
  62.

  P.Boersma. "Accurate short-term analysis of the fundamental frequency and the harmonics-
  to-noise ratio of a sampled sound." pp. 97-110. 1993.

  D.G.Childers, J.M.Naik, J.N.Larar, A.K.Krishnamurthy, and G.P.Moore. "Electroglottography,
  speech, and ultra-high speed cinematography." In “Vocal Fold Physiology and Biophysics of
  Voice”, eds., I.R.Titze and R.Scherer, pp. 202-220. Denver: Denver Center of Performing
  Arts, 1983.

  D.G.Childers, D.M.Hicks, G.P.Moore, and Y.A.Alsaka. "A model for vocal fold vibratory
  motion, contact area, and the electroglottogram." JASA 80, no. 5(1986):1309-20.

  R.H.Colton and E.G.Conture. "Problems and Pitfalls in Electroglottography." Journal of Voice
  4, no. 1(1990):10-24.

  P.Fabre. "Une perocédé électrique d'inscription de l'accolement glottique au course de la
  phonation: Glottographie de haute fréquence." Bulletin de l'Académie Nationale de Médicine
  1957 141,(1957):66-69.

  P.E.Garner and D.M.Howard. "Real-time display of voice source characteristics." Log Phon
  Vocol 1999, no. 24(1999):19-25.

  T.Hacki. "Electroglottographic Quasi-Open Quotient and Amplitude in Crescendo Phonation."
  Journal of Voice 10, no. 4(1996):342-47.

  N.Henrich, C.d'Alessandro, B.Doval, and M.Castellengo. "On the use of the derivative of
  electroglottographic signals for characterization of nonpathological phonation." JASA 115, no.
  3(2004):1321-32.

  H.Hollien, J.Michel, and E.T.Doherty. "A method for analyzing vocal jitter in sustained
  phonation." Journal of Phonetics 1973, no. 1(1973):85-91.

  D.M.Howard and B.Allen. "Toward the quantification of vocal efficiency." Journal of Voice
  4,(1990):205-12.

  D.M.Howard. "Variation of Electrolaryngographically Derived Closed Quotient for Trained and
  Untrained Adult Female Singers." Log Phon Vocol 9, no. 2(1995):163-72.
You can also read