FLOOD INUNDATION SIMULATIONS BASED ON GSMAP SATELLITE RAINFALL DATA IN JAKARTA, INDONESIA
←
→
Page content transcription
If your browser does not render page correctly, please read the page content below
Priyambodoho et al. Progress in Earth and Planetary Science                (2021) 8:34
https://doi.org/10.1186/s40645-021-00425-8
                                                                                                                                 Progress in Earth and
                                                                                                                                    Planetary Science

 RESEARCH ARTICLE                                                                                                                                  Open Access

Flood inundation simulations based on
GSMaP satellite rainfall data in Jakarta,
Indonesia
Bambang Adhi Priyambodoho1, Shuichi Kure2* , Ryuusei Yagi1 and Nurul Fajar Januriyadi3

  Abstract
  Jakarta is the capital of Indonesia and is considered one of the most vulnerable cities to climate-related disasters,
  including flooding, sea-level rise, and storm surges. Therefore, the development of a flood-forecasting system for
  Jakarta is crucial. However, the accurate prediction of flooding in Jakarta is challenging because of the short flood
  concentration time in highly urbanized basins and the shortage of rainfall data in poorly gauged areas. The aim of
  this study is to simulate recent flood inundation using global satellite mapping of precipitation (GSMaP) products.
  The GSMaP products (NRT and Gauge V7) were evaluated and compared with hourly observation data from five
  ground stations in the Ciliwung River Basin. In addition, a rainfall-runoff and flood inundation model was applied to
  the target basin. The results of the analysis showed that the GSMaP Gauge data were more accurate than the
  GSMaP NRT data. However, the GSMaP Gauge cannot be used to provide real-time rainfall data and is, therefore,
  inadequate for real-time flood forecasting. We conclude that the GSMaP Gauge is suitable for replicating past flood
  events, but it is challenging to use the GSMaP NRT for real-time flood forecasting in Jakarta.
  Keywords: GSMaP, Flood inundation simulation, Rainfall-runoff simulation, Jakarta, Indonesia, Chiliwung River

1 Introduction                                                                        remaining 20.4%. According to Bricker et al. (2014), the
Jakarta is considered to be one of the most vulnerable                                reduced capacity of the drainage system generated by
cities in the world to climate-related disasters, such as                             trash-clogging flood gates is a factor that causes flood-
flooding, sea-level rise, and storm surges (Firman et al.                             ing. Budiyono et al. (2016) and Januriyadi et al. (2018)
2011). Jakarta has experienced several flood disasters in                             reported that climate change in the future would in-
the past, including in 1996, 2002, 2007, 2013, and 2020.                              crease flood risk in Jakarta.
These floods not only led to severe economic damage                                      In these flood-prone situations, several countermea-
but also human casualties (Kure et al. 2014).                                         sures have been implemented in Jakarta to mitigate flood
   Several studies related to flood problems in Jakarta                               damages, such as dredging and diversion tunnels. How-
have been conducted. Moe et al. (2016) applied a                                      ever, flood risk in Jakarta is still high, and more than 60
rainfall-runoff and flood inundation model to the 2013                                people were killed in Jakarta during the most recent
flood event and concluded that a shortage of capacity in                              flood event that occurred in January 2020 (Berlinger and
the lower Ciliwung and other rivers accounted for 79.6%                               Yee 2020). Thus, a flood-forecasting system is required
of the total flood inundation volume in Jakarta, with                                 in Jakarta to ensure early evacuation and prevent traffic
urbanization and land subsidence accounting for the                                   jams during flood disasters. Nevertheless, the develop-
                                                                                      ment of a flood-forecasting system in Jakarta is a chal-
                                                                                      lenging task because the rapid flooding of rivers and
* Correspondence: kure@pu-toyama.ac.jp
2                                                                                     canals will not provide sufficient lead time for a predic-
 Department of Environmental and Civil Engineering, Toyama Prefectural
University, 5180 Kurokawa Imizu, Toyama 939-0398, Japan                               tion based on the water levels in the upstream regions
Full list of author information is available at the end of the article

                                      © The Author(s). 2021 Open Access This article is licensed under a Creative Commons Attribution 4.0 International License,
                                      which permits use, sharing, adaptation, distribution and reproduction in any medium or format, as long as you give
                                      appropriate credit to the original author(s) and the source, provide a link to the Creative Commons licence, and indicate if
                                      changes were made. The images or other third party material in this article are included in the article's Creative Commons
                                      licence, unless indicated otherwise in a credit line to the material. If material is not included in the article's Creative Commons
                                      licence and your intended use is not permitted by statutory regulation or exceeds the permitted use, you will need to obtain
                                      permission directly from the copyright holder. To view a copy of this licence, visit http://creativecommons.org/licenses/by/4.0/.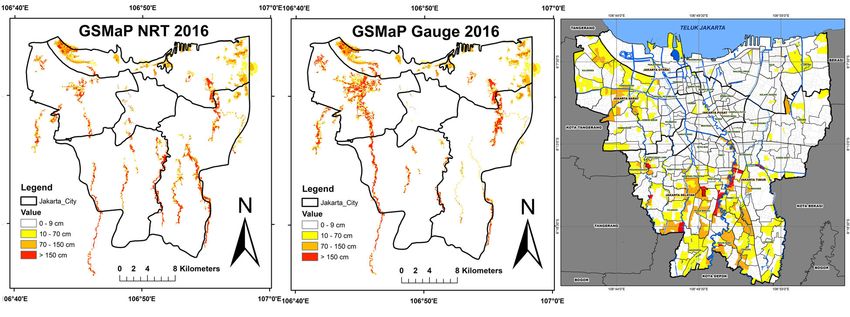
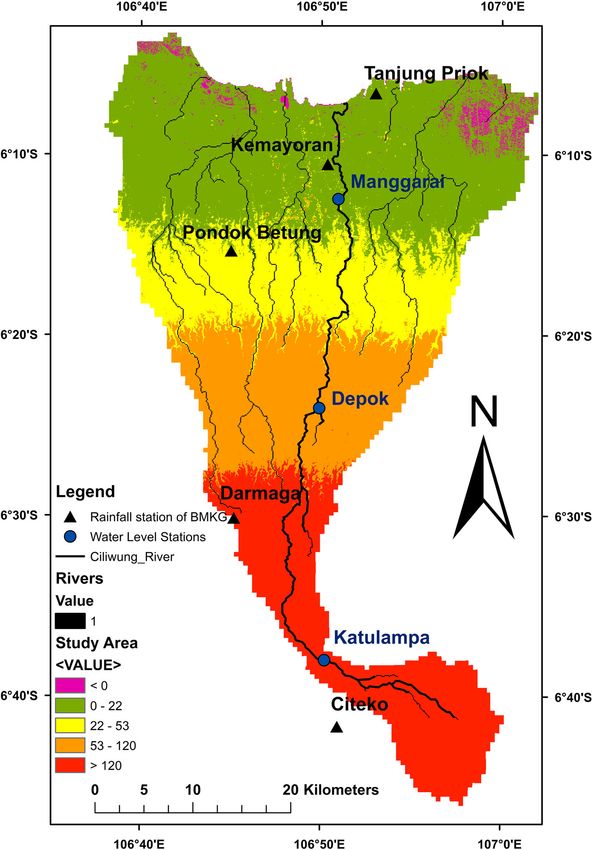
Priyambodoho et al. Progress in Earth and Planetary Science   (2021) 8:34                                              Page 2 of 17

(Miyamoto et al. 2012). In addition, the shortage of rain-            were reported in a previous study (Admojo et al. 2018).
fall data, such as radar rainfall and ground gauge data,              To improve the flood simulation results based on satellite
results in uncertainty and low accuracy in predicting                 data, bias correction (Sayama et al. 2012) of satellite rain-
flood hydrographs and inundations based on hydrologic                 fall products, and ensemble flood simulation methods
models owing to insufficient rainfall input accuracy,                 (Jiang et al. 2014) have been successfully used for flood
model calibrations, and data assimilation opportunities               simulations in large-scale basins. Sayama et al. (2012) ap-
(Kure et al. 2013).                                                   plied a hydrological model with a bias-corrected GSMaP
   In this study, we analyzed whether satellite rainfall              for flood inundation simulation in Pakistan to provide
data can be used as an input for real-time flood forecast-            additional information for flood relief operations. The
ing in Jakarta because of the discontinuation of rainfall             simulated flood inundation area reasonably matched well
radars in 2013 owing to high maintenance costs. Various               (the fit index: 0.61, peak discharge ratio: 1.0, and inun-
satellite rainfall products can be accessed and down-                 dated area ratio: 1.0) with the actual area, even though the
loaded freely, and the data are provided in near real-                satellite rainfall products were used as the input for the
time worldwide. We used global satellite mapping of                   simulation.
precipitation (GSMaP) products as the satellite rainfall                 These literature reviews indicate that the accuracy of
data in this study because of their high spatial and tem-             GSMaP data should be verified for several cities and re-
poral resolutions suitable for flood simulations in highly            gions before being used in practice. In several studies,
urbanized areas. GSMaP products have been evaluated                   hydrological models were applied with satellite rainfall
and verified through comparison with observational data               data to large basins, where the flood travel time is rela-
from several previous studies.                                        tively slow (Sayama et al. 2012). However, GSMaP evalu-
   Based on a verification study of hourly GSMaP rainfall             ation investigations of highly urbanized cities prone to
conducted by Setiawati and Miura (2016), GSMaP-MVK                    rapid flooding in rivers and subjected to local convective
data can potentially be used to replace rain gauge data,              rainfall owing to urban heat environments or humid
particularly for lowland areas in the Kyusyu region,                  tropical climates have not been conducted in detail.
Japan, if inconsistencies and errors are resolved. How-                  The main objective of this study is to investigate a
ever, without bias correction, significant underestimation            satellite-based rainfall product for flood inundation
or overestimation of heavy rainfall events will be ob-                modeling of a flood event in Jakarta, a mega Asian city
served. Moreover, the former algorithm of the GSMaP                   located in a humid tropical region. Satellite-based rainfall
microwave radiometer does not consider topographical                  can be used to reconstruct historical flood events. A prob-
effects (Setiawati and Miura 2016). Other researchers                 lem faced by developing countries is the evaluation of
have also reported an underestimation via the GSMaP                   historical flood events with insufficient survey and hydro-
(Fu et al. 2011; Admojo et al. 2018; Pakoksung and                    logical observation data. Thus, GSMaP data were also eval-
Takagi 2016). Fu et al. (2011) evaluated the accuracy of              uated in this study as input rainfall data to simulate the
the GSMaP using a gauge station in a basin in China                   historical flood events in Jakarta, including the most recent
and found that GSMaP products generally underesti-                    large-flood event that occurred in January 2020.
mated the precipitation amount. Additionally, GSMaP
rainfall data are less accurate when used for mountain-               2 Study area
ous regions than flat areas owing to the occurrence of                Jakarta is the capital of Indonesia and is located on the
topographical rainfall (Fu et al. 2011). Conversely, Tian             northwest coast of Java island. Jakarta is the largest
et al. (2010) reported that satellite products (e.g.,                 metropolitan city in Indonesia, and its development is
GSMaP) overestimate rainfall in the summer based on                   progressing rapidly.
the estimations over the contiguous United States.                      The rainy season in Jakarta begins in November and
   Hence, GSMaP rainfall products provide less accurate               ends in March, and peak rainfall intensity often occurs
results compared with gauge-based rainfall networks or                in January and February. Thirteen main rivers flow
radar rainfall information systems. Nevertheless, GSMaP               through the region, with the Ciliwung River being the
rainfall products are often used as inputs for hydro-                 longest. The area selected for this study included Jakarta
logical models in simulating flood events. Admojo et al.              and the surrounding river basins, which cover a total of
(2018) and Pakoksung and Takagi (2016) statistically                  1346.6 km2 (Fig. 1). It should be emphasized that Jakarta
evaluated satellite rainfall products, including the                  is a highly urbanized area with complex urban systems
GSMaP, and applied hydrological simulations to a large                of river channels and canals, buildings, and roads. Thus,
river basin in Thailand using satellite data. They showed             the flood concentration time is relatively short (approxi-
acceptable model results (high correlation coefficient:               mately 12–16 h), which creates problems regarding the
0.85) to simulate the observed discharge in a river basin,            use of warning systems, evacuation, and the prevention
but underestimations (NSE = 0.37) of simulated runoff                 of traffic congestion.
Priyambodoho et al. Progress in Earth and Planetary Science   (2021) 8:34                                            Page 3 of 17

 Fig. 1 Study area

  Almost every year, Jakarta experiences flooding in                  occurred, and the city’s financial core, including the
January, February, or both, owing to high rainfall with               president’s palace, was inundated, which led to the death
insufficient capacity flows in the drainage system. The               of 41 people. In 2020, at least 67 people were killed, and
details of the floods and damage are listed in Table 1. In            60,000 were displaced in the worst flooding that has
Table 1, the damage cost and main damages were ob-                    occurred in the area since 2007.
tained from several sources, such as web online news
and several reports, and the values of the rainfall, water            3 Methods
level, and flooded area were obtained from the observed               3.1 Dataset
data. In the 2013 flood event, the failure of an embank-              For the rainfall-runoff and flood inundation simulation,
ment on the west drainage canal at Laturharhari                       the following data were used. A digital elevation model
Priyambodoho et al. Progress in Earth and Planetary Science         (2021) 8:34                                                Page 4 of 17

Table 1 Summary of historical flood events
Year    Averaged rainfall    Maximum water level (cm)         Flood area      Death person   Main damage                      Damage Cost
        (mm)                 at Manggarai                     (km2)                                                           (IDR)
1996    421                  970                              -               10             529 houses were highly damaged   6.4 Trillion
2002    464                  1050                             160             32             Electrical System Shutdown       9.9 Trillion
2007    340                  1060                             397             80             Electrical System Shutdown       8.8 Trillion
2013    168                  1020                             132             41             Embankment failure               1.5 Trillion
2014    581                  830                              201             26             134,662 persons were affected    5 Trillion
2015    310                  890                              196             5              Electrical System Shutdown       1.5 Trillion
2016    275                  580                              152             2              -                                3 Trillion
2017    322                  700                              139             6              1,178 houses were inundated      147 Billion
2018    346                  775                              79              1              42 houses were highly damaged    150 Billion
2019    154                  890                              84              2              -                                100 Billion
2020    196                  965                              150             67             Electical System Shutdown        1 Trillion

data set of the Shuttle Radar Topography Mission having                     the GSMaP Gauge can be used for reconstructing past
a 30 m resolution was used in this study. The river                         flood events. The simulated data were compared with
cross-sectional and drainage system data for the Ciliwung                   ground observation data.
River recorded in 2011 were obtained from the project au-
thority of the Japan International Cooperation Agency.                      3.3 Ground observation rainfall data
Water level and river flow discharge data for the Ciliwung                  Hourly rainfall data were obtained for the target area
River and a flood inundation map of Jakarta were provided                   from Badan Meteorologi, Klimatologi dan Geofisika
by Badan Penanganan Bencana Daerah (Jakarta Disaster                        (Indonesian Agency for Meteorology, Climatology, and
Management Agency).                                                         Geophysics). We evaluated the uncertainties in the
                                                                            hourly satellite rainfall data from the Citeko, Darmaga,
3.2 Satellite rainfall products                                             Pondok Betung, Kemayoran, and Tanjung Priok stations.
The GSMaP project was implemented in 2002 to de-                            The locations of the stations are shown in Fig. 1. Table 1
velop retrieval algorithms for rainfall rates and to pro-                   shows the total rainfall values at the stations during
duce high-resolution global precipitation maps based on                     flood events. Then, the satellite product rainfall data for
satellite data (Ushio et al. 2009; Aonashi and Liu 2000).                   January and February of 2015–2020 were obtained from
GSMaP products are distributed by the Japan Aerospace                       both GSMaP NRT and GSMaP Gauge data.
Exploration Agency (JAXA) Global Rainfall Watch.
GSMaP Now, GSMaP NRT, and GSMaP MVK are pro-                                3.4 Flood inundation model
vided by JAXA.                                                              As mentioned earlier, we modeled the flood inundation
  GSMaP Now only allows the extrapolation of rain-                          in Jakarta based on rainfall-runoff (Kure and Yamada
fall maps every 30 min; therefore, the accuracy of the                      2004; Kure et al. 2008) and flood inundation modeling
data may be relatively low. Moreover, it only provides                      (Moe et al. 2017). The flood inundation model com-
data for 2017, 2018, and 2019. GSMaP MVK is a re-                           prised a rainfall-runoff module for each sub-basin, a
analysis version of GSMaP NRT and has a resolution                          hydrodynamic module for the rivers and canal networks,
of 0.1°/h with a domain coverage from 60° N to 60°                          and a flood inundation module for the flood plains.
S. It was available from March 2000 until December                            For the rainfall-runoff simulation, the lumped rainfall-
2010. GSMaP NRT uses the same algorithm as                                  runoff model used by Kure and Yamada (2004) and Kure
GSMaP MVK, and it has been available since October                          et al. (2008) was applied to each sub-basin because this
2008. GSMaP NRT is released every hour (4 h la-                             model can be used to simulate the Horton overland flow
tency), and a Kalman filter algorithm is applied to the                     in urban areas, as well as subsurface and saturation over-
data (Ushio et al. 2009). GSMaP Gauge V7 is a cali-                         land flow in mountainous areas. These flows depend on
brated version based on the ground gauge data and                           the relationship between the soil and geological charac-
yields high accuracy. Its data have been available                          teristics and the intensity of rainfall on hill slopes.
since March 2014.                                                             Saint-Venant equations for the conservation of con-
  In this study, we evaluated the data using GSMaP                          tinuity and momentum were applied to connect runoffs
NRT and GSMaP Gauge V7. GSMaP NRT can be used                               from each sub-basin and conduct river flood routing as
as the input for a real-time flood-forecasting system, and                  the distributed model in the river channels and drainage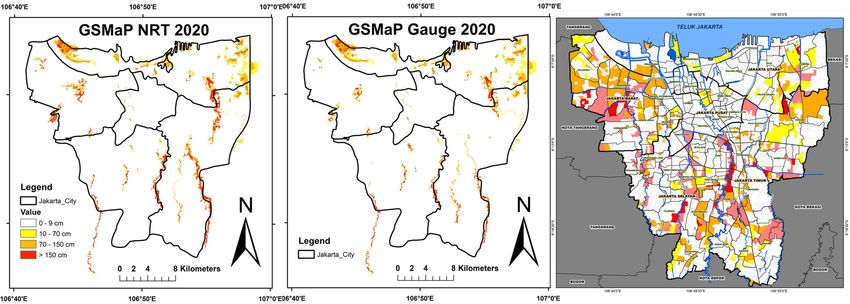
Table 2 Evaluation index of rainfall comparisons
Period     Location/       Observed   Altitude   GSMaP NRT                                                         GSMaP Gauge
           coverage        Rainfall   (m)
                                                 Volume   Total    Hourly Rainfall         Daily Rainfall          Volume   Total    Hourly Rainfall         Daily Rainfall
           area            (mm)
                                                 Bias     Rainfall                                                 Bias     Rainfall
                                                                   Correlation       RMSE Correlation       RMSE                     Correlation       RMSE Correlation       RMSE
                                                 (%)      (mm)     coefficients      (mm) coefficients      (mm) (%)        (mm)     coefficients      (mm) coefficients      (mm)
                                                                   (CCs)                  (CCs)                                      (CCs)                  (CCs)
Event      Citeko          160        920        -34      107      0.07              4     0.04             24     81       290      0.10              5     0.28             49
2015
           Darmaga         206        190        -52      98       0.05              5     -0.45            42     17       240      -0.08             5     -0.34            58
           Pondok          156        50         24       193      -0.03             10    -0.28            60     127      353      -0.03             11    -0.18            84
           Betung
           Kemayoran       505        4          -61      196      0.47              9     0.92             66     -44      282      0.44              8     0.91             55
           Tanjung Priok   425        2          -54      196      0.45              9     0.82             74     -41      250      0.40              9     0.90             63
           Basin           283                   -46      150      0.53              4     0.69             34     12       310      0.55              4     0.79             28
           Averaged
Event      Citeko          176        920        8        189      0.01              3     -0.12            22     52       268      0.01              3     -0.25            31
2016
                                                                                                                                                                                     Priyambodoho et al. Progress in Earth and Planetary Science

           Darmaga         126        190        31       165      -0.01             6     -0.30            36     114      270      -0.04             6     -0.34            43
           Pondok          104        50         90       198      -0.02             3     0.15             29     180      292      -0.05             4     -0.01            41
           Betung
           Kemayoran       178        4          94       346      0.35              5     0.81             28     53       273      0.43              4     0.43             33
           Tanjung Priok   256        2          37       350      0.20              5     0.84             22     -3       248      0.39              4     0.96             14
                                                                                                                                                                                     (2021) 8:34

           Basin           172                   83       316      0.16              3     0.49             30     59       275      0.15              2     0.47             24
           Averaged
Event      Citeko          361        920        -24      273      0.02              4     -0.34            34     -6       338      -0.06             4     -0.19            32
2017
           Darmaga         146        190        -100     282      -0.03             4     -0.17            34     129      333      -0.03             4     -0.25            31
           Pondok          111        50         121      246      0.00              3     0.04             20     203      336      -0.02             3     0.03             27
           Betung
           Kemayoran       233        4          -9       212      0.09              3     -0.08            20     27       295      0.17              3     0.27             19
           Tanjung Priok   543        2          -53      253      0.04              6     0.19             45     -46      292      0.01              6     -0.32            52
           Basin           228                   14       260      -0.02             3     -0.37            28     41       322      0.005             3     -0.21            33
           Averaged
Event      Citeko          497        920        -84      80       -0.01             6     0.09             60     -46      268      0.00              6     0.29             53
2018
           Darmaga         258        190        -73      69       -0.04             4     -0.37            28     71       440      0.05              4     0.17             41
           Pondok          143        50         -39      87       0.02              3     0.07             12     101      290      0.00              3     0.07             19
           Betung
           Kemayoran       213        4          -53      100      0.18              1     0.30             7      19       253      0.21              2     0.53             19
           Tanjung Priok   213        2          -28      154      -0.04             3     0.61             11     17       250      -0.04             3     0.29             15
           Basin           188                   -49      96       -0.03             2     -0.02            15     74       325      0.07              2     0.35             23
           Averaged
                                                                                                                                                                                     Page 5 of 17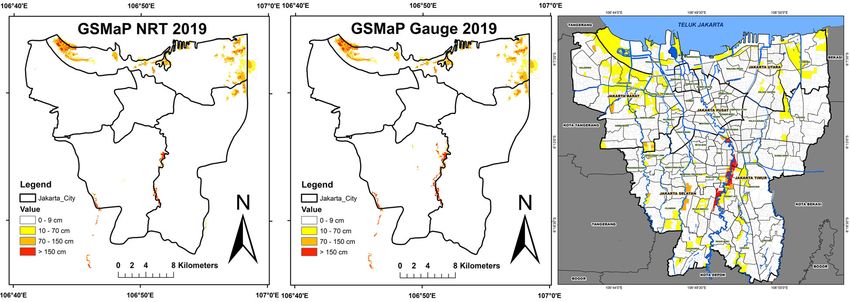
Table 2 Evaluation index of rainfall comparisons (Continued)
Period     Location/       Observed   Altitude   GSMaP NRT                                                         GSMaP Gauge
           coverage        Rainfall   (m)
                                                 Volume   Total    Hourly Rainfall         Daily Rainfall          Volume   Total    Hourly Rainfall         Daily Rainfall
           area            (mm)
                                                 Bias     Rainfall                                                 Bias     Rainfall
                                                                   Correlation       RMSE Correlation       RMSE                     Correlation       RMSE Correlation       RMSE
                                                 (%)      (mm)     coefficients      (mm) coefficients      (mm) (%)        (mm)     coefficients      (mm) coefficients      (mm)
                                                                   (CCs)                  (CCs)                                      (CCs)                  (CCs)
 Event     Citeko          1141       920        -81      217      -0.09             12    -0.10            122    -82      204      -0.10             12    0.46             116
2019
           Darmaga         174        190        28       222      -0.01             5     -0.14            26     25       216      0.00              4     -0.29            26
           Pondok          21         50         508      128      0.18              1     0.29             12     520      130      0.08              1     0.14             12
           Betung
           Kemayoran       151        4          -43      86       0.06              2     0.50             13     -13      132      0.08              2     0.50             16
           Tanjung Priok   186        2          -56      82       0.15              4     0.41             22     -32      126      0.29              3     0.44             20
           Basin           215                   -41      128      0.22              2     -0.05            15     -29      154      0.46              2     0.65             13
           Averaged
Event      Citeko          563        920        -68      181      0.12              10    0.52             80     -68      181      0.13              10    0.60             78
2020
                                                                                                                                                                                     Priyambodoho et al. Progress in Earth and Planetary Science

           Darmaga         230        190        -26      170      0.10              4     0.91             16     -20      183      -0.01             4     0.90             16
           Pondok          343        50         -23      265      0.23              9     0.98             23     -41      203      0.03              9     0.98             43
           Betung
           Kemayoran       445        4          -46      240      0.48              7     0.91             61     -62      169      0.50              7     0.99             68
           Tanjung Priok   424        2          -29      301      0.35              7     0.79             59     -63      156      0.51              7     0.92             69
                                                                                                                                                                                     (2021) 8:34

           Basin           310                   -19      244      -0.03             6     0.91             27     -36      196      0.11              6     0.99             24
           Averaged
                                                                                                                                                                                     Page 6 of 17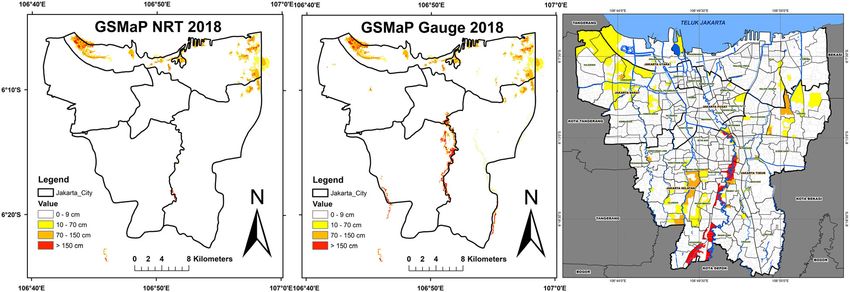
Priyambodoho et al. Progress in Earth and Planetary Science     (2021) 8:34                                              Page 7 of 17

 Fig. 2 Comparisons of hourly rainfall between GSMaP products (NRT & Gauge V7) and observation for flood event of 2015

 Fig. 3 Comparisons of daily rainfall between GSMaP products (NRT & Gauge V7) and observation for flood event in 2015
Priyambodoho et al. Progress in Earth and Planetary Science     (2021) 8:34                                                 Page 8 of 17

 Fig. 4 Comparisons of hourly rainfall between GSMaP products (NRT & gauge.v7) and observation for flood event of 2020

 Fig. 5 Comparisons of daily rainfall between the GSMaP products (NRT & Gauge V7) and observation for flood event of 2020
Priyambodoho et al. Progress in Earth and Planetary Science   (2021) 8:34                                                       Page 9 of 17

systems. Unsteady two-dimensional flow equations, i.e.,               Statistical validation methods, such as the root mean
the continuity and momentum equations, were numeric-                  square error (RMSE), correlation coefficients (CCs), and
ally solved for the flood inundation simulation of the                volume bias, were used as evaluation indexes; these were
flood plain.                                                          employed to evaluate the relationship between the
   The rainfall-runoff and flood inundation model were                GSMaP and observed rainfall data. The RMSE was used
applied to the 2013 flood event based on the radar rain-              to compare the magnitude of the error between the
fall data and were validated against the observations (see            GSMaP and observation data sets. CC represented the
Moe et al. 2016, 2017) for the calibrated parameters and              correlation between the data sets; its value ranged be-
details of the simulations.                                           tween zero and one. The volume bias (%) is the differ-
   In this study, flood observation data and flood inunda-            ence in the percentages of the total rainfall volume
tion simulations modeled using the GSMaP rainfall in-                 between the GSMaP and ground rainfall observation. It
put were compared.                                                    is calculated using the following equation: (100 ×
                                                                      ((GSMaP − Observation)/Observation)). For the flood
3.5 Target flood events                                               hydrograph comparisons, the Nash–Sutcliffe efficiency
Six yearly largest flood events from 2015 to 2020 were                index (NSE) was computed. The NSE values ranged
selected as the target in this study because both GSMaP               from minus infinity to 1, and an efficiency index of 1 in-
NRT and GSMaP Gauge data are available for these                      dicated a perfect match.
flood events. These events produced the highest water
levels at the stations in the Chiliwung river during these            4 Results
years. The event periods lasted for approximately a week              4.1 Rainfall comparison
in January or February.                                               Good performances on a daily scale with respect to the
                                                                      CCs and volume bias were observed for the 2015, 2019,
3.6 Evaluation index                                                  and 2020 events, as listed in Table 2. Figures 2 and 3
We compared the agreement of the GSMaP products                       show the hourly and daily comparisons, respectively, be-
and examined the rainfall data of the study area.                     tween the basin-averaged GSMaP and rainfall

 Fig. 6 Hydrograph comparisons for flood event of 2015                  Fig. 7 Hydrograph comparisons for flood event of 2016
Priyambodoho et al. Progress in Earth and Planetary Science (2021) 8:34 Page 10 of 17 observation data for the 2015 flood event. In this case, rainfall in the Pondok Betung station in the 2019 event we confirmed relatively strong correlations for the daily was 21 mm, which is too small compared with the values basin-averaged gauge rainfall, particularly for the GSMaP at other stations. The data quality of the rainfall stations Gauge and observation data (0.79 for the daily basin- during heavy rainfall events should be checked in averaged gauge rainfall). Figures 4 and 5 show the hourly Jakarta. and daily comparisons, respectively, between the average basin observation and GSMaP data for the 2020 flood event. It is noted that the observed rainfall in 2020 only 4.2 Flood hydrograph provides the data at 3 h intervals, so that hourly data We performed rainfall-runoff and flood inundation sim- was made from these 3 h intervals assuming uniform ulations at an hourly time step using the GSMaP rainfall time distributions at each hour. In this case, the best data as the input and compared the observed and simu- correlation existed (0.99, for the daily basin-averaged lated results. rainfall), but weak correlations could be confirmed on Figures 6, 7, 8, 9, 10, and 11 show the hydrographs for an hourly time scale. Table 2 summarizes the evaluation the observations at the Katulampa, Depok, and Man- index data. The values for the other years are listed in ggarai stations and the corresponding simulations for Table 2. The agreement of the GSMaP data was not very the 2015–2020 flood events. The locations of the sta- high (Table 2). Only weak correlations were found for tions are shown in Fig. 1. The simulated hydrographs the flood events from 2016 to 2018, both hourly and showed relatively good agreement with the observations daily. Overestimation of the GSMaP was observed for on an hourly time scale with respect to CCs (the average the 2016, 2017, and 2018 events except for the GSMaP CCs of the Gauge simulation is 0.53), but some underes- NRT in 2018, whereas slight underestimation was ob- timations and/or overestimations with respect to the served for the 2019 and 2020 events. It should be noted peak discharge bias (from 62 % to 134 % in the Gauge that the volume bias in the Pondok Betung station in simulations) occurred. For the Nash index, generally low 2019 showed an extremely large overestimation for both performance was confirmed, except for the 2019 and hourly and daily scales. This is because the observed 2020 events. Fig. 8 Hydrograph comparisons for flood event of 2017 Fig. 9 Hydrograph comparisons for flood event of 2018
Priyambodoho et al. Progress in Earth and Planetary Science   (2021) 8:34                                                    Page 11 of 17

                                                                        Fig. 11 Hydrograph comparisons for flood event of 2020
 Fig. 10 Hydrograph comparisons for flood event of 2019

  For the 2015 flood event (Fig. 6), flood peak discharges            NRT captured the rainfall well in the 2018 rainy sea-
were captured through GSMaP Gauge simulations at the                  son, except during this flood event. One possibility of
Katulanmpa and Depok stations, but apparent peak time                 this underestimation might be due to shallow oro-
and volume differences were observed. These differences               graphic rainfall, because large rainfall observation
in the flood event resulted in the worst Nash index                   values at high elevations can clearly be observed in
values of all events, although the hourly rainfall correla-           this event, as shown in Table 2. This type of rainfall
tions in Fig. 2 performed well, as discussed in the previ-            may still be difficult to capture by the satellite after a
ous sentences. At the Manggarai station, the GSMaP                    new orographic/non-orographic rainfall classification
Gauge simulation was overestimated in the peak dis-                   scheme was installed (Kubota et al. 2020). This will
charge compared with the observation. For 2016 and                    be discussed further in the discussion section.
2017 flood events (Figs. 7 and 8), several high flood-flow              For the 2019 flood event (Fig. 10), good CCs and
fluctuations were observed and simulated, but the simu-               Nash index values were observed in the gauge simula-
lated flood hydrograph occasionally overestimated and                 tion. The best Nash index values were confirmed for
underestimated the observations. The simulation results               the 2019 flood event. For the 2020 flood event (Fig.
of the GSMaP Gauge simulations for the 2018 event                     11), CCs show more than 0.6 in all stations for both
showed good correlations (Fig. 9) in CCs (0.64–0.73),                 the GSMaP NRT and gauge simulations. The rela-
good peak discharge biases (− 39–35%), and relatively                 tively acceptable Nash index values (0.15–0.54) were
acceptable Nash index values (0.38 and 0.39). The flood               observed, except at the Manggarai station. As such,
peak timing and values of the 2018 flood event were                   the 2019 and 2020 events show good flood simulation
accurately simulated, but the GSMaP NRT simula-                       results because these events show good daily rainfall
tions did not show any floods in the event. This is                   correlations and volume bias of the GSMaP Gauge
because significant underestimations of the rainfall of               data compared with the observations. The simulation
the GSMaP NRT during the event were found at all                      results for the hourly time scales are presented in
stations (Table 2 and Fig. 9), even though GSMaP                      Table 3. The peak bias (%), CCs, RMSE, and NSE
Priyambodoho et al. Progress in Earth and Planetary Science (2021) 8:34 Page 12 of 17
Table 3 Summary of discharge hydrograph comparison
Period Water GSMaP NRT GSMaP Gauge
Level
Peak Discharge Correlation Nash Index RMSE Peak Discharge Correlation Nash Index RMSE
station
Bias (%) coefficients (CCs) (m3/s) Bias (%) coefficients (CCs) (m3/s)
Event 2015 Katulampa -46 0.03 -0.36 3.15 0 0.52 -1.15 3.97
Depok -41 0.50 0.20 10.02 13 0.63 -0.80 15.02
Manggarai -19 0.53 -0.31 17.99 134 0.72 -2.39 28.92
Event 2016 Katulampa -13 0.14 0.31 4.30 -23 0.03 0.44 3.86
Depok -15 0.35 -0.36 11.74 -7 0.24 -0.40 11.92
Manggarai 122 0.49 -10.39 30.31 104 0.52 -5.18 22.32
Event 2017 Katulampa 190 -0.03 0.59 4.52 128 0.42 0.67 4.04
Depok 0 0.16 -1.35 14.65 36 0.39 -0.44 11.48
Manggarai 33 0.38 -0.78 16.85 76 0.39 -0.94 17.61
Event 2018 Katulampa -80 0.13 -0.45 9.83 35 0.69 0.39 6.41
Depok -80 0.21 -0.46 25.75 -39 0.64 0.38 16.75
Manggarai -42 0.20 -0.53 20.19 24 0.73 -0.18 17.76
Event 2019 Katulampa -19 0.35 0.57 4.71 -62 0.60 0.69 3.96
Depok -30 0.25 0.19 12.48 -52 0.60 0.43 10.49
Manggarai -5 0.36 -0.08 9.75 -28 0.49 -0.06 9.67
Event 2020 Katulampa 80 0.60 0.51 5.65 2 0.68 0.54 4.37
Depok 22 0.64 0.32 17.22 -19 0.60 0.15 19.25
Manggarai -25 0.64 -0.43 21.77 -50 0.62 -0.61 23.11
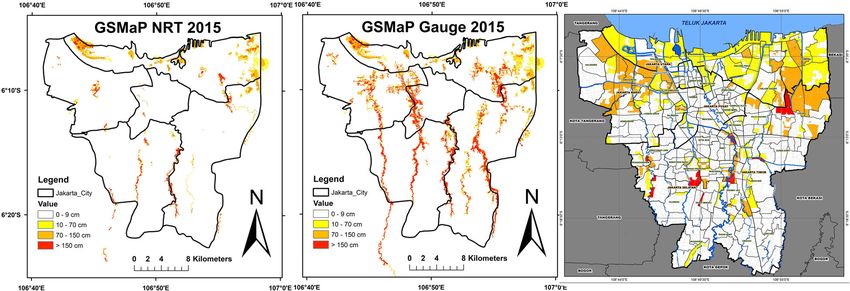
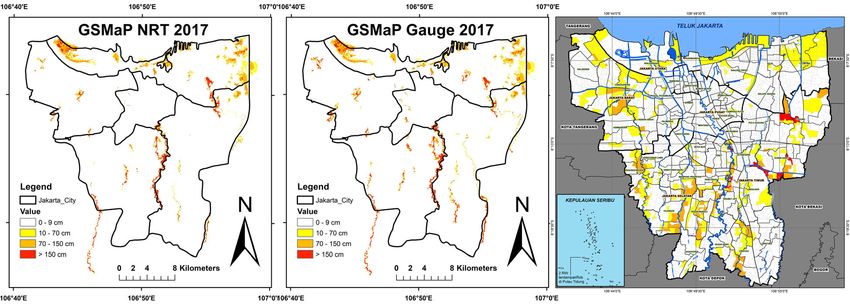
were computed (Table 3). From Table 3, it can be 4.3 Flood inundation
observed that the gauge simulations are better than The flood inundation conditions were also compared. Fig-
the NRT simulation, especially for the 2018 event. ures 12, 13, 14, 15, 16, and 17 show flood inundation maps
The gauge simulation results in Table 3 show that based on the simulation and observation data for 2015–
stations at higher altitudes show good RMSE and 2020 flood events. The observed flood inundation maps
NSE values because of the small catchment size and were provided by the National Disaster Management
sub-basin numbers and few opportunities to have un- Agency. These observation maps were based on eyewit-
certainty (Moriasi et al. 2007). Several NRT simula- ness reports of government officers during the flood
tions yielded negative NSE values, which signified that events and interviews with residents after the event. The
these simulations were not useful for flood prediction. observation maps tended to overestimate the inundation
Based on the comparison, GSMaP Gauge simulations area because the entire district in the map was treated as
were found to be significantly better than GSMaP NRT- the entire inundation when the flooding of a part of a dis-
based simulations. Significant underestimation of the trict was reported. The simulation of the flood inundation
GSMaP NRT simulation occurred compared with the results using the GSMaP Gauge showed relatively good
observation. GSMaP NRT data were designed as input consistency with the observations, particularly for 2017,
for the flood-forecasting simulations because these data 2018, 2019, and 2020. A slight overestimation of the flood
sets provided near real-time rainfall data. However, in inundation in some districts can be confirmed in 2015
terms of agreement, the GSMaP NRT data were unsuit- and 2016 due to overestimation of the flood hydrograph
able for the real-time forecasting of flooding in Jakarta, at some stations. The GSMaP NRT captured the
and significant bias corrections or modifications are re- flood inundation for 2015, 2016, and 2020 events but
quired to obtain more accurate simulation results. Fi- could not capture the inundation for 2018 due to sig-
nally, it should be emphasized that GSMaP Gauge nificant underestimations of the rainfall during the
simulations showed relatively good performance. These event. It is noted that these comparisons were made
results encourage us to use satellite-driven rainfall data by visual-graph comparisons because the observation
to reconstruct historical flood events in poorly gauged maps were not appropriate for use as a statistical test
basins and developing countries, even when the target because of the overestimation of the inundation area,
areas are highly urbanized. as explained in the above sentences.Priyambodoho et al. Progress in Earth and Planetary Science (2021) 8:34 Page 13 of 17
Fig. 12 Flood Inundation comparisons for flood event of 2015
From these results, we concluded that the GSMaP to orographic effects (Kubota et al. 2009, 2020). Over
Gauge data could be used to reproduce previous flood coastal mountain ranges, heavy rainfall can be caused by
inundation events in Jakarta. However, it is challenging shallow orographic rainfall, which is inconsistent with
to use GSMaP NRT data as the input in a real-time the assumption in the PMW algorithm that heavy rain-
flood-forecasting system owing to its low accuracy. fall results from deep clouds with significant ice (Kubota
et al. 2020). Therefore, a new orographic/non-orographic
5 Discussion rainfall classification scheme was installed in the PMW
Based on the comparison between gauge-based observa- algorithm in V6 for the TMI and V7 for all sensors
tions and satellite-based GSMaP rainfall data, we found (Kubota et al. 2020). From the analysis of the paper in
that the GSMaP NRT is not useful as an input for the Jakarta, we observed both the underestimation and over-
real-time flood-forecasting system in Jakarta. Several estimation of the GSMaP rainfall, and only the 2018
previous studies have shown that the GSMaP products rainfall event showed difficulty in capturing the rainfall
can capture the overall rainfall pattern (Kubota et al. in the high-altitude zones. Therefore, it might be in-
2009; Pakoksung and Takagi 2016) and could be useful ferred that the orographic effects on the quality of the
as inputs to hydrologic models to reproduce past flood GSMaP products in Jakarta are negligible. It should
events (Sayama et al. 2012). However, several studies (Fu be noted that it is difficult to capture the 2018 rain-
et al. 2011; Admojo et al. 2018; Pakoksung and Takagi fall event that showed clear orographic effects even
2016) have pointed out that the GSMaP products tended after the new scheme was installed. However, it is dif-
to be underestimated, and this underestimation was due ficult to draw any conclusions from only one case,
Fig. 13 Flood inundation comparisons for flood event of 2016Priyambodoho et al. Progress in Earth and Planetary Science (2021) 8:34 Page 14 of 17 Fig. 14 Flood inundation comparisons for flood event of 2017 and other atmospheric conditions, such as wind fields, timing of microwave observation from the satellite should be analyzed to understand the orographic rain- might be related to the low quality of GSMaP because fall effects in Jakarta. the local heavy rains regularly fall for short periods in Many reasons are attributed to the general difficulties Jakarta. in capturing heavy rainfall in Jakarta. First, Jakarta and Second, the flood travel time in Jakarta is short. Jakarta its surroundings are highly urbanized areas, and con- and its surrounding areas are highly urbanized, and the vectional rainfall typically occurs in urban areas of flood travel time in rivers and canals is approximately humid tropical regions. Additionally, the heat island 12–16 h. Local heavy rainfall should be captured hourly phenomenon is significantly progressing in Jakarta, and using the satellite to predict rapid floods. In previous there exists the urban thermal influence on the back- studies, the GSMaP was evaluated at large-scale basins ground environment of convective rainfall (Sugawara daily and monthly. This rapid flood response to rainfall et al. 2018). The rain retrieval algorithms may have er- is another challenge for GSMaP prediction in Jakarta. rors when applied to “warm rain” processes that are Some researchers applied a bias correction method typical of convectional rainfall in tropical regions for rainfall simulation using the GSMaP algorithm to (Chang et al. 2013). Thus, it might be difficult to pre- reduce the underestimation of rainfall intensity and dict and capture convectional rainfall in urban areas amount (e.g. Sayama et al. 2012). However, for using satellite information. This convection-type rain- Jakarta, the difficulties mentioned above complicate fall in an urban area may be a challenge for the accur- the application of bias correction because GSMaP ate prediction of rainfall in Jakarta. Furthermore, the simulations occasionally overestimated and/or Fig. 15 Flood inundation comparisons for flood event of 2018
Priyambodoho et al. Progress in Earth and Planetary Science     (2021) 8:34                                            Page 15 of 17

 Fig. 16 Flood inundation comparisons for flood event of 2019

underestimated the flood-flow discharge of the 2016                     rainfall data is a more viable option for forecasting sys-
and 2017 flood events. Moreover, the GSMaP NRT                          tems. It should be noted that the five rain gauge stations
simulations did not show any flood responses for the                    might be insufficient for capturing rainfall fields in
2018 event. In these situations, it is difficult to apply               Jakarta. Hence, radar observation systems should be in-
bias correction to the GSMaP NRT data. If we could                      stalled and operated properly to predict rainfall and flood
find any clear underestimation or overestimation                        events in Jakarta in real time, and denser rain gauge sta-
trend of the GSMaP against the ground observation, a                    tion networks would be required to calibrate and assimi-
bias correction method would work well to improve                       late the radar rainfall values based on the ground true
the simulation results (Saber and Yilmaz 2018).                         observation rainfall data.
  Multi-ensemble forecasting using several satellite                      GSMaP Gauge data might be useful for reconstruct-
rainfall products has been performed in previous                        ing and simulating historical flood events to evaluate
studies (Jiang et al. 2014). Other satellite rainfall                   and compare past floods in poorly gauged basins.
products such as TRMM(3B42RT) might be used as                          This is because the GSMaP Gauge can be used to ob-
the input for flood modeling in Jakarta as a multi-                     serve the heavy rainfall that occurred in the past.
ensemble forecasting. However, the temporal and
spatial resolutions of other satellite products are in-                 6 Conclusions
adequate for capturing local heavy rainfall in Jakarta.                 This study was conducted to examine the possibility of
Therefore, it is currently challenging to use GSMaP                     using GSMaP rainfall data as the input for real-time
as the input for real-time forecasting systems. Radar                   flood forecasting in Jakarta, Indonesia. The NRT and
information adjusted with ground gauge-based                            Gauge V7 products of the GSMaP were compared with

 Fig. 17 Flood inundation comparisons for flood event of 2020
Priyambodoho et al. Progress in Earth and Planetary Science                  (2021) 8:34                                                                  Page 16 of 17

ground observation rainfall data at several stations and                             Berlinger J, Yee I (2020) 66 people now killed by flooding in Jakarta, and more
basin averages formed around Jakarta. The results indi-                                   rain appears to be on the way. CNN World News https://edition.cnn.com/202
                                                                                          0/01/06/asia/jakarta-floods-intl-hnk/index.html. Accessed 1 Apr 2021.
cated that the GSMaP Gauge data showed acceptable                                    Bricker JD, Tsubaki R, Muhari A, Kure S (2014) Causes of the January 2013 canal
agreement in simulating the flood hydrograph and inun-                                    embankment failure and urban flood in Jakarta, Indonesia. J Japan Soc Civil
dation of Jakarta. However, the gauge data were unavail-                                  Eng Ser B1 (Hydraulic Engineering) 70:91–96
                                                                                     Budiyono Y, Aerts JCJH, Tollenaar D, Ward PJ (2016) River flood risk in Jakarta
able in real time and thus could not be used for real-                                    under scenarios of future change. Nat Hazards Earth Syst Sci 16(3):757–774.
time forecasting. The gauge data are suitable for repli-                                  https://doi.org/10.5194/nhess-16-757-2016
cating historical flood events that occur even in highly                             Chang L, Cheung K, Mcaneney J (2013) Case study of TRMM satellite rainfall
                                                                                          estimation for landfalling tropical cyclones: issues and challenges. Trop
urbanized areas.                                                                          Cyclone Res Rev 2(2):109
  The GSMaP NRT product, which provided near real-                                   Firman T, Surbakti IM, Idroes IC, Simarmata HA (2011) Potential climate-change
time rainfall data, was suitable for real-time flood fore-                                related vulnerabilities in Jakarta: challenges and current status. Habitat Int
                                                                                          35(2):372–378. https://doi.org/10.1016/j.habitatint.2010.11.011
casting. However, it is necessary to develop a significant                           Fu Q, Ruan R, Liu Y (2011) Accuracy assessment of Global Satellite Mapping of
bias correction method or change the algorithm of the                                     Precipitation (GSMaP) product over Poyang Lake Basin, China. Procedia
NRT data set adjusted for urban areas to improve the                                      Environ Sci 10:2265–2271. https://doi.org/10.1016/j.proenv.2011.09.354
                                                                                     Januriyadi NF, Kazama S, Moe IR, Kure S (2018) Evaluation of future flood risk in
accuracy of the simulation results.                                                       Asian megacities: a case study of Jakarta. Hydrological Res Lett 12(3):14–22.
                                                                                          https://doi.org/10.3178/hrl.12.14
Abbreviations
                                                                                     Jiang S, Ren L, Hong Y, Yang X, Ma M, Zhang Y, Yuan F (2014) Improvement of
GSMaP: Global satellite mapping of precipitation; RMSE: Root mean square
                                                                                          multi-satellite real-time precipitation products for ensemble streamflow
error; CCs: Correlation coefficients; NSE: Nash–Sutcliffe efficiency index
                                                                                          simulation in a middle latitude basin in South China. Water Resour Manag
                                                                                          28(8):2259–2278. https://doi.org/10.1007/s11269-014-0612-4
Acknowledgements                                                                     Kubota T, Aonashi K, Ushio T, Shige S, Takayabu YN, Kachi M, Arai Y, Tashima T,
We appreciate the S-14 project, particularly to Prof. So Kazama at Tohoku                 Masaki T, Kawamoto N, Mega T, Yamamoto MK, Hamada A, Yamaji M, Liu G,
University, for guiding the research project in Indonesia. The hourly observed            Oki R (2020) Global satellite mapping of precipitation (GSMaP) products in
rainfall data in Jakarta was provided by BMKG Indonesia under the support                 the GPM era. In: Levizzani V, Kidd C, Kirschbaum D, Kummerow C, Nakamura
from ITB. We appreciate both BMKG and ITB.                                                K, Turk F (eds) Satellite precipitation measurement. Advances in global
                                                                                          change research, vol 67. Springer, Cham. https://doi.org/10.1007/978-3-03
Authors’ contributions                                                                    0-24568-9_20
BP analyzed the data and conducted numerical experiments. SK designed                Kubota T, Ushio T, Shige S, Kida S, Kachi M, Okamoto K (2009) Verification of
the study and leads the project. RY supported the numerical experiments. NJ               high-resolution satellite-based rainfall estimates around Japan using a gauge-
supported the fieldwork and data collections. All authors read and approved               calibrated ground-radar dataset. J Meteorol Soc Jpn 87A:203–222. https://doi.
the final manuscript.                                                                     org/10.2151/jmsj.87A.203
                                                                                     Kure S, Farid M, Fukutani Y, Muhari A, Bricker JD, Udo K, Mano A (2014) Several
Funding                                                                                   social factors contributing to floods and characteristics of the January 2013
This research was performed by the Environment Research and Technology                    flood in Jakarta, Indonesia. J Japan Soc Civil Eng Ser G 70(5):I211–I217 (in
Development Fund (JPMEERF15S11415) of the Environmental Restoration                       Japanese with English abstract)
and Conservation Agency of Japan.                                                    Kure S, Jang S, Ohara N, Kavvas ML, Chen ZQ (2013) WEHY-HCM for Modeling
                                                                                          interactive atmospheric-hydrologic processes at watershed scale: II. Model
Availability of data and materials                                                        application to ungauged and sparsely-gauged watersheds. J Hydrol Eng
The datasets supporting the conclusions of this article are currently not                 18(10):1272–1281. https://doi.org/10.1061/(ASCE)HE.1943-5584.0000701
available in any repository. But the authors are willing to share the data           Kure S, Watanabe A, Akabane Y, Yamada T (2008) Field observations of discharge and
based on the requests. Please contact the corresponding author for data                   runoff characteristics in urban catchments area. In: Proceedings of the 11th
requests.                                                                                 International Conference on Urban Drainage, Edinburgh, Scotland, 1-5 Sept 2008
                                                                                     Kure S, Yamada T (2004) A study the nonlinearity of runoff phenomena and
Declarations                                                                              estimation of effective rainfall. In: Proceedings of the 2nd Asia Pacific
                                                                                          Association of Hydrology and Water Resources Conference, 2:76-85,
Competing interests                                                                       Singapore, 5-8 July 2004
The authors declare that they have no competing interests.                           Miyamoto M, Sugiura A, Okazumi T, Tanaka S, Nabesaka S, Fukami K (2012)
                                                                                          Suggestion for an advanced early warning system based on flood
Author details                                                                            forecasting in Bengawan Solo River basin, Indonesia. In: Proceedings of 10th
1
 Environmental and Civil Engineering, Graduate School of Engineering,                     International Conference on Hydroinformatics, IWA IAHR, No.394
Toyama Prefectural University, 5180 Kurokawa Imizu, Toyama 939-0398,                 Moe IR, Kure S, Farid M, Udo K, Kazama S, Koshimura S (2016) Evaluation of flood
Japan. 2Department of Environmental and Civil Engineering, Toyama                         inundation in Jakarta using flood inundation model calibrated by radar rainfall. J
Prefectural University, 5180 Kurokawa Imizu, Toyama 939-0398, Japan.                      Japan Soc Civil Eng Ser B1 (Hydraulic Engineering) 72(4):I_1243–I_1248
3
 Department of Civil Engineering, Pertamina University, Jalan Teuku Nyak             Moe IR, Kure S, Januriyadi NF, Farid M, Udo K, Kazama S, Koshimura S (2017)
Arief, Simprug, Kebayoran Lama, Jakarta 12220, Indonesia.                                 Future projection of flood inundation considering land use change and land
                                                                                          subsidence in Jakarta, Indonesia. Hydrological Res Lett 11(2):99–105
Received: 30 September 2020 Accepted: 14 April 2021                                  Moriasi D, Arnold J, Van Liew MW, Bingner R, Harmel RD, Veith TL (2007) Model
                                                                                          evaluation guidelines for systematic quantification of accuracy in watershed
                                                                                          simulations. Trans ASABE 50(3):885–900. https://doi.org/10.13031/2013.23153
References                                                                           Pakoksung K, Takagi M (2016) Effect of satellite based rainfall products on river
Admojo DD, Tebakari T, Miyamoto M (2018) Evaluation of a satellite-based rainfall         basin responses of runoff simulation on flood event. Model Earth Syst
   product for a runoff simulation of flood event: a case study. J Japan Soc Civil        Environ 2(3):143. https://doi.org/10.1007/s40808-016-0200-0
   Eng Ser B1 74(4):I_73–I_78                                                        Saber M, Yilmaz KK (2018) Evaluation and bias correction of satellite-based rainfall
Aonashi K, Liu G (2000) Passive microwave precipitation retrievals using TMI              estimates for modelling flash floods over the Mediterranean region:
   during the Baiu period of 1998. Part I: algorithm description and validation. J        application to Karpuz River basin, Turkey. Water 10(5):657. https://doi.org/1
   Appl Meteorol 39(12):2024–2037                                                         0.3390/w10050657
Priyambodoho et al. Progress in Earth and Planetary Science (2021) 8:34 Page 17 of 17
Sayama T, Ozawa G, Kawakami T, Nabesaka S, Fukami K (2012) Rainfall-runoff-
inundation analysis of the 2010 Pakistan flood in the Kabul River basin.
Hydrol Sci J 57(2):298–312. https://doi.org/10.1080/02626667.2011.644245
Setiawati MD, Miura F (2016) Evaluation of GSMaP daily rainfall satellite data for
flood monitoring: case study–Kyushu Japan. J Geosci Environ Prot 4(12):101–
117. https://doi.org/10.4236/gep.2016.412008
Sugawara H, Oda R, Seino N (2018) Urban thermal influence on the background
environment of convective precipitation. J Meteorol Soc Jpn 96A:67–76.
https://doi.org/10.2151/jmsj.2018-010
Tian Y, Peters-Lidard CD, Adler RF, Kubota T, Ushio T (2010) Evaluation of GSMaP
precipitation estimates over the contiguous United States. J Hydrometeorol
11(2):566–574. https://doi.org/10.1175/2009JHM1190.1
Ushio T, Sasashige K, Kubota T, Shige S, Okamoto KI, Aonashi K, Inoue T,
Takahashi N, Iguchi T, Kachi M, Oki R, Morimoto T, Kawasaki ZI (2009) A
Kalman filter approach to the global satellite mapping of precipitation
(GSMaP) from combined passive microwave and infrared radiometric data.
J Meteorological Soc Japan Ser II 87A:137–151. https://doi.org/10.2151/jmsj.
87A.137
Publisher’s Note
Springer Nature remains neutral with regard to jurisdictional claims in
published maps and institutional affiliations.You can also read