The Costs of Coordinating Two-Generation Programs
←
→
Page content transcription
If your browser does not render page correctly, please read the page content below

FAMILY-CENTERED COMMUNITY CHANGE

RE S E AR C H RE P O R T

The Costs of Coordinating
Two-Generation Programs
Estimated Labor Costs of Family Services and Cross-Generation Coordination
for Two-Generation Partnerships in Buffalo, Columbus, and San Antonio

Amanda Gold                Peace Gwam          Theresa Anderson   Marcus Gaddy
May 2021
AB O U T T HE U R BA N I NS T I T U TE
The nonprofit Urban Institute is a leading research organization dedicated to developing evidence-based insights
that improve people’s lives and strengthen communities. For 50 years, Urban has been the trusted source for
rigorous analysis of complex social and economic issues; strategic advice to policymakers, philanthropists, and
practitioners; and new, promising ideas that expand opportunities for all. Our work inspires effective decisions that
advance fairness and enhance the well-being of people and places.

Copyright © May 2021. Urban Institute. Permission is granted for reproduction of this file, with attribution to the
Urban Institute. Cover image by StratfordProductions/Shutterstock.

Contents
Acknowledgments                                                iv

Executive Summary                                               v

The Costs of Coordinating Two-Generation Programs              1
  FCCC’s Two-Generation Model                                   3
  Program Cost Estimates                                        4
  Labor Costs of FCCC Coordination                              7
     Buffalo                                                    8
     Columbus                                                  10
     San Antonio                                               13
  Cross-Site Findings                                          15

Appendix A. Reported Labor Costs                               18

Appendix B. Hours Worked by Activity Category and Role         20

Notes                                                          22

References                                                     23

About the Authors                                              24

Statement of Independence                                      26

  CONTENTS                                               iii
Acknowledgments
This report was funded by the Annie E. Casey Foundation. We are grateful to them and to all our
funders, who make it possible for Urban to advance its mission.
The views expressed are those of the authors and should not be attributed to the Urban Institute,
its trustees, or its funders. Funders do not determine research findings or the insights and
recommendations of Urban experts. Further information on the Urban Institute’s funding principles is
available at urban.org/fundingprinciples.
We would like to thank Burgundi Allison, Allison Holmes, Traci Broady, and Kimberly Spring from
the Annie E. Casey Foundation for their support of this work. We would also like to thank Amoretta
Morris, president of Borealis Philanthropy and former director at the Casey Foundation, Kantahyanee
Murray, senior associate director at the Michigan Public Health Institute, and Deborah Gold-Adams,
consultant. We would also like to thank the leaders from the three FCCC communities as well as all the
FCCC staff for sharing information about how they spent their time. Without their responses to our
survey, this study would not have been possible.
Finally, we would like to thank the additional members of the Urban research team, including
Patrick Spauster for timely data analysis and assistance with quality checking, as well as Sue Popkin,
Marla McDaniel, and Amelia Coffey for their comments and guidance during the drafting of this report.
We would also like to thank James Bell at James Bell Associates for his methodological guidance during
the design of this study and his detailed review and feedback on early drafts.
iv ACKNOWLEDGMENTSExecutive Summary
Across the United States, interest has grown in two-generation approaches as a strategy for lifting
families out of poverty. These approaches vary in the combination of services they offer and their target
population, but they all share a common goal of supporting low-income children and their parents
simultaneously so entire families can progress together (Aspen Ascend 2014). Despite the growing
prominence of two-generation approaches, less is known about their cost and the size of the investment
needed to make them successful. Only one published study has estimated the full cost of operating two-
generation programs (James Bell Associates 2018). Yet, no study to date has isolated the specific costs
associated with bringing together existing single-generation services (i.e., those for parents only and
those for children only), building two-generation services, and coordinating interventions for families
within a two-generation framework.
This study seeks to address this knowledge gap by estimating the staff labor cost of the two-
generation coordination and integration that holds together Family-Centered Community Change
(FCCC). Funded by the Annie E. Casey Foundation, FCCC is a two-generation effort that integrated
existing single-generation neighborhood services and developed new family-focused services in three
service footprints located in Buffalo, New York; Columbus, Ohio; and San Antonio, Texas.
This study may be useful for multiple audiences. By providing three case studies of the staff labor
costs of two-generation service coordination, this research may help other localities and nonprofit
service providers in budget planning and resource allocation when organizing their own two-generation
efforts. Funders and policymakers, including representatives of state and local governments, interested
in supporting similar collaborative work may benefit from understanding the personnel investment
necessary to support cross-organizational partnerships and coordinated service delivery. Researchers
may also benefit from the findings, which could benchmark future two-generation cost studies.
Cost Estimates
This study isolates and estimates the staff labor costs associated with the connective tissue of two-
generation programs, as follows:
Coordinating and integrating existing child services and adult education and training services
in a place-based effort: These costs included time staff spent on outreach and enrollment for
EXECUTIVE SUMMARY vtwo-generation programs; leadership, management, and data activities; and development and
maintenance of cross-sector partnerships and relationships over the lifetime of the program.
Directly providing services that had an explicit two-generation focus, such as family coaching
and family services and events: These services were designed to support the entire family. The
community partners built these as part of the two-generation efforts.
Directly providing new single-generation services: These services were created as a result of
the FCCC program. However, the study did not include the full cost of directly providing single-
generation services that preexisted FCCC, as these were already funded and operating within
each community.
Two-generation programs will incur other nonlabor costs in addition to the costs presented in this
study. 1 Service providers may also incur nonlabor costs if they helped participants overcome financial
barriers, for example, by covering costs like groceries, transportation, or tuition. We excluded nonlabor
expenses from this study, considering they are often discretionary, not well tracked, and vary from
program to program and across cities. We also think that many community organizations can estimate
nonlabor costs reasonably well using local knowledge, while the cost of the staff time required to
enhance existing place-based services with a two-generation model is less well known and harder to
estimate. The main contribution of this study is helping program planners estimate these costs on the
basis of three case studies. Box 1 summarizes the types of costs tracked.
We conducted this study during the sixth and seventh years of FCCC’s seven-year grant period. The
two-generation interventions in each community were continuously evolving over the grant period, and
core elements of the programming have continued even after the grant period ended. Therefore, the
costs represent a snapshot at a point in time after several years of evolution in each two-generation
effort. Given the timing of the study, we do not have information about start-up costs.
vi EXECUTIVE SUMMARYBOX 1 Two-Generation Costs Tracked in the FCCC Study Outreach and enrollment: costs related to interactions with the community’s target population to inform, engage, or bring in prospective clients or currently enrolled clients who may or may not be involved in activities. Coaching: costs related to all forms of coaching, including financial counseling and job coaching, for enrolled adults. Training and adult education: costs related to the direct provision of any new training or credentialing program established because of FCCC, as well as costs related to coordinating of any existing training or credentialing program. Child services: costs related to the direct provision of any new child services established because of FCCC, as well as costs related to coordinating any existing educational services for children, including child care, early education and prekindergarten, and auxiliary elementary school services. Family services: costs related to integrating the parent and child components of FCCC interventions. Coordination and referrals: costs related to linking clients with services and resources, which may be part of the FCCC partnership or outside it. Data entry and analysis: costs related to collecting, entering, managing, and analyzing two-generation programmatic data (excludes costs directly related to the evaluation). Management and supervision: costs related to management and supervision of employees on FCCC activities. Leadership: costs that shape the organizational and institutional composition of the FCCC effort. Key Findings The three communities were different from each other—each represented a distinct approach to two- generation programming with a different number of organizational partners and staff providing services, various levels of service intensity, and different services offered. All three cities had a similar cost of living (Popkin et al. 2019). The number of families served over the entire FCCC grant period also varied by community, though the official enrollment numbers reported here substantially underestimate the total number of individuals and families that received any FCCC service. 2 Therefore, we do not compute or report a per-participant cost. Findings represent three separate case studies and EXECUTIVE SUMMARY vii
should only be compared across communities to understand which activities were more or less costly,
rather than to compare total dollar amounts.
Buffalo’s cost of staff labor came to an estimated $120,600 over a three-month period
(October 2018–December 2018). The largest proportion of costs came from data activities (23
percent), coaching (18 percent), management (14 percent), and outreach and enrollment (12
percent). The share of costs spent on data activities aligned with Buffalo’s emphasis on refining
its data-tracking procedures and using them for management purposes. Buffalo formally
enrolled 274 families over the entire grant period.
Columbus’s cost of staff labor came to an estimated $104,200 over a three-month period
(October–December 2019). Most costs were related to coaching (22 percent), leadership
activities (19 percent), child services (16 percent), and data activities (15 percent). The share of
costs spent on coaching aligned with Columbus’s intensive approach to family coaching. In
Columbus, 112 families were formally enrolled in FCCC.
San Antonio’s cost of staff labor came to an estimated $295,300 over a three-month period
(January–March 2019). The largest costs were related to leadership activities (21 percent),
followed by management (20 percent), data activities (16 percent), and child services (14
percent). The share of costs spent on leadership activities aligned with San Antonio’s emphasis
on coordination across numerous two-generation organizational and agency partners. San
Antonio formally enrolled 461 families.
Nearly all labor costs (92 percent or more) were compensated in every community, meaning that
staff were paid for their time (as opposed to working “off the clock”). The staff roles that
reported working the largest amount of uncompensated time varied across each community.
The tasks that required the most uncompensated work were outreach and enrollment activities
in San Antonio and leadership in Buffalo and Columbus.
Data tasks were among the top four most costly activities in every community. Staff used data
to track participants’ service receipt and to coordinate service delivery. The communities were
also required to report data to outside organizations (including FCCC evaluators) for
performance measurement and evaluation. The research team instructed FCCC staff members
to record evaluation-related costs separately so they would be excluded from this study, but
some community leadership members thought that some evaluation costs may have been
captured in the reported totals.
viii EXECUTIVE SUMMARY Adult education and training were among the least costly activities in each community, though
this is likely because our study captures the costs of coordinating these services, rather than
the full cost of providing them.
Opportunities for Future Research
The costs presented in the study estimate the resources staff needed to bring and hold together two-
generation programming in three separate communities. Questions remain about the costs associated
with planning and setting up two-generation programming and what programs cost per person or per
family served. More evidence is needed on the cost of providing the entire package of family services,
including child and adult education and training and nonlabor costs. Future research could explore
these questions to estimate the full cost of two-generation programs. In conjunction with an impact
study, future efforts could also compare the costs against the benefits of two-generation efforts for the
families and communities they serve.
EXECUTIVE SUMMARY ixThe Costs of Coordinating
Two-Generation Programs
Across the United States, interest has grown in two-generation approaches as a strategy for lifting
families out of poverty. These programs vary in the combination of services they offer and their target
population, but they all share a common goal of supporting low-income children and their parents
simultaneously so entire families can progress together (Aspen Ascend 2014). Despite the growing
prominence of two-generation approaches, less is known about their cost and the size of the investment
needed to make them successful. Only one published study has estimated the full cost of operating two-
generation programs (James Bell Associates 2018). Yet, no study to date has isolated the specific costs
associated with bringing together existing single-generation services (i.e., those for parents only and
those for children only), building two-generation services, and coordinating interventions for families
within a two-generation framework. This study addresses this knowledge gap by estimating the staff
labor cost of Family-Centered Community Change (FCCC), a seven-year, two-generation effort
sponsored by the Annie E. Casey Foundation in three communities.
The Annie E. Casey Foundation launched FCCC in 2012 to support place-based local partnerships
in three high-poverty neighborhoods as they integrated and coordinated services—including housing
assistance, high-quality education, and job training—to help parents and children succeed together in a
two-generation approach. The FCCC efforts took place within comprehensive community initiatives in
Buffalo, New York; Columbus, Ohio; and San Antonio, Texas—three middle-cost cities. Leadership
coalitions in these communities established partnerships and programming, participated in an
evaluation, and developed plans to sustain the work beyond the Casey Foundation’s seven-year
investment (The Annie E. Casey Foundation 2020). From 2013 through 2019, the Urban Institute
evaluated each community partnership’s design, implementation, and outcomes for families. This report
is one in a series that summarizes what we have learned from this research. We collected data for this
cost study in years six and seven of the seven-year grant period.
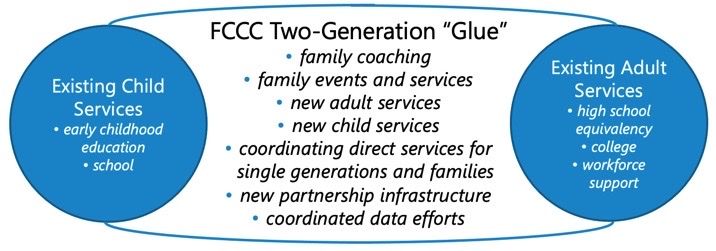
The purpose of this study is to estimate the costs of the connective tissue, or the glue, that held
these two-generation programs together. As summarized in figure 1, this analysis included the following
elements:
Coordinating and integrating existing child services and adult education and training services
in a place-based effort: These costs included time staff spent on outreach and enrollment for
THE COSTS OF COORDINATING TWO-GENERATION PROGRAMS 1two-generation programs; leadership, management, and data activities; and development and
maintenance of cross-sector partnerships and relationships over the lifetime of the program.
Directly providing services that had an explicit two-generation focus, such as family coaching
and family services and events: These services were designed to support the entire family. The
community partners built these as part of the two-generation efforts.
Directly providing new single-generation services: These services were created as a result of
the FCCC effort, such as child care for family events. However, we did not include the full cost
of directly providing single-generation services that preexisted FCCC, as these were already
funded and operating within each community.
Two-generation programs will incur other nonlabor costs in addition to the costs presented in this
study. 3 Service providers may also incur nonlabor costs if they helped participants overcome financial
barriers, for example, by covering costs like groceries, transportation, or tuition. We excluded nonlabor
expenses from this study, considering they are often discretionary, not well tracked, and vary from
program to program and across cities. We also think that many community organizations can estimate
nonlabor costs reasonably well using local knowledge, while the cost of the staff time required to
enhance existing place-based services with a two-generation model is less well known and harder to
estimate. The main contribution of this study is helping program planners estimate these costs on the
basis of three case studies.
FIGURE 1
The Glue That Holds FCCC Two-Generation Programs Together
Source: Urban Institute, Family-Centered Community Change cost study.
This study may be useful for multiple audiences. By providing three case studies of the staff labor
costs of two-generation service coordination, this research may help other localities and nonprofit
2 THE COSTS OF COORDINATING TWO-GENERATION PROGRAMSservice providers in budget planning and resource allocation when organizing their own two-generation
efforts. Funders and policymakers, including representatives of state and local governments, interested
in supporting similar collaborative work may benefit from understanding the personnel investment
necessary to support cross-organizational partnerships and coordinated service delivery. Researchers
may also benefit from the findings, which could benchmark future two-generation cost studies.
FCCC’s Two-Generation Model
FCCC took an innovative approach, with the Annie E. Casey Foundation serving as a “strategic
coinvestor” to support existing comprehensive community initiatives in incorporating a two-generation
framework. 4 FCCC built on the renewed focus from both philanthropy and the federal government on
two-generation “whole family” models, which researchers and policymakers find more effective than
isolated efforts to move individuals with low incomes toward greater economic stability. The underlying
theory is that two-generation models that “create opportunities and address the needs for both
children and the adults in their lives” can disrupt intergenerational poverty (Aspen Ascend 2016). These
programs generally coordinate services like high-quality early childhood and elementary education,
home visiting, family coaching, and workforce services for parents.
The FCCC effort focused on three key elements of two-generation programs: family and economic
success strategies; capacity building for parents, caregivers, and agencies; and early care, education,
and quality experiences for children. All three community partnerships provided coordinated services
generally aligned with these elements for families with children up to age 10. Each community
partnership added new coaching services to help families set goals and stay on target; each created new
family services like parenting workshops and home visiting; and two of the three offered new financial
education services. Data collection, tracking, and sharing also played an important role in informing
service delivery in all three communities.
There were also important differences in the FCCC population and approach across communities.
Each community served families with different characteristics, operated programs on different scales,
and offered a unique combination of services. For more detail on the FCCC demonstration, including
the effort’s main services and components, implementation experiences, achievements, lessons learned,
and legacy, see Anderson and colleagues (2021).
Though we focus on the Annie E. Casey Foundation as the primary funder of the two-generation
glue, partnerships in each FCCC community wove together multiple funding streams to support their
THE COSTS OF COORDINATING TWO-GENERATION PROGRAMS 3efforts. The communities leveraged competitive federal grants, funding from private foundations, and
other state and local funds to build and sustain their work. Toward the end of the seven-year grant
period, each community sought new funding sources to continue serving families.
Program Cost Estimates
We deployed a staff time-use survey to collect data on time spent coordinating each FCCC two-
generation effort across existing single-generation services and providing new family-focused services
in each community. We wanted to approximate the full labor cost of each FCCC partnership effort by
capturing the human resources actually spent, including both compensated time (meaning that staff
were paid) and uncompensated time (staff were unpaid or “off the clock”). Note that costs are different
from financing, so we do not account for the funding sources supporting each activity.
Ideally, we would have collected data for a full year in all three communities. Data collection
periods, though, varied in each community to align with the preferences and availability of program
partners. This flexibility reflects the community-engaged methods we used throughout this project,
which gave community partners a substantial role in shaping the research activities (Coffey, Gwam, and
Popkin 2021). We administered the data collection survey bimonthly for the six-month period between
October 2018 and March 2019 in Buffalo; monthly for the three-month period between October and
December 2019 in Columbus; and monthly for the three-month period between January and March
2019 in San Antonio. However, we present only the first three months of Buffalo’s data (October 2018–
December 2018) in the body of this report to put the three cost estimates on the same time scale.
(Findings from all six months of data collected in Buffalo appear in the separate appendixes—Gold et al.
2021.)
Because of the timing of this study, during the sixth and seventh years of FCCC’s seven-year grant
period, the findings represent a snapshot of what each program cost at a single point in time (i.e., after
several years of program operation in each community). The FCCC two-generation effort continuously
evolved, even up to the end of the grant period. Therefore, communities were not necessarily in a
steady state of implementation at any given time and never reached a “final stage” of programming. We
also do not have information about start-up costs. The separate appendixes (Gold et al. 2021) contain
more detail about the data collection process.
To estimate labor costs, we multiplied the loaded cost of an hour of staff time (for each staff
member or position title) by the number of hours each staff member reportedly spent working on FCCC
4 THE COSTS OF COORDINATING TWO-GENERATION PROGRAMS(totaling compensated and uncompensated time) during each community’s data collection period. We
asked FCCC partners to share fully loaded labor rates to inform this calculation, but we allowed
organizations to determine how they loaded staff rates. All rates included the employee’s hourly labor
rate and fringe benefits, but they may or may not have included overhead and general administration,
depending on how each organization loaded their staff costs. While we focus on costs in the body of this
report, we also summarize the number of hours worked by activity category and staff role for all three
communities in the separate appendixes (Gold et al. 2021).
In each community, we report the labor costs associated with different staffing roles, which are
based on whether individuals self-identified as having a frontline, supervisory, or leadership role. We
also report labor costs associated with different FCCC-related activities and services in each
community. The program activities we track in this study, as well as the shorthand we use in figures, are
defined as follows:
Outreach and enrollment: costs related to interactions with the community’s target population
to inform, engage, or bring in prospective clients or currently enrolled clients who may or may
not be involved in activities.
Coaching: costs related to all forms of coaching, including financial counseling and job coaching,
for enrolled adults.
Adult education and training: costs related to the direct provision of any new training or
credentialing program established because of FCCC, as well as costs related to coordinating
any form of preexisting training or credentialing program.
Child services: costs related to the direct provision of any new child services established
because of FCCC, as well as costs related to coordinating any existing educational services for
children, including child care, early education and prekindergarten, and auxiliary elementary
school services.
Family services: costs related to integrating the parent and child components of FCCC
interventions.
Coordination and referrals: costs related to linking clients with services and resources, which
may be part of the FCCC partnership or outside it.
Data entry and analysis: costs related to the process of collecting, entering, managing, and
analyzing two-generation programmatic data (excludes costs directly related to the
evaluation).
THE COSTS OF COORDINATING TWO-GENERATION PROGRAMS 5 Management and supervision: costs related to management and supervision of employees on
FCCC activities.
Leadership: costs that shape the organizational and institutional composition of the FCCC
effort.
Detailed descriptions of the cost categories were refined in collaboration with a broad cross-
section of community partners, as described in the separate appendixes (Gold et al. 2021). Activities
performed are not always aligned with the level of specific staff members. For example, people in
supervisory or frontline staff roles could conduct leadership activities.
Missing data for some staff members in some monthly or bimonthly survey waves were a challenge.
We made reasonable assumptions to fill in missing values on the basis of available data (e.g., that same
staff member’s reported efforts in other survey waves or how staff members with the same role
responded in that wave). Where necessary, we used our team’s in-depth knowledge of the staff
members and organizations to fill in gaps. We reviewed this approach with the data leads in each
community for feedback and got their approval. The costs that result from these assumptions are our
preferred estimates, and we present them in the following section. (Alternative estimation strategies
appear in appendix A, but different methods do not change the findings substantially.)
Comparisons across communities should also be made cautiously because each program operated
differently (Anderson et al. 2021). Comparisons should focus on which activities were more or less
costly, rather than on total dollar amounts across communities. A more detailed discussion of the study
design and limitations can be found in the separate appendixes (Gold et al. 2021).
Despite some missing data and differences between communities, we believe that this report
estimates the labor resources needed to coordinate two-generation programs fairly accurately. It also
estimates the cost of core two-generation activities, including those related to two-generation service
provision and single-generation service coordination (coaching, adult education and training, child
services, and family services) and those related to ongoing program management and operations
(outreach and enrollment, coordination and referrals, data entry and analysis, management and
supervision, and leadership activities). These findings may help other localities and nonprofit service
providers in budget planning and resource allocation when organizing their own two-generation efforts.
Funders and policymakers, including representatives of state and local governments, interested in
supporting similar collaborative work may benefit from understanding the personnel investment
necessary to support cross-organizational partnerships and coordinated service delivery. Researchers
may also benefit from the findings, which could benchmark future two-generation cost studies.
6 THE COSTS OF COORDINATING TWO-GENERATION PROGRAMSLabor Costs of FCCC Coordination
This study estimated the staff labor costs associated with two-generation efforts when single-
generation services already operate in a community. Staff labor resources supported leadership,
management, data, and partnership coordination activities for the two-generation effort. Staff
members also provided direct services with an explicit two-generation focus, such as outreach and
enrollment for two-generation programs, family coaching and family services, and family events. Staff
members also directly provided some single-generation services that preexisted FCCC, such as child
care during family events.
Our estimates did not include the labor cost of directly providing child-only or adult-only services
that existed in the community before FCCC (e.g., the costs associated with frontline and supervisory
staff using work hours to provide these services). Some leaders of child and adult service organizations,
however, helped coordinate the two-generation effort, and that time is included in this study. Further,
we estimated only loaded labor costs and excluded other fixed or direct costs, such as the cost of facility
rentals or direct payments programs made on behalf of families (e.g., to subsidize child care, provide
transportation, or help remove other barriers).
Comparisons across communities should be made cautiously, as each took a different approach to
two-generation programming. Although the cost of living in the three cities was comparable, the size
and scale of the efforts varied. We report the number of families in each community formally enrolled
over the entire FCCC grant period for context, though the official enrollment numbers substantially
underestimate the total number of individuals and families that received any FCCC service. 5 Therefore,
we do not compute or report a per participant cost. Findings represent three separate case studies and
should only be compared across communities to understand which activities were more or less costly,
rather than to compare total dollar amounts.
In summary, we found the following staff labor costs:
Buffalo’s cost of staff labor came to an estimated $120,600 over a three-month period
(October 2018–December 2018). The largest proportion of costs came from data activities (23
percent), coaching (18 percent), management activities (14 percent), and outreach and
enrollment (24 percent). Buffalo formally enrolled 274 families over the entire grant period.
Columbus’s cost of staff labor came to an estimated $104,200 over a three-month period
(October–December 2019). Most costs were related to coaching (22 percent), leadership
THE COSTS OF COORDINATING TWO-GENERATION PROGRAMS 7activities (19 percent), child services (16 percent), and data activities (15 percent). Columbus
formally enrolled 112 families over the entire grant period.
San Antonio’s cost of staff labor came an estimated $295,300 over a three-month period
(January–March 2019). The largest costs were related to leadership activities (21 percent),
followed by management (20 percent), data activities (16 percent), and child services (14
percent). San Antonio formally enrolled 461 families over the entire grant period.
We note a few patterns. Data tasks were among the costliest activities for all three communities—
these may have been carried out by staff at all three levels. Adult education and training were among
the least costly activities—note this estimate captures the cost of coordinating existing services rather
than the cost of fully providing them, as well as providing any new adult education and training created
as the result of FCCC. In all three communities, frontline staff were responsible for the largest share of
overall costs. Nearly all costs (more than 92 percent) were compensated in each community, meaning
that staff were paid for their labor almost all the time.
Buffalo
M&T Bank and the Westminster Foundation led Buffalo’s FCCC effort, called the Parent Achievement
Zone (PAZ), which builds upon the previous federal investment of the Buffalo Promise Neighborhood.
The FCCC partnership included two early care and education centers called the Children’s Academies
(funded with support from M&T Bank, the Westminster Foundation, and other philanthropic sources),
Westminster Community Charter School, Highgate Heights Elementary School, Catholic Charities,
Belmont Housing Resources for Western New York, and SUNY Erie (formerly called Erie Community
College).
The PAZ model was built around the Children’s Academies and the two local elementary schools,
and colocated offices within each school for adult coaching services. Most families participating in PAZ
had children who attended one of the Children’s Academies or the elementary schools. Parents and
other adult family members were eligible to work with job coaches employed by SUNY Erie and
financial and housing coaches employed by Belmont Housing. The Buffalo PAZ team also offered a
monthly informational and community networking event called PAZ Café for families in the footprint,
which included presentations, guest speakers, and training on topics such as budgeting and money
management and coping with stress. In 2019, after we collected cost study data, Buffalo introduced two
family support specialists to provide health and wellness coaching and help connect families to mental
health services and resources.
8 THE COSTS OF COORDINATING TWO-GENERATION PROGRAMSAt the time of data collection, between October 2018 and December 2018, all FCCC partners and
most FCCC programming (except for the family support specialists) were in place and organizations
were fully staffed. Yet, in the months before data collection the partnership experienced staff turnover,
including several months without an official PAZ director. During this time, which was also approaching
the end of the grant period, program staff and partners operated as they had previously but reported
that enrollment of new families and parents declined, and the Buffalo Promise Neighborhood focused
more on serving existing families. A new director was hired approximately three months before data
collection for this cost study started.
ESTIMATED BUFFALO LABOR COSTS
On the basis of the data staff reported in the time-use survey, Buffalo’s program cost $120,635 in staff
labor for the three-month data collection period from October 2018 to December 2018. Figure 2
summarizes the labor costs by activity and whether the time was compensated. More than two-thirds of
all costs were related to data activities (23 percent), coaching (18 percent), management activities (14
percent), and outreach and enrollment work (12 percent). A smaller portion of costs came from
leadership activities (10 percent) and coordination activities (9 percent). Family services (5 percent),
child services (5 percent), and adult education and training (3 percent) made up the remainder of
program costs. 6
FIGURE 2
Estimated Buffalo Labor Costs by Activity and Compensation (October–December 2018)
Compensated Uncompensated
Data
Coaching
Management
Outreach
Leadership
Coordination
Family services
Child services
Adult edu/training
$- $5,000 $10,000 $15,000 $20,000 $25,000 $30,000
Source: Urban Institute analysis of time-use survey data.
Note: Estimated costs are as reported by staff and cleaned by the Urban research team.
THE COSTS OF COORDINATING TWO-GENERATION PROGRAMS 9As displayed in figure 3, the largest portion of labor costs was related to work done by frontline
staff (44 percent), followed by supervisory staff (35 percent) and leadership staff (21 percent). A
relatively large share of leadership time was uncompensated.
FIGURE 3
Estimated Buffalo Labor Costs by Role and Compensation (October–December 2018)
Compensated Uncompensated
$60,000
$50,000
$40,000
$30,000
$20,000
$10,000
$0
Frontline Supervisory Leadership
Source: Urban Institute analysis of time-use survey data.
Note: Estimated costs are as reported by staff and cleaned by the Urban research team.
Nearly all labor costs were compensated (92 percent), meaning that staff were paid for their time,
including work that happened during normal business hours and paid time beyond normal hours. About
$9,343 of all labor costs were uncompensated (unpaid staff time, including “off the clock” hours
committed to FCCC-related activities and hours that cannot be billed for time worked). 7 Together,
leadership activities and management tasks accounted for nearly two-thirds of all uncompensated costs
(47 percent and 18 percent, respectively). Leadership staff reported the largest proportion of
uncompensated costs (82 percent), compared with frontline staff (10 percent) and supervisory staff (8
percent).
Columbus
The primary service offered through the Columbus FCCC partnership was an intensive coaching and
case management model called Next Doors, which served the Weinland Park neighborhood.
Community Properties of Ohio, a nonprofit subsidized housing provider with a service provision arm. As
10 THE COSTS OF COORDINATING TWO-GENERATION PROGRAMSthe backbone of the FCCC collaborative, Community Properties of Ohio employed family achievement
coaches who worked with the families in an office colocated in the Godman Guild, a well-established
organization in Weinland Park that focused on youth, family education, and workforce development. In
Next Doors, families worked with one or more family achievement coaches to set goals—at least one
goal for an adult in the family and one goal for a child. Members committed to work on these goals for at
least 12 months. Coaches had caseloads of 25 to 30 families and connected them with various
resources to help them achieve their goals. Other families engaged with FCCC through the Parent
Pledge, a mutual commitment to children and families between families and community service
providers. Many parents were recruited through Weinland Park Elementary School.
At the time of data collection, Columbus’s core programming components were in place and all
services were running. Directions for Youth and Families had recently joined the partnership, increasing
access to mental health services, and the FCCC effort was ramping up and integrating services for
school-age children at Weinland Park Elementary School. Columbus Works also had recently joined the
partnership, providing additional workforce development services. However, high-quality early
education options for infants and toddlers remained limited to a few slots at the Ohio State University’s
laboratory school, Schoenbaum Family Center, and Community Properties of Ohio leadership
continued to look for a strong neighborhood early childhood provider.
ESTIMATED COLUMBUS LABOR COSTS
On the basis of staff responses to the time-use survey, Columbus’s program cost an estimated $104,236
in staff labor for the three-month data collection period from October to December 2019. Figure 4
summarizes the labor costs by activity and compensation. Almost three-quarters of labor costs were
related to coaching (22 percent), leadership activities (19 percent), child services (16 percent), and data
activities (15 percent). A smaller proportion of labor costs were related to management (8 percent),
coordination (7 percent), outreach and enrollment activities (6 percent), family services (5 percent), and
adult education and training (2 percent). Leadership in Columbus also reported that substantial funding
was used to help families with child care costs, which are direct costs not included in this study.
THE COSTS OF COORDINATING TWO-GENERATION PROGRAMS 11FIGURE 4
Estimated Columbus Labor Costs by Activity and Compensation (October–December 2019)
Compensated Uncompensated
Coaching
Leadership
Child services
Data
Management
Coordination
Outreach
Family services
Adult edu/training
$- $5,000 $10,000 $15,000 $20,000 $25,000
Source: Urban Institute analysis of time-use survey data.
Note: Estimated costs are as reported by staff and cleaned by the Urban research team.
As displayed in figure 5, the majority of labor costs were associated with work done by frontline
staff (56 percent), followed by leadership staff (26 percent), and supervisory staff (18 percent).
FIGURE 5
Estimated Columbus Labor Costs by Role and Compensation (October–December 2019)
Compensated Uncompensated
$70,000
$60,000
$50,000
$40,000
$30,000
$20,000
$10,000
$0
Frontline Supervisory Leadership
Source: Urban Institute analysis of time-use survey data.
Note: Estimated costs are as reported by staff and cleaned by the Urban research team.
12 THE COSTS OF COORDINATING TWO-GENERATION PROGRAMSNearly all labor costs in Columbus—98 percent—were compensated. Of the 2 percent of costs that
were uncompensated ($2,000), leadership staff reported the largest amount of uncompensated costs
(68 percent), followed by frontline staff (32 percent). Supervisory staff did not report any
uncompensated costs.
San Antonio
San Antonio’s FCCC Dual Generation program primarily offered adult basic skills and workforce
training, high-quality child care during parents’ participation in training programs, and case
management to support parents’ completion of training as well as family stability. The dual-generation
FCCC footprint was the largest in area and population of the three communities; the effort also
involved the most organizational partners. The United Way of San Antonio and Bexar County was the
dual-generation backbone organization. The Dual Generation partnership included Goodwill San
Antonio, which provided case management and workforce training; the San Antonio Housing Authority,
which also provided case management; the Family Service Association, which provided families with
financial coaching; and five high-quality child care centers. Case management was most intensive for
parents during training programs (which varied in length). Case managers had large caseloads that grew
over time as additional families entered programming, and they continued to support families after they
exited programming with lighter-touch coaching as needed. The partnership also included other
organizations that provided adult training and supportive services for families. Many adult service
providers were colocated at the Eastside Education and Training Center.
At the time of data collection, the core service components were in place, though the partnership
continued to expand to fill gaps in services. The partnership brought on DePelchin Children’s Center to
provide parenting and training supports and partnered with the Boys and Girls Club to provide out-of-
school programming for elementary school–aged children.
Staff in San Antonio reported that data-related activities were more frequent during the data
collection period than what is typical in other months, as providers were heavily involved in data
collection and reporting for the evaluation. Some data-related costs may have been reported, even
though we asked staff to report evaluation-related costs separately so we could exclude them from the
analysis.
THE COSTS OF COORDINATING TWO-GENERATION PROGRAMS 13ESTIMATED SAN ANTONIO LABOR COSTS
On the basis of staff responses to the time-use survey, San Antonio’s program cost an estimated
$295,264 in staff labor for the three-month data collection period from January to March 2019. Figure
6 summarizes the labor costs by activity and compensation. The largest share of labor costs was related
to leadership activities (21 percent), followed by management (20 percent), data activities (16 percent),
and child services (14 percent). A smaller share of labor costs came from outreach and enrollment
activities (11 percent), coaching (8 percent), coordination (5 percent), family services (3 percent), and
adult education and training (1 percent). San Antonio leadership reported that they also provided
substantial tuition support for adult education and training programs, which are direct costs not
included in this study.
FIGURE 6
Estimated San Antonio Labor Costs by Activity and Compensation (January–March 2019)
Compensated Uncompensated
Leadership
Management
Data
Child services
Outreach
Coaching
Coordination
Family services
Adult edu/training
$- $10,000 $20,000 $30,000 $40,000 $50,000 $60,000 $70,000
Source: Urban Institute analysis of time-use survey data.
Note: Estimated costs are as reported by staff and cleaned by the Urban research team.
As displayed in figure 7, labor costs were evenly split across different types of staff. Frontline staff
were responsible for the largest share of labor costs (38 percent), followed by supervisory staff (34
percent) and leadership staff (28 percent).
14 THE COSTS OF COORDINATING TWO-GENERATION PROGRAMSFIGURE 7
Estimated San Antonio Labor Costs by Role and Compensation (January–March 2019)
Compensated Uncompensated
$120,000
$100,000
$80,000
$60,000
$40,000
$20,000
$0
Frontline Supervisory Leadership
Source: Urban Institute analysis of time-use survey data.
Note: Estimated costs are as reported by staff and cleaned by the Urban research team.
Nearly all labor costs were compensated—95 percent. Uncompensated costs were almost evenly
split between frontline and supervisory staff (41 percent and 39 percent respectively), followed by
leadership staff (20 percent). Outreach and enrollment activities accounted for the largest share (33
percent) of all uncompensated costs.
Cross-Site Findings
Because all three communities had different program models, different types and numbers of partners,
different participants, and different contexts, it would not be appropriate to compare total staff labor
costs for two-generation coordination. However, it is still possible to draw limited comparisons
regarding the relative importance of certain activities and staff that drove costs:
Nearly all labor costs (92 percent or more) were compensated in every community. However,
the staff roles that reported a portion of uncompensated costs varied, as did the
uncompensated activities, such as leadership activities in Buffalo and Columbus and outreach
and enrollment in San Antonio. Our data do not provide more detail about the uncompensated
work or the circumstances surrounding it. 8
THE COSTS OF COORDINATING TWO-GENERATION PROGRAMS 15 Data tasks were among the top four most costly activities in every community. Each community
had a data lead responsible for managing the community’s data strategy and coordinating the
approach across all partner organizations. The data lead self-identified as either leadership or
supervisory staff, depending on the community, though staff of all levels (frontline, supervisory,
and leadership) reported working on data tasks. Staff used data to track participants’ service
experiences and to coordinate service delivery. The sites were also required to report data to
outside organizations (including FCCC evaluators) for performance measurement and
evaluation. FCCC staff members recorded evaluation-related costs separately to exclude them
from this study, but some community leadership members thought that some evaluation costs
may have been captured in the reported totals.
Adult education and training were among the least costly activities in each site. This result is
likely because our study captured the cost of coordinating adult education and training rather
than the full cost of providing it, as these programs were mostly already funded and operating.
For other types of activities, we only observe similarities across two of the three communities:
In Buffalo and San Antonio, management tasks were among the top four most costly activities.
In Columbus and San Antonio, child services were among the top four most costly activities.
Leadership tasks were among the top four most costly activities in both Columbus and San
Antonio and the fifth most costly in Buffalo. These activities shaped the composition of the
partnership and included such tasks as negotiating and establishing new partnerships, setting
organizational and strategic partnership-wide priorities, managing organizational relationships
with external entities, and hiring for FCCC positions. In all three communities, staff in frontline,
supervisory, and leadership roles all reported spending time on leadership work.
Coaching-related costs were among the top four largest categories in Buffalo and Columbus.
Coaching was a core element of FCCC in all three programs but looked different in each
community. Columbus’s coaching model was more sustained and intensive, while San Antonio
was intensive for a short time and then lessened. Buffalo had a less intensive coaching model.
Frontline staff were responsible for the largest share of labor costs in every community. In
Columbus, more than half of labor costs were driven by frontline staff (56 percent), while in
Buffalo and San Antonio the share was smaller (44 percent and 38 percent).
The labor costs presented in this study provide a snapshot of the human resources required to glue
two-generation programs together in three individual communities at specific points in time. Most of
16 THE COSTS OF COORDINATING TWO-GENERATION PROGRAMSthese costs are “extra,” in that they are the staff costs necessary to connect existing single-generation
services to carry out a two-generation approach. (Though we do not know if efficiencies were gained in
the existing single-generation services, we did not find qualitative evidence to indicate that was the
case.) These findings highlight that coordinating partners and services across organizations and
providing family-focused supports requires substantial effort and resources—an important conclusion
for others looking to operate or sponsor similar efforts. Though we do not have a measure of economic
benefits to weigh against these costs, the final report from the FCCC effort provides a richer discussion
of what this effort involved and achieved over the grant period (Anderson et al. 2021).
This study does not capture the full costs for the suite of services provided to families, but instead
focuses on the additional efforts required for two-generation programming. It also excludes nonlabor
direct costs and does not capture the costs associated with planning and setting up two-generation
programming, considering these costs were incurred before we collected cost data. Estimating those
additional costs would be a valuable next step in understanding the full cost of two-generation
programs. Once costs are better understood, future research could determine the trade-offs between
costs and the economic and other measurable benefits to families and communities.
THE COSTS OF COORDINATING TWO-GENERATION PROGRAMS 17Appendix A. Reported Labor Costs
Tables A.1, A.2, A.3, and A.4 summarize the estimated labor costs of the two-generation efforts in each
community without missing data filled in or implausible values (“raw estimates”) corrected. These costs
should be treated as lower-bound and less accurate estimates of FCCC labor costs and are not the
preferred estimates for the reasons described in the separate appendixes (Gold et al. 2021).
TABLE A.1
Preferred Costs and Raw Costs by Activity: Buffalo
Preferred Estimates Raw Estimates
Compensated Uncompensated Compensated Uncompensated
Leadership $8,207 $4,426 $7,628 $3,847
Management $15,708 $1,674 $14,785 $1,674
Data $27,090 $871 $19,935 $737
Outreach $14,503 $210 $7,434 $210
Child services $5,234 $602 $4,316 $602
Coaching $21,925 $147 $14,368 $147
Coordination $9,962 $668 $5,009 $668
Family services $5,575 $482 $4,201 $348
Adult education and
$3,089 $263 $2,778 $263
training
Source: Urban Institute analysis of time-use survey data.
TABLE A.2
Preferred Costs and Raw Costs by Activity: Columbus
Preferred Estimates Raw Estimates
Compensated Uncompensated Compensated Uncompensated
Leadership $18,648 $724 $17,883 $724
Management $7,391 $452 $6,561 $452
Data $15,059 $398 $12,676 $336
Outreach $6,254 $222 $5,219 $185
Child services $16,551 $0 $11,362 $0
Coaching $23,236 $93 $19,373 $93
Coordination $7,642 $111 $6,224 $87
Family services $4,908 $0 $3,923 $0
Adult education and
$2,550 $0 $2,096 $0
training
Source: Urban Institute analysis of time-use survey data.
18 APPENDIX ATABLE A.3
Preferred Costs and Raw Costs by Activity: San Antonio
Preferred Estimates Raw Estimates
Compensated Uncompensated Compensated Uncompensated
Leadership $60,527 $1,769 $53,629 $1,545
Management $58,043 $1,385 $41,194 $909
Data $45,618 $2,403 $36,721 $1,441
Outreach $27,926 $4,840 $21,925 $4,414
Child services $40,925 $623 $25,883 $454
Coaching $21,843 $1,794 $13,745 $1,467
Coordination $15,179 $1,012 $10,573 $788
Family services $7,536 $480 $7,156 $459
Adult education and
$3,071 $289 $2,577 $230
training
Source: Urban Institute analysis of time-use survey data.
TABLE A.4
Preferred Costs and Raw Costs by Staff Role
Preferred Estimates Raw Estimates
Compensated Uncompensated Compensated Uncompensated
Buffalo
Frontline $52,122 $952 $33,163 $684
Supervisory $41,758 $704 $30,458 $704
Leadership $17,412 $7,686 $16,833 $7,107
Columbus
Frontline $58,250 $643 $41,783 $519
Supervisory $18,718 $0 $18,614 $0
Leadership $25,268 $1,357 $24,921 $1,357
San Antonio
Frontline $106,528 $5,965 $80,701 $4,535
Supervisory $94,192 $5,719 $66,487 $4,693
Leadership $79,948 $2,912 $66,214 $2,478
Source: Urban Institute analysis of time-use survey data.
APPENDIX A 19Appendix B. Hours Worked by
Activity Category and Role
Tables B.1, B.2, B.3, and B.4 summarize the total number of hours worked using our preferred estimates
(with missing values filled in) and broken out by activity category and staff role. Because wage rates
vary by community, these estimates highlight the effort required by the two-generation partnerships in
each community.
TABLE B.1
Estimated Hours by Activity: Buffalo
Compensated Uncompensated
Leadership 177 88
Management 374 30
Data 787 24
Outreach 427 5
Child services 144 15
Coaching 664 4
Coordination 292 12
Family services 162 14
Adult education and
88 5
training
Source: Urban Institute analysis of time-use survey data.
TABLE B.2
Estimated Hours by Activity: Columbus
Compensated Uncompensated
Leadership 317 15
Management 219 10
Data 451 11
Outreach 217 7
Child services 705 0
Coaching 781 3
Coordination 245 4
Family services 183 0
Adult education and
82 0
training
Source: Urban Institute analysis of time-use survey data.
20 APPENDIX BTABLE B.3
Estimated Hours by Activity: San Antonio
Compensated Uncompensated
Leadership 848 26
Management 968 25
Data 1,124 59
Outreach 901 122
Child services 861 15
Coaching 723 46
Coordination 416 24
Family services 158 12
Adult education and
138 15
training
Source: Urban Institute analysis of time-use survey data.
TABLE B.4
Estimated Hours by Role
Compensated Uncompensated
Buffalo
Frontline 1,548 28
Supervisory 1,194 21
Leadership 374 148
Columbus
Frontline 2,200 21
Supervisory 576 0
Leadership 423 28
San Antonio
Frontline 3,258 211
Supervisory 1,873 96
Leadership 1,005 37
Source: Urban Institute analysis of time-use survey data.
APPENDIX B 21You can also read