Capgemini Group
Environmental
Sustainability Report
2017/18
←
→
Page content transcription
If your browser does not render page correctly, please read the page content below

Capgemini Group Environmental Sustainability Report 2017/18
Welcome to the Capgemini Group
    Environmental Sustainability Update
     This report provides details of our environmental performance in 2017 and highlights the
     continued evolution of our approach to Environmental Sustainability.

    Scope:
    Unless stated otherwise, the data in this report covers the Environmental
    Sustainability activities of the Capgemini Group for the calendar year 2017.
    This report complements the information published in the CSR section of our
    Registration Document 2017, our Annual Report 2017 and our Integrated Report 2017.

    Feedback:
    We welcome feedback on our approach to Environmental Sustainability and the
    content of this report. Please email sustainability.reporting.uk@capgemini.com

    Find out more:
    For more information about our program please visit:
    www.capgemini.com/corporate-responsibility/

                                                                  Our Serge Kampf Les Fontaines Campus (France) is ISO 14001 certified, has a Green Star award and is EU Ecolabel certified
2   Capgemini Group Environmental Sustainability Report 2017/18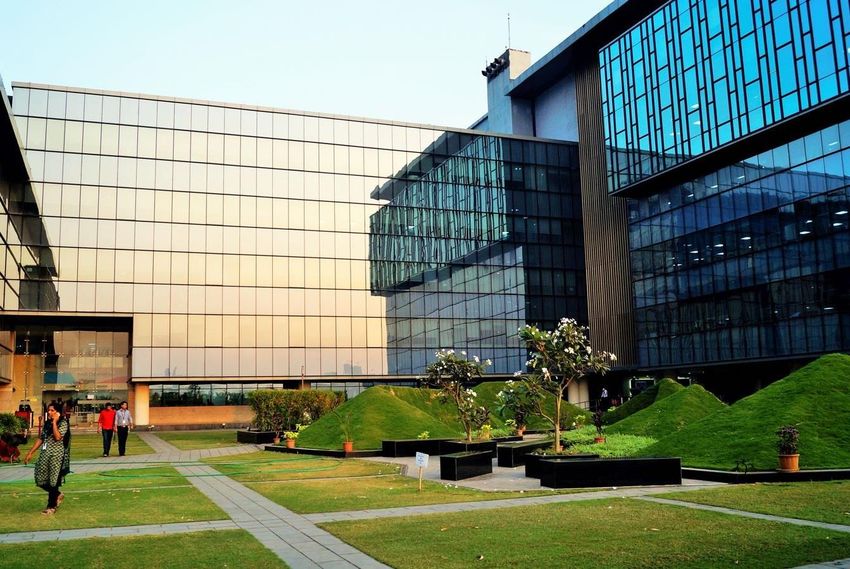
Contents
Executive Introduction …… 4
Capgemini at a glance …… 5
Our Approach to Sustainability …… 6
Our Performance at a Glance …… 8
Performance Scorecard …… 13
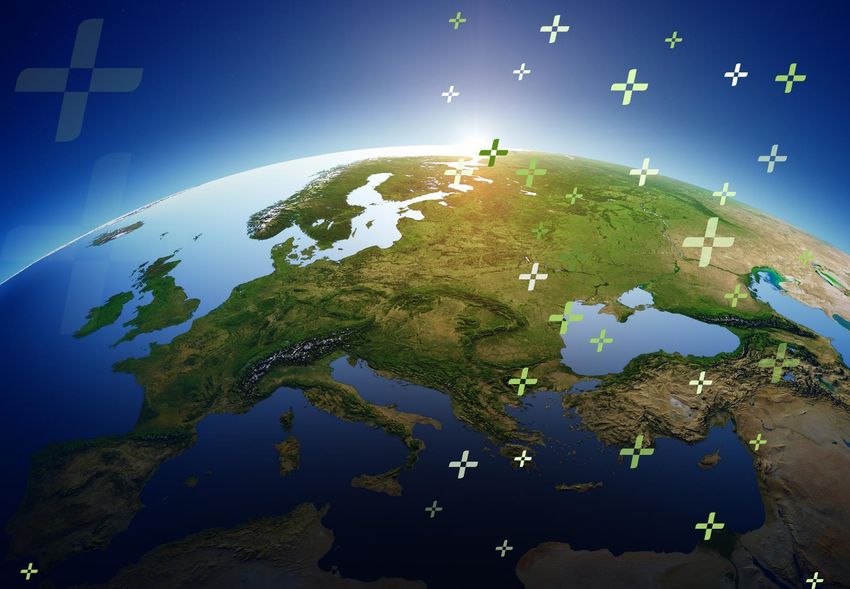
Airoli Campus, Mumbai, India - awarded LEED platinum status for its sustainability credentials
Capgemini Group Environmental Sustainability Report 2017/18 3
Executive Introduction

      Welcome to our 2017/18 Group Environmental Sustainability Update. In 2017,                Beyond reducing our own direct operational impacts, we recognize the greatest
      Capgemini celebrated our 50th birthday and announced a refreshed global CSR               contribution we can make to addressing global environmental challenges is through
      strategy, ‘Architects of Positive Futures’. We are committed to being a leading           the services we deliver to our clients, made possible through the talent and
      responsible company, using our expertise for positive impact. A key pillar of our         innovation of our people. We have been developing a deeper understanding of the
      enhanced strategy is our on-going commitment to Environmental Sustainability.             carbon benefits of our services and consequently, in 2017, we announced a new
                                                                                                global commitment to help our clients reduce their carbon emissions. Our goal is to
      Over the past decade, environmental concerns have climbed up the global agenda,           help our clients save 10 million tonnes CO2e by 2030.
      with climate change and its related impacts featuring in the World Economic Forum’s
      top five Global Risks every year since 2011. The 2018 Global Risk Report identifies       Addressing the climate challenge will require cross-sector collaboration and
      extreme weather events, natural disasters, and the failure of climate change              innovation for decades to come. We remain committed to playing our part in
      mitigation and adaptation, as the three most material risks currently facing the global   developing a more resilient and sustainable world for our current and the future
      economy. The need for action continues to become more urgent year on year.                generations.

      In response to these mounting challenges, Capgemini remains focused on reducing its
      own environmental impacts, using data-driven insights from our carbon management                            Dr James Robey
      approach to identify new opportunities for improvement. In 2018, we hosted an                               Vice President
      innovative Global Carbon Hackathon, enlisting the collective creativity and expertise                       Global Head of Environmental Sustainability
      of our people across the world to further explore our carbon emissions data and
      generate fresh insights.

        “     We recognize the greatest
        contribution we can make to addressing
        global environmental challenges is through
        the services we deliver to our clients, made
        possible through the talent and innovation

                                       ”
        of our people

4   Capgemini Group Environmental Sustainability Report 2017/18
Capgemini at a glance

      Our corporate vision                                        2017 full year results
      The business value of technology comes
      from and through people.                                    €12.8bn        11.7%            €1.1bn
                                                                    revenue   operating margin   free cash flow

                                                                  Global, entrepreneurial
                                                                  and multicultural
      COMPANY PROFILE
      A global leader in consulting, technology services
      and digital transformation, Capgemini is at the                                     200,000
      forefront of innovation to address the entire                                       employees in
      breadth of clients’ opportunities in the evolving
      world of cloud, digital, and platforms.                                             40+
      Building on its strong 50-year heritage and deep                                    countries from
      industry specific expertise, Capgemini enables
      organizations to realize their business ambitions
                                                                                          120+
      through an array of services from strategy to                                       nationalities
      operations. Capgemini is driven by the conviction
      that the business value of technology comes
      from and through people. It is a multicultural
      company of 200,000 team members in over 40                  Our Core Values
      countries. The Group reported 2017 global
      revenues of EUR 12.8 billion.

5   Capgemini Group Environmental Sustainability Report 2017/18
Our Approach to
Environmental Sustainability
We are committed to being Architects of Positive Futures, using our expertise for positive
impact on people and planet. Environmental Sustainability is core to our Architects of
Positive Futures program, with a focus on four main streams of activity:

        MANAGEMENT                                PERFORMANCE                                  ENGAGEMENT                                               RESILIENCE
 As a global company operating in over     Our performance stream focuses on the       Our most material environmental                    With climate change leading to an
 40 countries, we implement rigorous       continual reduction of our material         impact comes not from our own                      increase in extreme weather events, it is
 systems and processes to manage and       environmental impacts, including            operations, but through the services we            essential we take steps build resilience
 reduce our environmental impacts and      reducing energy consumption, business       deliver to our clients and through our             across our business.
 to respond to legislative requirements.   travel emissions and waste.                 supply chain.
                                                                                                                                          We have developed a Climate Change
 Central to our program is our ISO 14001   Actions and initiatives are driven at a     We are starting to embed sustainability            Risk Assessment process, using scientific
 certified global Environmental            country level but unified by a set of       into many of the services we offer with            research to identify the top climate
 Management System. This is deployed       ambitious global targets with an            the aim of supporting clients to achieve           hazards facing each country. We assess
 by our Sustainability Center of           overarching carbon reduction target         their sustainability objectives.                   the exposure of our people, assets,
 Excellence, who provide a consistent      which has been validated by Science         Sustainability is also core to our Supplier        offices and national infrastructure to
 and efficient approach for managing       Based Targets initiative (SBTi). The SBTi   Standard Code of Conduct, which we                 climate hazards and then model the
 our impacts.                              confirms that our goals are consistent      ask all suppliers to comply with.                  likely impacts of these hazards on our
                                           with the global effort to keep average                                                         business. By assessing areas of greatest
 We have also established a                temperature increase well below the         As a people business, we have a                    risk, we are able to prioritize developing
 comprehensive carbon accounting           2°C threshold agreed at the COP21           dedicated communications program to                mitigation strategies where they are
 system which accurately measures our      climate conference in Paris.                engage and inspire our people to take              needed most.
 environmental impacts across our global                                               action on environmental issues.
 operations.

           2017 Highlights                           2017 Highlights                              2017 Highlights                                       2017 Highlights
  82% of our operations are now             15% reduction in emissions per               Announcement of a new target to                   Five countries (covering two-thirds of
  certified under ISO 14001                 employee since 2015                          help clients save 10 million tonnes               the Group’s operations by headcount)
                                                                                         CO2e by 2030                                      deployed our Climate Change Risk
  Environmental impacts measured in         11% reduction in total energy use
                                                                                                                                           Assessment Process
  28 countries covering 99% of              since 2015                                   Over 200 people from 11 countries
  operations by headcount (1%                                                            took part in our first ever Carbon
  estimated)                                                                             Hackathon

                                                                                                                                     Capgemini Group Environmental Sustainability Report 2017/18   6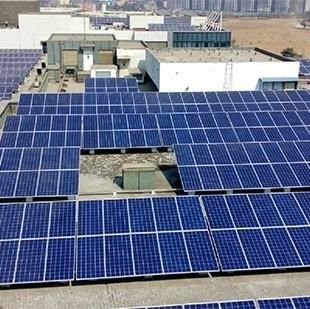
Environmental Reporting
    From data to insights to action

                                                                                              “
    It starts with the right data
    Good data is fundamental to making good decisions. Our sustainability program is
    underpinned by a comprehensive data set with around 10 million data points
                                                                                                   Our sustainability program is underpinned
    collected and analyzed each year. We strive to ensure our data is relevant,               by a comprehensive data set with around

                                                                                                                                                                        ”
    comprehensive, consistent, and complete, with one central team collating, processing
    and reporting the data and ensuring that our approach is aligned with the Greenhouse
    Gas Protocol Corporate Standard .
                                                                                              10 million data points collected each year
    We are part of the “100% Carbon Club”, a group of companies recognized by                 Improvement and transparency
    Bloomberg for their commitment to disclosing 100% of their Scope 1 and 2                  We are committed to continuously improving the quality of our data collection and
    greenhouse gas emissions. We go further than Scope 1 and 2 though, focusing on            analysis to inform our strategic decisions. In 2017, we enhanced our tracking of
    other material impacts including our business travel, water use, and waste disposal.      carbon emissions at a project level, giving us the capability to work more
    We ensure that the data we gather is relevant to our intended audience, for example       collaboratively with clients to reduce the carbon emissions associated with project
    using cost data to communicate the value of travel initiatives to the Finance team or     delivery. In addition, we have improved our approach for calculating hotel emissions,
    space utilization data to analyze energy use patterns for our Global Real Estate team.    drawing on a new database of country level hotel emission factors to increase the
                                                                                              accuracy of the hotel emissions data we report.

    Driving insights and action                                                               We are strong advocates of transparent and accessible reporting, which is partly why
    Good data is meaningless without the insights and creativity to bring it to life.         you will find an extensive data section at the back of this report, including three years
    Capgemini has an industry-leading expertise in Insights and Data, with extensive          of comparable data and detailed notes on our methodology. Reasonable assurance of
    experience in helping our clients to extract valuable insights from their data. We have   our key metrics, provided by KPMG, gives us an additional level of confidence that our
    strong internal expertise in carbon data analysis and use granular analysis to pinpoint   approach is robust and credible.
    and drive environmental improvements across the Group. For example, in France, we
    analyzed travel patterns and identified key flight routes which could easily be
    undertaken by rail, with a focus on routes which would reduce carbon without a
    significant impact on cost or time. Automated alerts are now triggered in our travel
    booking system when employees try to book these flight routes, encouraging them to
    book a rail journey instead.

    In 2017, we held our first ever Global Carbon Hackathon, drawing on our wider
    community of data experts to provide fresh insight on our carbon data. Over 200
    team members from 11 countries competed to develop the most creative data
    visualization tools and innovative ideas to reduce our carbon footprint. The winning
    idea, which will be further developed in 2018, combined a set of mapping tools                                                                       Figure 1: shows the key data
    visualizing our key impacts together with the concept for a mobile app to help                                                                      points captured by our global
    Capgemini teams collectively track and compete to reduce their travel impacts.                                                                         carbon accounting system

7   Capgemini Group Environmental Sustainability Report 2017/18
Environmental Performance
     At a glance
                                                                                                                             Five geographies account for over
     Our operational environmental impacts result from three main material aspects:                                          80% of our carbon footprint

                                                                                                                                     INDIA
                                                                                                                                     229,649 tCO2e
                                                                                                                                     46% of total Group emissions
                                                                                                                                     2.3 tCO2e per employee
               Business-related                                      Energy Use                    Disposal of Office                ↓17% vs 2015
                    Travel                                   (offices and data centers)                 Waste

     Our environmental impacts are measured across 99% of our operations (by headcount) with the remaining                           NORTH AMERICA
     1% extrapolated. The infographics below provide a breakdown of our carbon emissions in 2017.                                    80,041 tCO2e
                                                                                                                                     16% of total Group emissions
                                                                                      Our 6% reduction in absolute                   4.6 tCO2e per employee
                                                     F-Gas, Waste & Water             emissions in 2017 was driven by:               ↓ 16% vs 2015
         Data Center Energy
                                                     2,887 tCO2e
               38,626 tCO2e
                                                     1%
                        8%                                                                        7,039 tCO2e                        UNITED KINGDOM
                                                                                                  reduction in data center           36,945 tCO2e
                                                                                                  energy emissions                   7% of total Group emissions
                                                                                                                                     4.5 tCO2e per employee
                                                                                                  12,499 tCO2e                       ↓ 24% vs 2015
                                      497,973 tCO2e √                                             reduction in Business
                                                                                                  travel emissions
                                          ↓6%                                                                                        FRANCE
                                                                                                                                     34,027 tCO2e
                                           (vs. 2016)                                                                                7% of total Group emissions
                                                                                                  13,476 tCO2e                       1.5 tCO2e per employee
                                                                                                  reduction in office                ↓ 7% vs 2015
      Office Energy
                                                                    Business travel               energy emissions
    176,134 tCO2e √
               35%                                                  280,327 tCO2e √
                                                                    56%                                                              NETHERLANDS
                                                                                                                                     31,694 tCO2e
    Figure 2: shows the Capgemini Group carbon footprint in 2017 (in tonnes of CO2e) and the breakdown of our 6%                     6% of total Group emissions
    reduction in absolute carbon emissions against our 2015 baseline. √ mark indicates data points which have been                   5.2 tCO2e per employee
    reviewed by KPMG to a reasonable level of assurance.                                                                             ↓ 5% vs 2015
8    Capgemini Group Environmental Sustainability Report 2017/18
Cutting our Carbon Emissions

    We are committed to cutting our carbon emissions and were one of the first companies in our sector have our
    targets validated by the Science Based Target initiative (SBTi). The SBTi confirms that our goals are consistent
    with the global effort to keep average temperature increase well below the 2°C threshold agreed at the
    COP21 climate change conference in Paris.
                                                                                                                                                       “    We have reduced our emissions per
                                                                                                                                                       employee by 15% … meaning we are
                                                                                                                                                       already halfway towards meeting our

                                                                                                                                                                                ”
    Our Headline Target:                                                                                                                               2030 science-based target
      To reduce total carbon emissions per employee by 20% by 2020 and 30% by 2030
             Jan 2016

                                   Jan 2017

                                                         Jan 2018

                                                                               Jan 2019

                                                                                                     Jan 2020
                        Jul 2016

                                              Jul 2017

                                                                    Jul 2018

                                                                                          Jul 2019

                                                                                                                Jul 2020
        0%

       -5%
                                                                                                                            Emissions per head
                                                                                                                            (Actual)
     -10%
                                                                                                                            Emissions per head
                                                                                                                            (2020 Target Glide Path)
                                                           -15%
     -15%
                                                                                                                            Emissions per head
                                                                                                                            (2020 Target)
     -20%

     -25%
         Figure 3: Capgemini Group performance against our headline science-based target

    We have reduced our emissions per employee by                                                This progress has been achieved by reducing our
    15% (from from 2.99 tCO2e in 2015 to 2.53 tCO2e √                                            data center energy emissions by 25%, our office
    in 2017), meaning we are already halfway towards                                             energy emissions by 6%, and our business travel
    meeting our 2030 science-based target. In addition,                                          emissions by 3% since 2015. Details of how these
    we have decoupled our absolute carbon emissions                                              reductions have been delivered are presented on
    and business growth, reducing our total emissions                                            the following pages.
    by 6%, whilst growing our headcount by 11% and
    our annual revenues by 7% (to 12.8 billion euros).

9   Capgemini Group Environmental Sustainability Report 2017/18
Reducing our Energy Use
                        5%
                        reduction in office energy
                        use since 2015 driven largely
                                                           20%
                                                            reduction in data center
                                                            energy use since 2015 driven
                                                                                           24%
                                                                                           of total electricity use from
                                                                                           renewable sources in 2017.
                                                                                                                                    “      Solar installations at our
                                                                                                                                    Mumbai, Pune and Chennai
                                                                                                                                    campuses generate approximately
                        by energy efficiency                mainly by the closure of two   Operations in Belgium, Brazil,
                                                                                           Finland, Germany, Sweden,
                                                                                                                                    2.8 million kWh of electricity a
                        improvements and space              older, less efficient data
                        optimization projects.              centers in the UK.             the Netherlands, and the UK              year, the equivalent of powering

                                                                                                                                                                                ”
                                                                                           purchased over 70% of their
                                                                                           electricity from renewables.             2,600 Indian homes

We take a holistic approach to energy management
We consider energy efficiency in all aspects of our office and data center operations,     In 2016, we began a transformation program to create more agile, collaborative, and
from the smart management of lighting, heating, and cooling systems, to promoting          innovative workplaces across the Capgemini Group. In total, 78 workplace
behavior change initiatives to encourage our people to save energy on-site. Across         transformations have already been delivered with a further 36 due to be complete
the Group, we have reduced total energy use by 11% since 2015, driven by a 5%              by 2019. Across our estate, we are embracing a range of the energy efficiency
reduction in office energy use and a 25% reduction in data center energy use. Our          measures to reduce energy use. For example, we have completed LED lighting
energy reduction to date has been achieved largely through rationalizing our office        replacement projects in the UK, France, and India offices, as well as installing highly
space and data center capacity, as well as investing in new technology to improve the      efficient heating and cooling equipment in our UK and India offices. Consequently,
energy efficiency of our offices and data centers.                                         our energy use per square meter has reduced by 8% since 2015.

                                                                                           Investing in renewable energy
                                                                                           As well as controlling and reducing our energy use, we look for
                                                                                           opportunities to switch to cleaner, renewable energy sources. In 2017,
                                                                                           Capgemini entities in Belgium, Brazil, Finland, Germany, the
                                                                                           Netherlands, Sweden and the UK purchased over 70% of their
                                                                                           electricity from renewables, with Norway, India, and France also
                                                                                           purchasing significant amounts of renewable energy.

                                                                                           In addition, we have made investments in renewable energy
                                                                                           generation at some of our key sites, including a geothermal energy
                                                                                           system at our Serge Kampf Les Fontaines Campus in France and solar
                                                                                           PV and solar thermal generation at our Aston office in the UK. In India,
                                                                                           large-scale solar installations at our Mumbai, Pune and Chennai
                                                                                           campuses generate approximately 2.8 million kWh of electricity a year,
                                                                                           equivalent to the power consumed by 2,600 Indian homes.
Top left clockwise - Office Telford, England; Office New York, USA; Solar plant,
Pune, India; Office building Mumbai, India; Office Stockholm, Sweden.                                                                   Capgemini Group Environmental Sustainability Report 2017/18   10
Smarter with our Travel
3%
reduction in absolute
business travel emissions
12%
reduction in travel
emissions per employee
548 million
Skype minutes in 2017, an
increase of 54% since 2016,
“ The deployment of
integrated mobile, audio and
video conferencing technology
since 2015 largely driven by a since 2015 with a significant with a total of 5.2 million
conference calls held in 2017.
has been a key consideration in
7% reduction in air emissions reduction achieved in North
and an 8% reduction in car America (19%) and India the upgrade of our workspaces
”
emissions. (16%).
and IT infrastructure
We take an innovative approach to travel
The international and domestic travel we undertake as a Our business travel emissions reduced by 4% in absolute
business contributes to over half of our total carbon terms in 2017 (3% vs 2015), which is a significant
footprint. Whilst the mobility of our people is essential to achievement in a growing and globalizing business. On a
meet the needs of our global client base, we are committed per head basis, we reduced our travel emissions by 10% in
to smart and sustainable travel. 2017 (12% vs 2015).
Ensuring our people can connect seamlessly and securely We also promote the use of lower carbon transport for
from any location is critical to our approach. The travel to work, for example by providing apps for lift-
deployment of integrated mobile, audio and video sharing and ridesharing, offering hybrid and electric
conferencing technology has been a key consideration in company cars, and providing both practical support and
the upgrade of our workspaces and IT infrastructure. We financial incentives to encourage the uptake of taking
are seeing a continued growth in virtual communication public transport or cycling to work.
with a 20% increase in the number of Skype conference
calls in 2017 compared to 2016 and a 54% increase in the
number of minutes.
Promoting carpooling in India
In India, Capgemini has partnered with sRide, using a mobile app to promote ridesharing across a
number of our key office locations. sRide was introduced in March 2017 and over 25,300 employees
have signed up to the program, making Capgemini the largest user of the sRide app within the
technology sector. The program helps to cut emissions and reduce traffic congestion, whilst enabling
our people to save money and time on their journey to work and make new connections with their
colleagues. Team members offering a ride to work can benefit financially from a contribution to the
cost of their journey, or can choose to donate this fee to charity through our WeKare community
program. In 2017, a total of 2.1 million km were carpooled saving an estimated 370 tCO2e.
11 Capgemini Group Environmental Sustainability Report 2017/18Waste and Circular Economy
24 kg
of waste generated per
employee in 2017, which is
8%
reduction in total waste
generated since 2015, with
20%
reduction in landfill since
2015, with landfill reduced in
“ We increased recycling
rates significantly, meaning that
overall the weight of waste we
17% lower than the waste particularly strong progress most of our largest entities sent to landfill was 20% lower in
”
per employee generated in in France, Sweden, Spain, and a particularly significant
2015. North America and the increase in recycling rates in 2017 than in 2015
Netherlands. India and the UK.
We are embracing circular economy principles
Whilst waste emissions make up only a very small The concept of “circular economy” is the idea of
proportion of our carbon emissions (less than 1%), effectively “closing the loop” – maintaining products and
managing our waste effectively is important in terms of materials in a cyclical use phase so that waste is effectively
minimizing our use of finite natural resources. It is also a designed out of the system.
tangible, impactful way of demonstrating our
environmental commitments to our people. We have applied the principles of the circular economy in
numerous ways, from our innovative partnership with
We have reduced the total amount of waste we generate Nodixia in France (read more below), to localized
by 10% since 2015, a positive outcome given our initiatives such as swapping disposable cups with reusable
workforce increased by 11% over the same period. In ones, or replacing paper towels for high-efficiency hand
addition, we increased recycling rates, meaning that driers. We look for opportunities to partner with charities
overall the weight of waste we sent to landfill was 20% and universities to reuse stationary, furniture and IT
lower in 2017 than in 2015. equipment. For example, following our recent rebranding,
Capgemini Belgium collaborated with 10 local charities to
We remain committed to both minimizing the waste we re-use as many of items with the old branding as possible,
generate and increasing recycling and reuse. However, the with an estimated 10 cubic meters of clothing and
most efficient way of reducing the environmental impacts stationary diverted from landfill.
from waste is not to generate waste in the first place.
Closing the loop on E-Waste in France
In France, we have established a program to ensure reuse and recycling of old phones and computers. The "Je
recycle & Je gagne” initiative involves purchasing employees’ smartphones at a competitive price for reuse and
recycling. Our people can also buy reconditioned PCs or smartphones at prices up to 70% cheaper than buying a
new one. Through a collaborative partnership with Nodixia, Capgemini France has reconditioned more than 93%
of our old computers for reuse. This initiative also has social benefits, with Nodixia employing people with
disabilities and reinvesting part of the profits in innovative social projects.
Capgemini Group Environmental Sustainability Report 2017/18 12Performance
Scorecard
13 Capgemini Group Environmental Sustainability Report 2017/18TABLE 1: CARBON EMISSIONS BY SCOPE
Metric Unit 2015 Total 2016 Total 2017 Total % Change vs 2015
To reduce our carbon footprint per employee3 T CO2e per
TARGET 2.99 2.86 2.53√ -15.4%
by 20% by 2020 and 30% by 2030 employee
Office Energy (natural gas, diesel and LPG) T CO2e 6,032 6,480 5,568 -7.7%
Data Center Energy (natural gas and diesel) T CO2e 289 255 220 -23.8%
Scope 1
F gas T CO2e 1,491 1,232 984 -34.0%
TOTAL Scope 1 T CO2e 7,811 7,966 6,772 -13.3%
Office Energy (electricity, heating, cooling) T CO2e 152,489 150,966 139,453 -8.5%
Scope 2
(Location- Data Center Energy (electricity) T CO2e 48,454 42,187 35,715 -26.3%
Carbon Emissions Based)
TOTAL Scope 2 T CO2e 200,943 193,153 175,168 -12.8%
by Scope
Business Travel T CO2e 288,045 292,825 280,327 -2.7%
Office Energy (T&D losses) T CO2e 29,064 32,164 31,113 7.1%
Data Center Energy (T&D losses) T CO2e 3,621 3,223 2,691 -25.7%
Scope 3
Water T CO2e 1,585 1,340 1,330 -16.1%
Waste T CO2e 394 705 572 45.2%
TOTAL Scope 3 T CO2e 322,710 330,258 316,033 -2.1%
TOTAL TOTAL EMISSIONS T CO2e 531,463 531,378 497,973√ -6.3%
Scope 2
Market-Based Total Market-Based Emissions (electricity and district
(Market- T CO2e 162,039 157,665 138,238 -14.7%
Emissions heating emissions)
Based)
Notes
1. Data identified in these tables by a √ mark has been reviewed by KPMG with a reasonable level of assurance.
2. Data included in the tables over the next few pages differs from that reported in our Annual Financial Report and our Integrated Report due to replacement of Q4 2017 estimates with actual data, an update to the hotel emission
factors (for all years) and an update to IEA emission factors (for 2017) as well as a number of minor data corrections applied (to all years). These changes have reduced our reported 2017 total emissions by 0.36% (compared to the
figure published in our (Registration Document 2017).
3. “Scope” is a reporting term from Greenhouse Gas Protocol, which is used in carbon accounting to categorize emissions reported according to the level of control a company has over an emissions source.
4. With the exception of electricity emissions, all emission sources have been calculated using the emission factors recommended by DEFRA: https://www.gov.uk/measuring-and-reporting-environmentalimpacts-guidance-for-businesses
5. Electricity emissions have been calculated in the main body of the table above in line with the GHG Protocol’s “location-based” approach. Regional electricity emission factors for UK (DEFRA 2017), the US (eGrid), Canada (NIR 2015)
and Australia (NGA 2015) are used. For all other countries, emission factors from International Energy Agency (IEA) have been applied to calculate Scope 2 location-based approach.
6. As recommended by the GHG Protocol, emissions of Fluorinated Gas (F-gas) not covered by the Kyoto Protocol (such as CFCs) are not reported as Scope 1 emissions and are therefore not included above. These F-gas emissions are,
however, captured with a value of 1,656 tonnes CO2e for 2017.
7. “T&D losses” refers to electricity transmission and distribution grid losses i.e. the energy loss that occurs in transmitting the electricity from the generation source to our facilities.
8. The “Market-based emissions” given in the final row are a recalculation of Scope 2 emissions using the GHG Protocol’s market-based approach. Where possible, market-based emissions have been calculated using supplier-specific
emission factors. Where these are not available we have used a residual fuel mix factor, sourced for from RE-DISS for countries in Europe and from green-e.org for US and Canada. For a few smaller entities, we have assumed an
emission factor of 0 for electricity purchased on renewable energy tariffs. In locations where neither supplier-based nor residual fuel mix factors are available we have used a location-based emission factor.
14 Capgemini Group Environmental Sustainability Report 2017/18TABLE 2: CARBON EMISSIONS BY SCOPE BY REGION (2017)
North Other Latin Other Estimated
Metric Unit India UK France Netherlands
America Europe America Regions Countries
To reduce our carbon footprint per employee T CO2e per
TARGET 2.31 4.63 4.54 1.47 5.17 2.24 1.02 2.21 2.33
by 20% by 2020 and 30% by 2030 employee
Office Energy
T CO2e 2,643 69 723 958 166 934 19 0 56
(natural gas, diesel, LPG)
Data Center Energy
T CO2e 0 51 51 71 18 29 0 0 0
(natural gas, diesel)
Scope 1
F gas T CO2e 779 0 89 0 0 0 107 0 10
TOTAL Scope 1 T CO2e 3,422 119 863 1,028 184 964 126 0 66
Office Energy
T CO2e 106,977 5,978 3,893 1,945 1,987 11,843 1,427 3,995 1,407
(electricity, heating, cooling)
Data Center Energy (electricity) T CO2e 0 11,248 11,499 1,926 7,132 3,358 355 198 0
Scope 2
Carbon
Emissions TOTAL Scope 2 T CO2e 106,977 17,226 15,392 3,870 9,119 15,201 1,782 4,193 1,407
by Scope
(Location Business Travel T CO2e 89,614 61,316 19,198 28,698 21,905 42,870 6,204 7,702 2,820
Based)
Office Energy (T&D losses) T CO2e 28,358 417 364 145 99 911 126 380 314
Data Center Energy (T&D losses) T CO2e 0 872 1,075 159 356 188 26 15 0
Scope 3 Water T CO2e 993 22 46 55 14 118 31 38 13
Waste T CO2e 285 68 8 72 18 88 9 19 6
TOTAL Scope 3 T CO2e 119,250 62,695 20,690 29,128 22,392 44,175 6,397 8,154 3,153
TOTAL EMISSIONS T CO2e 229,649 80,041 36,945 34,027 31,694 60,340 8,304 12,347 4,626
Market- Scope 2 Total Market-Based Emissions Market-
Based (Market- (electricity and district heating Based 98,111 15,970 4,320 1,289 192 13,339 823 4,193 0
Emissions Based) emissions) Emissions
Notes
1. For this table, and the Region tables that follow, we display data for Capgemini entities with the highest emissions (India, North America, UK, France and The Netherlands), as ordered by size of total emissions. For the other 22
countries where we measure emissions these are summarised in the Other Europe, Latin America and Other Regions columns. For just under 1% of our operations by headcount, we do not collect environmental data as part of the
Group program. For these entities we include an estimate for emissions in the column “Estimated Countries”.
2. Estimated Countries include Austria, Chile, Colombia, Hong Kong, Hungary, Japan, Malaysia, Portugal, Russia, Singapore, Slovakia, Taiwan, and United Arab Emirates.
15 Capgemini Group Environmental Sustainability Report 2017/18TABLE 3: ENERGY USE
Metric Unit 2015 Total 2016 Total 2017 Total Change vs 2015
Key Metric Office Energy MWh 296,565 293,907 280,313√ -5.5%
Natural Gas MWh 16,980 16,918 15,206 -10.4%
Diesel & LPG MWh 10,587 12,353 10,138 -4.2%
Renewable Electricity MWh 43,297 52,180 40,435 -6.6%
Office Other Electricity MWh 217,920 203,396 207,398 -4.8%
District Heating MWh 6,137 7,334 5,413 -11.8%
Office Cooling MWh 1,644 1,726 1,722 4.7%
% Electricity from Renewables % 16.6% 20.4% 16.3% -0.3%
Key Metric Data Center Power Usage Effectiveness Average PUE 1.71 1.76 1.76 7.4%
Natural Gas MWh 355 237 32 -91.0%
Diesel MWh 823 765 775 -5.8%
Renewable Electricity MWh 72,979 57,559 49,406 -32.3%
Data Center
Other Electricity MWh 90,687 91,983 81,787 -9.8%
Total Data Center Energy Use MWh 164,845 150,544 132,000 -19.9%
% Electricity from Renewables % 44.6% 38.5% 37.7% -6.9%
Total Energy Use MWh 461,409 444,451 412,313√ -10.6%
TOTAL ENERGY
% of Total Electricity from Renewables % 27.4% 27.1% 23.7% -3.7%
Notes
1. “Renewable Electricity” includes all renewable electricity purchased on renewable energy tariffs or through renewable energy certificates as well as a small amount of electricity generated on-site in India and the UK using solar
photovoltaic panels. “Other electricity” includes purchased electricity generated from other sources such as nuclear or fossil fuels.
2. Given the nature of our business, many of Capgemini’s offices have large server rooms. These are not considered to be data centers but their presence should be taken into consideration when comparing the energy usage of our
offices against those in other sectors.
3. Data Center Power Usage Effectiveness (PUE) is a standard industry measure of how energy efficient a data center is. To track the energy efficiency of our data centers across the Group, we use a simple average of the PUE across
multiple data centers.
16 Capgemini Group Environmental Sustainability Report 2017/18TABLE 4: ENERGY USE BY REGION (2017)
North Other Latin Other Estimated
Metric Unit India UK France Netherlands
America Europe America Regions Countries
Key Metric Total Office Energy Use MWh 151,131 15,118 15,089 44,033 4,990 35,348 5,865 5,910 2,829
Total Office Energy Emissions T CO2e 137,978 6,464 4,980 3,047 2,252 13,689 1,572 4,375 1,777
Offices
% Office Electricity from
% 8.3% 0.0% 86.7% 11.6% 91.6% 4.4% 41.7% 0.0% 15.4%
Renewables
Average
Key Metric Data Center PUE N/A 1.69 1.75 1.92 1.76 1.71 1.90 N/Av N/A
PUE
Total Data Center Energy Use MWh N/A 29,115 32,905 41,845 14,655 10,914 2,264 302 N/A
Data Centers Data Center Energy Emissions T CO2e N/A 12,171 12,625 2,155 7,506 3,576 381 213 N/A
% of Data Center Electricity from
% N/A 0.0% 70.7% 0.0% 100.0% 86.6% 100.0% 0.0% N/A
Renewables
Total Energy Use MWh 151,131 44,233 47,994 85,879 19,645 46,262 8,130 6,212 2,829
Total Energy Emissions T CO2e 137,978 18,635 17,605 5,202 9,758 17,264 1,953 4,587 1,777
TOTAL ENERGY
% of Total Electricity from
% 8.3% 0.0% 74.7% 5.5% 98.2% 23.5% 53.2% 0.0% 15.4%
Renewables
Notes
1. France: Due to the non-availability of reliable data from the energy supplier, 80% of electricity consumption for all offices in France has been estimated. This estimation is based on the energy usage per floor area derived from 2014
actual data, with the data adjusted to take account of the floor area of each facility. France’s estimated data accounts for approximately 8.9% of total Group energy use, 11.2% of total office energy use and 0.4% of total GHG
emissions.
2. For all regions, office energy emissions and data center energy emissions have been calculated using the GHG Protocol location-based approach.
3. N/A (Not Applicable) is used to indicate regions where we do not have a data center.
4. N/Av (Not Available) is used to indicate regions where the data is not currently available
17 Capgemini Group Environmental Sustainability Report 2017/18TABLE 5: BUSINESS TRAVEL
Metric Unit 2015 Total 2016 Total 2017 Total % Change vs 2015
Key Metric Total Business Travel Emissions T CO2e 288,045 292,825 280,327√ -2.7%
Emissions from Air Travel T CO2e 183,014 184,378 170,689 -6.7%
Emissions from Car Travel T CO2e 64,663 60,830 59,729 -7.6%
Emissions from Hotel Nights T CO2e 28,157 34,815 36,842 30.8%
Travel
by Source
Emissions from Rail Travel T CO2e 5,776 6,237 6,627 14.7%
Emissions from Taxi Travel T CO2e 5,148 5,230 5,107 -0.8%
Emissions from Other Modes of Transport T CO2e 1,287 1,335 1,332 3.5%
Travel per Head Total Business Travel Emissions per Employee T CO2e/ employee 1.62 1.57 1.42 -12.1%
Notes
1. Hotel emissions have been recalculated for all years based on new emission factors provided by DEFRA. In previous reports, average factors were used for all countries. In this report, emissions are calculated based on emission
factors specific to the country in which the traveler is staying. For some countries, emission factors were not available from DEFRA and therefore have been sourced directly from https://www.hotelfootprints.org (DEFRA emission
factors are derived from the same data set).
2. “Emissions from Other Modes of transport” includes travel from other modes of transport including bus travel, tram travel and private motorbike.
3. Where mileage data is not available, emissions have been estimated by taking the cost data within that country and applying the average cost per mile ratio from other data within that country or region.
18 Capgemini Group Environmental Sustainability Report 2017/18TABLE 6: BUSINESS TRAVEL BY REGION (2017)
North Other Latin Other Estimated
Metric Unit India UK France Netherlands
America Europe America Regions Countries
Key Metric Business Travel Emissions T CO2e 89,614 61,316 19,198 28,698 21,905 42,870 6,204 7,702 2,820
Emissions from Air Travel T CO2e 62,432 48,094 9,521 14,616 4,454 18,801 4,836 6,213 1,722
Emissions from Car Travel T CO2e 11,629 4,473 3,408 8,355 15,664 15,434 153 9 603
Emissions from Hotel Nights T CO2e 13,148 7,857 4,564 2,403 770 5,431 908 1,398 363
Travel
by Type
Emissions from Rail Travel T CO2e 291 90 1,229 2,916 648 1,382 0 4 67
Emissions from Taxi Travel T CO2e 2,088 797 386 407 73 923 307 76 52
Emissions from Other Modes of
T CO2e 26 5 90 0 296 900 0 3 13
Transport
Notes
1. In the Netherlands, Belgium, Luxembourg and Germany, emissions associated with car travel have been recalculated since previous reports with a 37% reduction applied to account for personal use of the leased cars. The car
emissions in these countries are still likely to be over-reported as they include emissions related to car travel to work (which cannot currently be separated from business journeys)
2. India: The data reported for 3-wheeler travel in India has been uploaded under “Motorbike” as DEFRA does not provide a separate emission factor for a 3-wheeler.
3. India: New rail and taxi expenses data for Capgemini India became available for the first time in 2017. Since corresponding data for 2015 and 2016 was not available, emissions for previous years have been estimated.
4. India: Guest house data for India was reported for all employee stays in guest houses for the first time in 2017. Since corresponding data for 2015 and 2016 was not available, emissions for previous years have been estimated based
on 2017 data. As no emission factors for guest houses are currently available, the emissions stated above assume that the emission from 1 guest house room night are equivalent to 0.13 of the emissions from 1 hotel night in India.
19 Capgemini Group Environmental Sustainability Report 2017/18TABLE 7: WASTE & WATER USE
Change
Metric Unit 2015 Total 2016 Total 2017 Total
vs 2015
Waste to Landfill Tonnes 3,656 3,345 2,966 -18.9%
Waste Recycled Tonnes 1,319 1,108 1,406 6.6%
Waste by Disposal
Method
Waste to Energy Tonnes 117 145 141 20.4%
Waste to Anaerobic Digestion Tonnes N/Av 4 167 100.0%
Total Waste Tonnes 5,093 4,601 4,680 -8.1%
Total Waste Total Waste Emissions T CO2e 394 705 572 45.2%
% of Waste Diverted from Landfill % 28.2% 27.3% 36.6% 8.4%
Total Water Use Cubic meters 1,505,927 1,274,128 1,264,348 -16.0%
Water Use
Total Water Emissions T CO2e 1,585 1,340 1,330 -16.1%
Notes
1. The availability of accurate waste and water data varies considerably across the Group, depending on the type of site, the type of lease and local waste arrangements. Where actual data is not available, it has been estimated using
relevant estimation methods.
2. We began collecting data on waste disposed by anaerobic digestion in 2016.
3. The waste emissions factor for landfilled waste nearly doubled in 2016 compared to 2015, which is the reason why our waste emissions have increased by 95% in 2016, even though our total waste generation has remained fairly
stable.
4. As recommended by DEFRA we calculate both the emissions associated with water supply and the emissions associated with water treatment. As the volume of water being sent for treatment is not currently metered, we have made
an assumption that it is the same as the volume of water supplied.
5. N/Av (Not Available) is used where the data is not currently available
20 Capgemini Group Environmental Sustainability Report 2017/18TABLE 8: WASTE & WATER USE BY REGION (2017)
North Other Latin Other Estimated
Metric Unit India UK France Netherlands
America Europe America Regions Countries
Waste to Landfill Tonnes 562 675 14 669 166 575 90 187 29
Waste Recycled Tonnes 488 38 219 213 52 362 18 3 14
Waste by
Disposal Method
Waste to Energy Tonnes 0 0 61 0 0 78 0 0 1
Waste to Anaerobic Digestion Tonnes 148 0 0 0 0 17 0 0 2
Total Waste Tonnes 1,198 713 294 882 217 1,032 108 190 47
Total Waste Total Waste Emissions T CO2e 285 68 8 72 18 88 9 19 6
% of Waste Diverted from landfill % 53.1% 5.4% 95.1% 24.2% 23.7% 44.3% 17.1% 1.3% 37.0%
Cubic
Total Water Use 943,779 20,735 43,323 52,166 13,593 111,857 29,749 36,461 12,685
meters
Water Use
Total Water Emissions T CO2e 993 22 46 55 14 118 31 38 13
21 Capgemini Group Environmental Sustainability Report 2017/18KPMG Assurance Statement
Cap Gemini S.E.
Headquarters: 11, rue de Tilsitt, 75017 Paris
Report by one of the Statutory Auditors, on a selection of environmental indicators published in Capgemini Group
Environment Report 2017-2018
For the year ended December 31, 2017
To the Shareholders,
As requested and in our capacity as Statutory Auditor of Capgemini Group Statutory Auditor’s responsibility
(hereinafter named the “Company”), we hereby report to you on a selection of On the basis of our work, our responsibility is to express, at the request of the
consolidated environmental information for the year ended December 31, Company, reasonable assurance that the CSR information selected by the
2017, identified by the symbol √ (hereinafter named "CSR Information") and Company and identified by the symbol √ [1] in the CSR report is fairly
disclosed in the Capgemini Group Environment Report 2017-2018 of the presented, in all material respects, in accordance with the Guidelines. The
Company (hereinafter the “CSR report”). conclusions given below relate solely to the CSR Information and not to the
Company’s CSR report as a whole.
Company’s responsibility
The Corporate Social Responsibility & Sustainability division is responsible for We were assisted in our work by our CSR experts. We performed our work in
preparing the CSR Information in accordance with the guidelines used by the accordance with ISAE 3000[2] and in compliance with the professional
Company (hereinafter the "Guidelines"), summarised in the methodological guidelines applicable in France.
notes presented in the CSR report and available on request from the
company’s headquarters. Reasonable assurance on a selection of CSR Information
Independence and quality control Nature and scope of our work
Our independence is defined by regulatory texts, the French Code of ethics We conducted interviews with the persons responsible for preparing the CSR
(Code de déontologie) of our profession and the requirements of article L.822- Information in the departments in charge of collecting the information and,
11-3 of the French Commercial Code. In addition, we have implemented a where appropriate, responsible for internal control and risk management
system of quality control including documented policies and procedures procedures, in order to:
regarding compliance with the ethical requirements and applicable legal and • assess the suitability of the Guidelines in terms of their relevance,
regulatory requirements. completeness, reliability, neutrality and understandability, and taking into
account industry best practices where appropriate;
• verify the implementation of data-collection, compilation, processing and
control process to reach completeness and consistency of the CSR
Information and obtain an understanding of the internal control and risk
management procedures used to prepare the CSR Information.
[1] Office direct energy consumption, Total direct energy consumption, GreenHouse Gas emissions related to business travel, Total GreenHouse Gas emissions, Total GreenHouse Gas
emissions per employee.
[2] ISAE 3000 – Assurance engagements other than audits or reviews of historical financial information.
21 Capgemini Group Environmental Sustainability Report 2017/18We determined the nature and scope of our tests and procedures based on Conclusion
the nature and importance of the CSR Information with respect to the In our opinion, the CSR information selected by the Group and identified by
characteristics of the Company, the human resources and environmental the symbol √ in the CSR report is fairly presented, in all material respects, in
challenges of its activities, its sustainability strategy and industry best compliance with the Guidelines.
practices.
At the Group level, we performed analytical procedures on the CSR
information and verified, using sampling techniques, the calculation and the
consolidation of the data.
At the level of a representative sample of entities selected by us[3] on the
basis of their activity, their contribution to the consolidated indicators, their
location and a risk analysis, we conducted interviews to verify that procedures
are properly applied and to identify potential undisclosed data, and we
performed tests of details, using sampling techniques, in order to verify the
calculations and reconcile the data with the supporting documents. The
selected sample represents between 66% and 79% of the CSR information.
We consider that this work enables us to express a conclusion of reasonable
assurance for the information selected by the Group and identified by the
symbol √.
Due to the use of sampling techniques and other limitations inherent to
information and internal control systems, the risk of not detecting a material
misstatement in the CSR information cannot be totally eliminated.
[3] Capgemini India, Capgemini France, Capgemini Brazil, Capgemini Poland, Capgemini North America.
21 Capgemini Group Environmental Sustainability Report 2017/18About Capgemini
A global leader in consulting, technology services and digital
transformation, Capgemini is at the forefront of innovation to address
the entire breadth of clients’ opportunities in the evolving world of
cloud, digital and platforms. Building on its strong 50-year heritage and
deep industry-specific expertise, Capgemini enables organizations to
realize their business ambitions through an array of services from
strategy to operations. Capgemini is driven by the conviction that the
business value of technology comes from and through people. It is a
multicultural company of 200,000 team members in over 40 countries.
The Group reported 2017 global revenues of EUR 12.8 billion.
Learn more about us at
www.capgemini.com
This message contains information that may be privileged or
confidential and is the property of the Capgemini Group.
Copyright © 2018 Capgemini. All rights reserved.
Rightshore® is a trademark belonging to Capgemini. This message is intended only for the person to whom it is addressed. If you are not the
intended recipient, you are not authorized to read, print, retain, copy, disseminate, distribute,
or use this message or any part thereof. If you receive this message in error, please notify the
sender immediately and delete all copies of this message.You can also read