Unlocking Climate Finance to Accelerate Energy Access in Africa 04 22 2021 - Prepared by
←
→
Page content transcription
If your browser does not render page correctly, please read the page content below
04 22 2021

Unlocking Climate Finance
to Accelerate Energy Access
in Africa

Prepared by

                              1
Commissioned by

                             Produced by

           Backup genset research produced in association with

Inputs from a Technical Working Group, comprised of representatives from

  Backup genset research was based on previous work commissioned by

        The Report is endorsed by key DRE industry associations

                                                                           2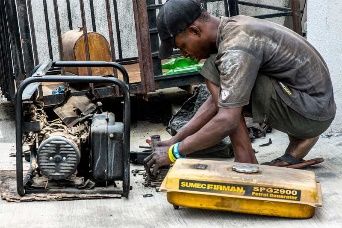
Table of Contents

  01   Summary

        02   Context
             o   Linking SDG 7 to SDG 13
             o   Why Africa’s electricity access deficit matters
             o   Africa’s backup genset epidemic
             o   Why clean cooking matters for Africans

                       03         Pillars of SDG 7
                                o   Pillar 1: Electricity Access
                                o   Pillar 2: Greening Back-up Gensets
                                o   Pillar 3: Improved Cooking

                                                      04           Call to Action

                                                                                    3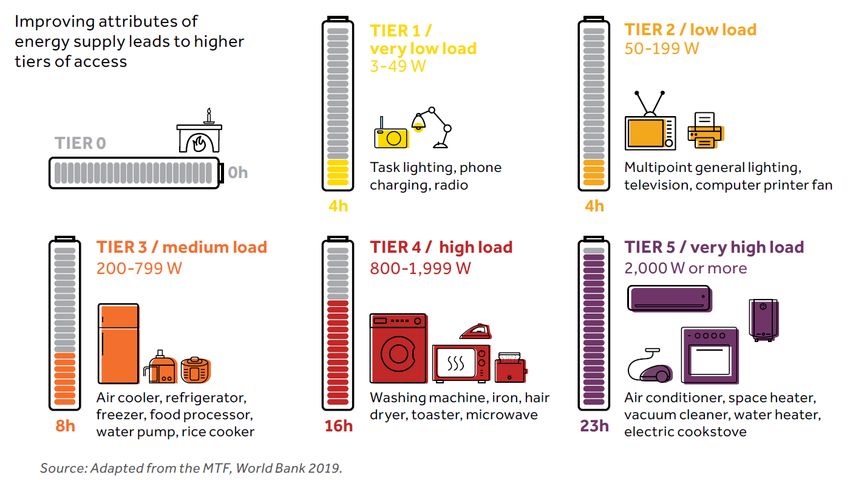
UNLOCKING CLIMATE FINANCE TO ACCELERATE ENERGY ACCESS IN AFRICA

Summary

                                                                       4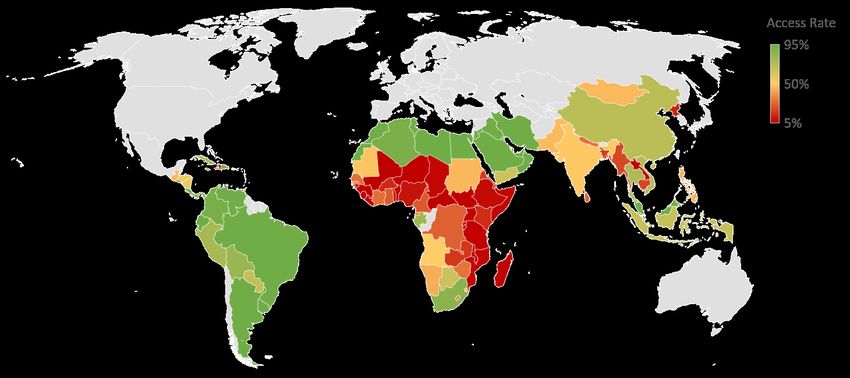
Summary

      This research demonstrates the business opportunity to unlock
      billions in climate finance and deliver on multiple SDG goals
                                                       • Our 2018 research demonstrated the financing
                                                         opportunity to achieve universal household
                                                         electrification in Africa (SDG 7) via off-grid solutions

                                                        • This research will show off-grid solar’s social dividends,
                                                          which cut across numerous SDGs1

                                                         • Alongside the climate dividends attributable to low-
                                                           carbon SDG 7 scenarios

                                                         • It forecasts the climate finance opportunity associated
                                                           with these low-carbon SDG 7 scenarios

                                                        • Illustrating the multi-billion-dollar climate finance
                                                          opportunity associated with the low-carbon scenarios

 1 Forthcoming   research will illustrate how DREs impact SDGs 1, 5, 8, and 10.                                        5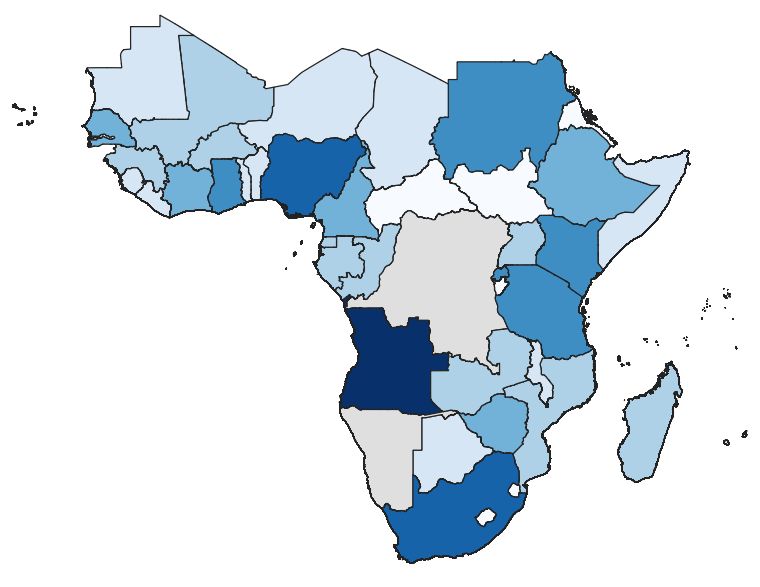
Summary

         Research focus: predictive modeling illustrates Africa’s low-
         carbon SDG 7 scenarios and the impact they will have on SDG 13
  •        SDG 7: Ensure access to affordable, reliable, sustainable and modern energy for all
  •        SDG 13: Take urgent action to combat climate change and its impacts

         Universal access to                                                        High carbon scenario
      modern, reliable electricity                                                toward electricity access
               by 2030

                Social Imperative1

             210 million households
                  connected
                                                                       Africa GHG emissions from access
                                                                                                                  Reduce 41% of
                                                                                                                 global emissions

                                                                              2°C or less low carbon scenario
                                                                                 toward electricity access      Climate Imperative

 1   Forthcoming research will illustrate how DREs impact SDGs 1, 5, 8, and 10.                                                      6
Summary

    Africa’s key energy trends and their climate impacts
    illustrate the scope of the SDG 7 and SDG 13 challenges
             Electricity access          Unreliable grid access            Clean cooking

          70% of African                 Two-thirds of African
                                         grids are considered           82% of Africa’s population
          households are                                                (890 million people) use
          unelectrified, meaning         unreliable, with enterprises
                                         experiencing an average of     solid fuels for primary
          200M need to be                                               cooking needs
          connected to reach SDG 7
                                         10% downtime, and 8%
                                         revenue losses
          Africa is falling behind the
          rest of the world on           As a consequence, there are    600,000 Africans are killed
          electricity access, hosting    ~ 7 million backup             annually from household air
          69% of the world’s             gensets deployed on the        pollution, making   it the
                                                                                         Clean     2nd
                                                                                                cooking
                                                                        largest health risk on the
          unelectrified households       continent, equivalent to 120   continent
                                         coal power stations
          On top of that, Africa
          remains heavily dependent
          on fossil fuels, which         These gensets consume          600 Mt CO2 comes from
          accounts for 68% of            US$13 billion/year             solid cooking in Africa alone
          electricity generation         of fossil fuels

                                                                                                          7
Summary

    Low-carbon scenarios accelerate Africa’s achievement of SDG 7
    and SDG 13 via 3 pillars
  Predictive modeling forecasts three scenarios for each thematic pillar: business-as-usual, high-carbon,
  and low-carbon, shows the avoided emissions between the latter two, and then provides the
  investment costs associated with the low-carbon scenario
           Pillar 1                 Pillar 2                      Pillar 3

      Electricity                   Greening
                                                                 Modern                 Africa’s climate
                                                                 cooking
        access                      back-up
                                                                  access
                                                                                            finance
          Providing                generation                                            opportunity
          first-time                                             Moving HH
                                   Solving the
          electricity             unreliable grid
                                                                unto modern              Improving access,
            access                                                 cooking              reducing emissions
                                    challenge
                                                                  solutions

 What will it take to       What’s required to get         What is a credible         What level of CO2e
 provide first time         enterprises and                scenario to move a         emissions are
 electricity access in      households to transition       portion of African         avoided via each
 Africa via a low-          off back-up generators         households onto            pillars’ low-carbon
 carbon trajectory          and onto decentralized         modern cooking             scenario? What is
 that avoids millions       renewable sources of           solutions?                 the associated
 of tons of CO2e            power?                                                    climate finance
 emissions?                                                                           opportunity?

                                                                                                             8
Summary

               These scenarios avoid 563-626 million tons of CO2 , deliver significant
               SDG 7 impacts, and unlock a substantial climate finance opportunity
      Emissions from plausible low-carbon scenarios are benchmarked against equally plausible high-carbon
      counterfactuals; the difference between the two constitutes the avoided emissions
                                             Tier 1      MEM
                                                                           205
                            800                                  268     Mt CO2
                                                               Mt CO2    avoided
                            700                                avoided
                                                                                                                                                                                                  132
                            600                                           ∆                                                      226
                                                                                                                                                                                                Mt CO2
                                                                                                                               Mt CO2
                                                                                                                                                                                                avoided
       Emissions (Mt CO2)

                                                                   ∆                                                           avoided
                            500
                                                                                                                                                                                                   ∆
                            400
                                                                                                                                  ∆
                            300

                            200

                            100

                             0
                                  BAU         High-carbon        Low-carbon              BAU              High-carbon           Low-carbon                BAU              High-carbon           Low-carbon
                                                    Access                                                   Back-up                                                         Cooking

                                        130 million households                                                                                                     37 million households
      Impact
                                                                                              9.2 million gensets retired
                                         get first time access                                                                                                        using clean fuels

  Financing                              $20.7B              $67.1B                                       $134.4B                                                              $7.5B
 opportunity                             (Tier 1)            (MEM)                 TOTAL:      $162.6B (Tier 1), $209B (MEM)                                        Source: Catalyst predictive model outputs

  1The Tier 1 scenario sees expansion of all access technologies (grid, mini-grid, and OGS of various sizes) but the majority of low- and lower-middle income households get access via Tier 1 OGS technologies.
                                                                                                                                                                                                                   9
  The Modern Energy Minimum (MEM) scenario targets per capita annual consumption of 130 kWh by 2030 and thus more households need mini-grid connections and Tier 2 and 3 OGS systems as a result.
Summary
Summarizing each pillar’s social and climate impacts, and the
associated climate finance needs of each low-carbon scenario
avoided financing
BAU1 @ 2030 impact technology mix
emissions opportunity
Pillar 1: Electricity
Electricity Access Access
• 43% Off-grid
Tier 1 $20.7 billion
• 2% Mini-grid 268.1 Mt CO2
• 100% HH access • 55% Grid
• 69% household
• 186 million new
(HH) access rate
HH connections
• 35% Off-grid
MEM
• 10% Mini-grid 205 Mt CO2 $67.1 billion
• 55% Grid
Pillar 2: Greening
Greening Back-up Generators
Back-up Generator
• Gensets that
• 9.2 million back- • Each year, 50% of
reach end-life are
Back-up gensets replaced
up gensets end-life gensets 226.4 Mt CO2 $134.4 billion
displaced w/ DRE replaced w/DREs
w/fossil-gensets
Pillar 3: Improved
Improved Cooking Cooking
• 39 million HHs • 39 million HHs • 60% LPG
Clean Cooking continue to cook transition to • 22% electricity
131.7 Mt CO2 $7.5 billion
with charcoal cook with • 11% ethanol
modern fuels • 7% pellets
Source: Catalyst predictive model outputs
1 “Business-as-usual” (BAU) illustrates historical trends extrapolated forward to 2030 10Summary
Africa’s low-carbon access scenarios: huge impact, significant
avoided CO2 emissions, large climate finance opportunity
132 million
new connections from off-grid technologies delivered
A low-carbon scenario
contributes massively
toward universal access
9.2 million
gensets used by enterprises and households displaced
and improved cooking
39 million
new households would cook with modern fuels
A low-carbon scenario
benchmarked against a
Up to 626 million
tons of avoided CO2e emissions over the next decade,
high-carbon scenario approximately equivalent to the annual emissions of 160
yields coal-fired power plants
A low-carbon scenario
requires substantial
volumes of new capital
US$200+ billion
climate finance opportunity
11Summary
And creates an imperative to rally climate-first investors who can
mobilize commercial and concessional capital to deliver on SDG7
Climate finance must be mobilized at scale to support energy access; several types of institutions need to be brought
to the table to change this
Public Organizations Private Organizations
Single country owns institution Project developers and
Corporations
Bilateral DFIs and directs finance flows corporate actors
Philanthropic and/or
Multiple shareholder countries Family Offices commercial financing
Multilateral
and directs finance flows
Regional DFIs
Entities that invest in private
National or multinational Private Equity / companies, or that engage in
Climate Funds
climate funds VC buyouts of public companies
Investment Company or organization that
Banks / invests money on behalf of
Institutional others or providers of debt
Investors and equity
12Summary
Three calls to action to climate-first investors to help catalyze the
SDG7-climate finance nexus
1 Finance existing energy
access enterprises 2 Support new, innovative
mechanisms 3 Help define the next wave
of investment opportunities
$200+
Billion
Climate Finance
Catalysed
via existing vehicles (e.g. to monetize social & that leverage the co-
CrossBoundary Energy environmental impact of benefits of the SDG7-
Access Facility, Energy DRE enterprises, such as SDG13 nexus & roll out
Access Ventures, Facility Universal Electricity new solutions to unlock
for Energy Inclusion) to Facility, Distributed climate funding for the
quickly scale impact and Renewable Energy DRE sector.
get Africa on the low- Certificates, and Digital
carbon SDG7 trajectory. Carbon Credits.
13UNLOCKING CLIMATE FINANCE TO ACCELERATE ENERGY ACCESS IN AFRICA
Linking SDG7 to SDG 13
14Context
“Light is a human right” 1: electrification is a crucial social imperative
SUSTAINABLE DEVELOPMENT GOAL 7
Ensure access to affordable, reliable, sustainable and modern energy for all
Yet, 789 million people still lack access to modern electricity in the world
and SDG 7 is integrally linked other
global social imperatives
1 Leonel Zinsou, former Prime Minister of Benin, announcing the country’s Light for All campaign; United Nations Sustainable Development Goals. Connecting the sustainable development goals by their energy
15
inter-linkages, David L McCollum et al 2018 Environ. Res. Lett.Context
At the same time, combatting climate change is a top global priority
SUSTAINABLE DEVELOPMENT GOAL 13
Take urgent action to combat climate change and its impacts*
Economic, Social Costs Limiting Global Warming Climate Finance
• $3 trillion: disaster-related • 2°C or less: global warming • $540 billion: total climate
economic loss must not exceed this level finance flows in 2018
• 1.3 million lives claimed by
This is dummy text not to be read
• Decarbonizing the electricity • $1.6-3.8T in climate financing
climate-related disasters sector a top priority would be needed annually to
• This is a level 1 bullet reach a 1.5° C scenario
• Via mitigation
− This is a level 2 bullet measures
Via Mitigation to address Via Adaptation to address
causes of climate change impacts of climate change
Sources: United Nations Sustainable Development Goals, SDG 13; CPI Global Climate Finance: An Updated View 2019; World Bank State and Trends of Carbon Pricing 2019 16Context
Electricity consumption is a significant contributor to global CO2
emissions, which leads to the energy-climate nexus
2018 GHG emissions related to electricity and heat
Global energy-related CO2 emissions by sector
(total ~33.5/gtCO2)
Global Trends Africa Trends Paris Agreement
100%
9%
• Accounted for • If Africa1, India • Limiting global 90%
Buildings
42% of total emissions reach warming to
80% 25%
energy-related EU levels under 2°C
CO2 emissions (~7/tCO2), global requires deep 70%
Transport
• Coal combustion emissions will decarbonization 60%
responsible for increase by 33% in electricity 24%
44% of global (13/GtCO2) sector 50%
Industry*
energy-related 40%
CO2 emissions
30%
Electricity &
20% 42% Heat
Generation
10%
0%
2018
Source: IEA CO2 Emissions from Fuel Combustion 2020 (publicly available); 1 Industry figures also include emissions resulting from energy industry use of energy for own operations 17UNLOCKING CLIMATE FINANCE TO ACCELERATE ENERGY ACCESS IN AFRICA
Why Africa’s electricity access
deficit matters
18Context
Africa faces a massive electricity access deficit
1
~70 percent
of households that are
Cape Verde
0.0
unelectrified are found in
0.6 1.6
Eritrea
0.4
sub-Saharan Africa
Senegal Mauritania
Mali 3.1 Somalia
Niger 2.4 4.7 Djibouti
0.1 0.6 Chad Sudan 0.1 2.2
Burkina
The Gambia
Guinea 3.0 Faso
0.3 1.1 18.1
Guinea Bissau
1.0
1.6
Côte
d'Ivoire
Nigeria
1.9
0.6
CAR
1.3
South Sudan
13.1
Ethiopia ~110 million
Sierra Leone
0.7 1.3 Cameroon
5.4
African households lack
1.4 0.1
Liberia Ghana
0.9
Benin
Uganda 3.6 access to modern electricity
Eq. Guinea 0.0 13.1
Togo Gabon Kenya
Rwanda services in 2020
Access Rates DRC 2.0
0.4 7.7 2.2
Congo, Rep.Context
These 110 million unelectrified households make do with stopgap
solutions for basic lighting
Health Environ. Lighting
Fires (smoke, Cost
fumes) Impact quality
Wood
Candles
Stopgap solutions
deliver poor
Kerosene
lighting,
Battery operated and are often
dangerous
flashlights
and expensive
Mobile phone
Flashlights
Low quality solar
lanterns
High Low
Source: Authors’ analysis 20Context
“Access” is no longer binary (whether a consumer is connected to
an electricity grid): now based on “tiered” levels of service
Multi-Tier Framework (MTF) definition: “the ability to avail energy that is adequate, available when needed,
reliable, of good quality, convenient, affordable, legal, healthy and safe for all required energy services”
Source: World Bank Multi-Tier Framework for Measuring Energy Access; A Sure Path to Sustainable Solar (Solar Deployment Guidelines), ESMAP SMRI, September 2019 21Context
Tiered levels of service delivered via varying technologies, with
many stakeholders considering Tier 1 as a minimum threshold
Electricity GHG Upfront O&M
Tier Level
Source Impact Cost* Cost
Standalone, mini-
Quality-verified
grid & grid provide
solar lantern
1 forContext
More recent efforts have advocated for a more ambitious level of
service, known as the “Modern Energy Minimum”
• No high-income country is low energy. Data shows a
correlation between income and energy consumption at
country level
• High-income countries have annual electricity
consumption above 3,000 kWh per capita
• One common threshold for “energy access” is modest,
roughly equivalent to 50 kWh per capita in rural areas,
and correlated with incomes of $0.27 per day
MEM
The Modern Energy Minimum (MEM) sets a target of 1,000 kWh per capita per year
• Divided between 300kWh of household + 700kWh of non-HH electricity consumption
• Correlates with an income of $6.85 per day
Source : Energy for Growth Hub: The Modern Energy Minimum 23Context
Meanwhile, Africa’s electrification trends show some promising
progress toward SDG 7
• Recent grid connection improvements tied to grid densification
• Significant contribution from standalone solar, particularly in East Africa
• Despite these trends, business-as-usual yields a significant SDG 7 shortfall
African Household Electricity Access by Type
100%
90%
80%
70%
60% Estimated at 7% from 2013 to 2020
50%
40%
30%
20%
10% 4% compound annual growth rate from 2000 to 2013
0%
2000 2001 2002 2003 2004 2005 2006 2007 2008 2009 2010 2011 2012 2013 2014 2015 2016 2017 2018 2019 2020
Grid Mini-Grid Standalone Solar
Source: Authors’ estimations based on various sources including: 2020 Tracking SDG 7 Report; IEA Africa Energy Outlook 2019; GOGLA Off-Grid Solar Market Reports; ESMAP Mini-Grid Database 24Context
Though this progress is very uneven across countries
Sub-Saharan Africa Household Electricity Access (2018 vs. 2016)
46 percent
median access rate for
Sub-Saharan African
countries in 2016
Strong progress in
Mali, Liberia, Sierra
8
Leone, Guinea, and
Guinea-Bissau, but countries
still home to 27M
unelectrified have population growth
households in 2018
that is outpacing the rate
Access Rate
Improvement of new connections
30%
Source: Authors’ estimations based on 2020 Tracking SDG 7 – The Energy Progress Report 25Context
And Africa is falling behind rest of world on
electricity access
Africa’s share of the global population has seen modest growth since 2000
Africa population, as % of global population
2018 17%
2010 15%
2000 13%
0% 10% 20% 30% 40% 50% 60% 70% 80% 90% 100%
Yet it now hosts 69% of the world’s unelectrified households
Africans without access to electricity, % of global total
2018 69%
2010 48%
2000 35%
0% 10% 20% 30% 40% 50% 60% 70% 80% 90% 100%
Source: Authors’ estimations based on ESMAP’s July 2020 Tracking SDG 7 Progress Report 26Context
Africa’s power grids remain heavily dependent on fossil
fuel-based power
Installed capacity by fuel in Africa, 2010 and 2018 Electricity generation by fuel in Africa, 2010 and 2018
160 500
450
140
400
120
350
100
300
TWh
GW
80 250
60 200
150
40
100
20
50
0 0
2010 2018 2010 2018
Africa Africa Africa Africa
Coal Gas Oil Nuclear Hydro Other RE Coal Gas Oil Nuclear
Hydro Solar Wind Other RE
Source: Authors’ estimations based on the IEA’s 2019 World Energy Outlook and Africa Energy Outlook 27Context
And Africa’s historical grid GHG emission trends
have mirrored other parts of the world
GHG Intensity of Power Generation in Selected Regions
900 • Progress has been
inconsistent in Africa,
800
as seen by lumpy lines
700
• Africa emissions
600 intensity remains
500
relatively high
gCO2/kWh
compared to the rest
400 of world
300
• Future trajectory
200 depends heavily on
Africa’s generation mix
100
and the extent to
0
which it draws upon
indigenous renewable
2000
2001
2002
2003
2004
2005
2006
2007
2008
2009
2010
2011
2012
2013
2014
2015
2016
2017
resources (e.g. hydro,
India Southeast Asia Africa World European Union
solar, wind)
Source: Authors’ estimations for Africa based on the IEA’s 2019 World Energy Outlook and Africa Energy Outlook; IEA’s Tracking Clean Energy Progress: Power; figures do not include impact of T&D losses 28UNLOCKING CLIMATE FINANCE TO ACCELERATE ENERGY ACCESS IN AFRICA
Africa’s backup genset
epidemic: high-cost power
with a big climate impact
29Context
More so than households, enterprises are the major
driver of electricity demand globally and in Africa
Global electricity consumption by sector, 2017 69 percent
Residential of global electricity demand driven by
27%
industrial and commercial off-takers
While still nascent, Africa’s
Commercial,
Public Services commercial and industrial
22% sectors similarly account for over
70% of total electricity demand
27 percent
of global electricity demand
Others
5%
originates from households
Agriculture &
forestry Despite lower access levels,
3% households in Africa still account
Industry Transport for over 29% of the continent’s
42% 2% electricity consumption
Source: International Energy Agency – Electricity Statistics - Electricity Information 2019 Overview (publicly available) 30Context
Unreliable grid connections lead to massive use of
fossil fuel-powered gensets, particularly by enterprises
As utilities struggle to keep up with growing electricity demand, grid reliability will likely worsen, exacerbating
dependency on expensive, polluting backup generators
Unreliable grid connections Use of backup generators
• In developing countries, unreliable grids • Backup fossil-fueled generators are used
are the primary driver for genset use: by households and enterprises
• ~75 percent of sites using fossil-fuel • Powered with fossil fuels, typically diesel
powered gensets are “grid or gasoline
connected” • Significant source of air pollutants
• In Africa alone: • Off-grid enterprises often resort to using
• 36 countries are considered to have gensets for power, particularly for
unreliable grids1 productive use applications
• Enterprises experience an average • Some off-grid households use them as
of 9 outages per month, lasting a well, though fuel costs make them
total of 81 hours (e.g.,> 10% unaffordable for most
downtime)
• Unreliable grid connections result in
an average 8 percent loss in
business revenues
1 An unreliable grid is defined as one in which local enterprises, on average, report 12 or more hours of electrical outages in a typical month; Source: World Bank Enterprise Surveys; photo credit: IFC. 31Context
These gensets deliver power, but at a huge
economic and climate cost
~ 7 million Installed capacity of back-up generators in Africa, 2016
estimated number of backup genset
sites in Sub-Saharan Africa today,
equivalent to 120 coal-fired power
stations
~US$13 billion
spent in Sub-Saharan Africa by backup
genset users each year on fuel
20 percent
of gasoline & diesel consumed in
Africa is a result of backup genset use,
equivalent to 15-20 percent of
spending on education & healthcare
Source: The Dirty Footprint of the Broken Grid, IFC and Schatz Energy Research Center at Humboldt State University, 2019 32UNLOCKING CLIMATE FINANCE TO ACCELERATE ENERGY ACCESS IN AFRICA
Clean cooking: what it is and
why it matters for climate
change and energy access
33Context
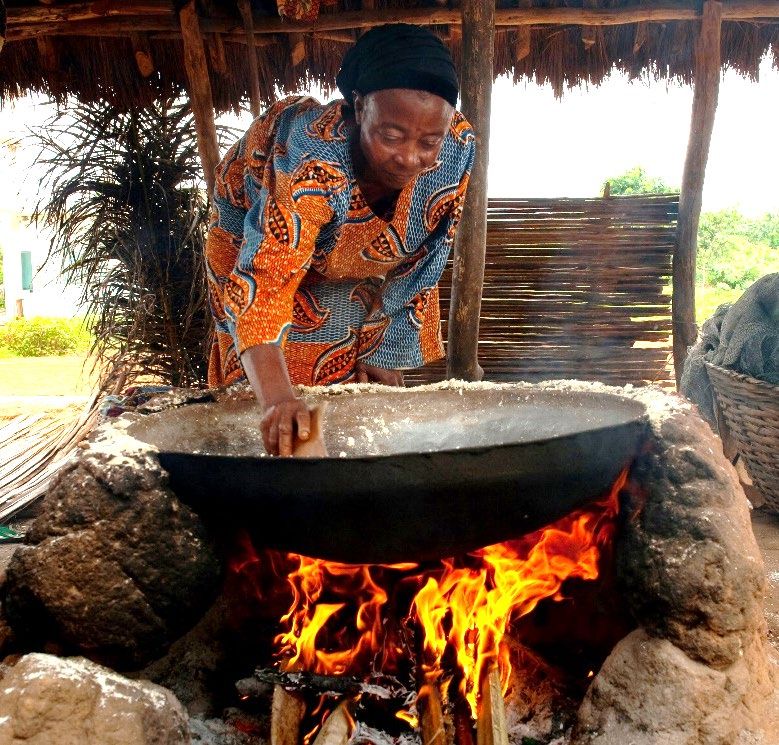
Why clean cooking solutions matter
Four billion people - half of the world’s population - depend on polluting solid fuels, open fires or inefficient stoves
to cook their food1
The annual costs are striking:
>4 million
premature deaths
1.4 billion
tons of wood fuel consumed, much of it
unsustainably
US$38 – US$40 billion
spent on solid fuels for cooking
140 million
productive person-years wasted on biomass
collection
Source: The State Of The Global Clean And Improved Cooking Sector 2015, ESMAP; The State Of Access to Modern Energy Cooking Services 2020, ESMAP; Photo: Arne Hoel/World Bank 34Context
Africa is the epicenter of the cooking crisis
Population growth in Africa is outpacing annual growth in clean cooking access across the continent; between 2010-
2018, the number of people without access rose from 750 million to 890 million
Percentage of population with access to clean cooking by country, 2018
Source: ESMAP: The State Of Access to Modern Energy Cooking Services 2020 35Context
Africa’s high solid fuel use costs lives and the
climate
Africa primary household cooking fuel use by type, 2000, 2010, and 2015/16 1
100%
850
million+
4.7% 3.9% 6.0% Africans, or 80% of the continent’s
3.6% 4.6%
4.6% 5.6% 7.2% population, use solid fuels for
80%
8.2% 6.8% 6.1% primary cooking needs
3.5%
9.1% 13.1%
15.6%
60% 600
thousand
Africans killed annually from
household air pollution, making it
40%
69.8% the 2nd largest health risk in the
66.0%
61.6% region
20%
600 Mt CO2
of global GHG emissions comes
0%
2000 2010 2015/2016 from solid fuel cooking in Africa
Wood Charcoal Kerosene Electricity LPG Other
alone
Sources: Clean and Improved Cooking in Sub-Saharan Africa 2014, ACCES; The State of Access to Modern Energy Cooking Services, ESMAP 2020; Authors’ estimates
1 Other includes a mix of both modern and traditional fuels, including natural gas, biogas, mined coal, dung, crop waste, etc.
36Context
Solving the cooking challenge requires a shift to
modern fuels
Making the shift must overcome significant barriers, including willingness and ability to pay, building fuel supply
chains, and behavior change relative to traditional cooking approaches
Traditional fuels Modern fuels
Stopgap cooking Improved Cooking Modern Fuel Renewable Fuel
"3-stone" Improved artisanal “Standalone" stove “Standalone" stove
Stove Type
Unimproved artisanal Industrial “Grid-tied" “Grid-tied"
Wood Wood Coal LPG Electric* Pellets
Fuels Charcoal Charcoal Kerosene Natural gas Biogas Ethanol
Coal Solar
LPG/NG 2B
Traditional Chitetezo Envirofit G- LPG Stove
Example Burn jikokoa SS gas Mimi moto SAFI Cooker
Metal Stove Mbaula 3300 Télia n°2
stove
Image
Natural
Fuel Type Charcoal Wood Charcoal Wood LPG Pellets Ethanol
gas/LPG
Efficiency 23% 20% 44% 34% 49% N/A 47% 64%
GHG
Very high High Medium Medium Low Low Very low Very low
Emissions
Source: Clean Cooking Alliance’s ‘Clean Cooking Catalog’; authors’ analysis.
*Renewability of electricity depends on country generation mix.
37Context
Africa’s choice of modern cooking transition
depends on the emissions intensity of fuel sources
• In Africa, electric stoves have higher emissions than other fuel/stove combinations due to the fossil fuel-heavy
grid generation mix
• The most GHG emissions-friendly solutions involve lower-carbon fuels paired with highly-efficient stoves
Fuel Type Fuel Type Fuel emissions intensity Stove Efficiency Stove and fuel emissions intensity
kgCO2e/GJ % kgCO2e/GJ
Traditional stove Charcoal 100 23% 434
Traditional stove Wood 67 20% 337
Basic ICS Charcoal 103 30% 343
Basic ICS Wood 61 25% 249
Industrial ICS Charcoal 103 41% 253
Industrial ICS Wood 61 34% 181
Std. Kerosene Kerosene 89 45% 198
Std. LPG LPG 75 49% 153
Industrial Ethanol Ethanol 24 64% 38
Industrial Pellet Pellets 19 47% 41
Std. Electric Electric 169 75% 226
Induction Electric Electric 169 85% 199
*Each fuel has a GHG emissions intensity factor (kgCO2e per gigajoule of fuel burned) which illustrates the carbon-intensity of the fuel when burned.
When used in a particular stove, only a percentage of the burned fuel is converted into useful energy, resulting in a higher GHG emissions intensity in practice.
Source: Authors’ analysis based on multiple sources including Penisse et al, Bailis et al, Clean Cooking Alliance’s Clean Cooking Catalog, inter alia. 38UNLOCKING CLIMATE FINANCE TO ACCELERATE ENERGY ACCESS IN AFRICA
Africa’s energy access pillars
and climate finance
opportunities
39Preview
Previewing the thematic pillars and climate
scenarios
Our analysis is based on separate pillars, focused on:
1 1.5 2 3
Within each of these pillars, we generate
the following scenarios:
Business-as-usual: future trajectory based on BAU
Electricity Access
historical trends Business-as-
Tier 1 Modern Back-up Improved
usual
Universal Energy Genset Cooking
Access Min. Eradication High-carbon: technology deployed to
achieve universal access are relatively
HC
High-
Universal emissions intensive carbon
Access
Low-carbon: technology deployed to achieve
universal access heavily leverage low-carbon
LC
Low-
technologies carbon
Each model allows benchmarking of scenarios to estimate avoided CO2 emissions
40UNLOCKING CLIMATE FINANCE TO ACCELERATE ENERGY ACCESS IN AFRICA
Pillar 1: universal household
electricity access by 2030
41Pillar 1– Tier 1 Threshold
Pillar 1: HH access                Scenario - BAU

        Business-As-Usual (BAU): model shows only 69% of HHs would
        have access in 2030 1; significant stopgap emissions footprint
   Total HH Access in 2030                                                                                                      2021-2030 New Connections vs. Cumulative Emissions
                                                                                                                                                100                                                                   250

                                                                                                                                                 90
                  None

                                                                                                            Million New Housesholds Connected
                                                                                                                                                 80                                                                   200
                  31%
                                                                                                                                                 70

                                                                                                                                                                                                                                                    Confidential draft, not for distribution or citation
                                                                                                                                                                                                                             Million Tons of CO2e
                                                                                                                                                 60                                                                   150

                                                                                                                                                 50
                                                                                               Grid
                                                                                                                                                 40                                                                   100
                                                                                               55%
                                                                                                                                                 30

                                                                                                                                                 20                                                                   50

                    Off-Grid                                                                                                                     10
                     13%
                                                                                                                                                 0                                                                    0
                                Mini-Grid
                                                                                                                                                             New Connections                 Cum. Emissions
                                  1%
                                Grid        Mini-Grid         Off-Grid         None                                                                   Grid   Mini-Grid   Off-Grid   Backup Stopgap Use    Reg. Stopgap Use

    • Reflects expected access situation through 2030 if current trends in grid, mini-grid, and standalone solar
      access continue
    • About 89 million households will gain access; a somewhat larger number will remain unserved
    • Cumulative emissions of 418 MtCO2e, of which 50 percent from continued stopgap use

  1 Projections through 2030 based on recent historical trends in grid expansion, mini-grid construction, and OGS sales. All scenarios assume UN-DESA’s medium population growth scenario and average household sizes
                                                                                                                                                                                                                                                               43
  shrinking in line with historical averages. Backup stopgap use refers to emissions from the ongoing use of stopgap solutions by HHs with electricity access; reg. stopgap use refers to stopgap emissions from unelectrified HHs
Pillar 1: HH access Scenario: high-carbon
Tier 1 high-carbon scenario: universal access, with a
53% increase in CO2e emissions compared to BAU
Total HH Access in 2030 2021-2030 New Connections vs. Cumulative Emissions
Off-Grid 200 700
23%
180
600
Million New Housesholds Connected
160
140 500
Million Tons of CO2e
Mini-Grid 120
400
2%
100
300
80
60 200
40
Grid 100
20
75%
0 0
New Connections Cum. Emissions
Grid Mini-Grid Off-Grid
Grid Mini-Grid Off-Grid Backup Stopgap Use Reg. Stopgap Use
• Universal access achieved by 2030 through a higher-carbon scenario whereby the grid plays a large role, and
associated emissions intensity rises to levels similar to India today
• Mini-grids and standalone solar also figure prominently, but the former continue to use fair amounts of diesel
• Cumulative emissions of 654 MtCO2e, including an over 40 MtCO2e reduction in stopgap emissions vs BAU
1 Grid emissions intensity in the high-carbon scenario increases by 1.5% annually to nearly 800 kgCO2e/MWh when factoring in T&D losses. New mini-grids maintain approximately the same generation breakdown as the
44
existing stock in Africa (50% diesel; 20% diesel-RE; 30% RE). Reduction in stopgap emissions is limited given the large number of new grid users who will continue using stopgap solutions to deal with poor grid reliability.Pillar 1: HH access Scenario: low carbon
Tier 1 low-carbon scenario: universal access,
smaller carbon footprint than BAU
Total HH Access in 2030 2021-2030 New Connections vs. Cumulative Emissions
200 600
180
500
Million New Housesholds Connected
160
140
Off-Grid 400
Million Tons of CO2e
43% 120
100 300
Grid
55% 80
200
60
40
100
20
Mini-Grid
0 0
2%
New Connections Cum. Emissions
Grid Mini-Grid Off-Grid
Grid Mini-Grid Off-Grid Backup Stopgap Use Reg. Stopgap Use
• Standalone solar, green mini-grid solutions account for majority of new household connections through 2030
• Lower dependency on grid generation; emissions intensity decreases in line with historical trends;
• Limited GHG footprint of off-grid technologies means that emissions impacts relative to BAU are rather limited
• Cumulative emissions of 386 MtCO2e, including an estimated 77 MtCO2e avoided stopgap emissions vs BAU
1 Grid
emissions intensity in the low-carbon scenario decreases slightly to just over 650 kgCO2e/MWh when factoring in T&D losses. The share of RE-only mini-grids increases considerably to 80% by 2030. The reduction in
45
stopgap emissions is more significant than the high-carbon scenario as fewer households gain access through an unreliable grid.Pillar 1: HH access All scenarios
Emissions impact of universal access scenarios vary widely: low-
carbon scenario has net avoided emissions of 268 Mt CO2e
Comparison of 2021-2030 Cum. CO2e Emissions
MtCO2e BAU assumes only HC and LC assume 100% access achieved
800 69% access achieved
700
418 Mt CO2 654 MtCO2e
emissions
emitted with 268 Mt CO2
600 avoided in LC
only 69% access ∆
Cumulative Emissions (MtCO2e)
compared to
HC
500
418 MtCO2e
400 386 MtCO2e
300
200
100
0
BAU Scenario High-Carbon Scenario Low-Carbon Scenario
Grid Mini-Grid Off-Grid Backup Stopgap Use Reg. Stopgap Use
1 The low-carbon scenario has lower estimated emissions than the BAU scenario since emissions from electrification activities are more than offset by reductions in stopgap emissions (particularly from kerosene and candles)
46Pillar 1: HH access Scenario: low carbon
Tier 1 low-carbon electrification scenario yields a US$20.7
billion climate finance opportunity
• Off-grid solar financing need of US$15.7 billion, yielding first time access for 125.7 million
households
• Mini-grid financing of US$4.9 billion required, delivering access to 6.8 million households
Base Demand: Off-Grid Solar & Mini-Grid Capital Needs, 2021-2030
Mini-Grid Off-Grid Solar
US$4.9 billion US$15.7 billion
1,181
8%
1,496
30%
2,493 5,117
50% 32%
9,447
60%
997
20%
Mini-Grid - Debt Mini-Grid - Equity Mini-Grid - Grant OGS - Debt OGS - Equity OGS - Grant
1 Quantumand blend of financing needs are based on the historical needs of mini-grid developers and OGS distributors as well as the authors’ expectations about the evolution of system costs through 2030. Financing
amounts do not include additional end-user subsidies that would be required to ensure Tier 1 OGS systems or mini-grid electricity is affordable for all households by 2030.
47Pillar 1: HH access Scenario: low carbon
US$2.5 billion required in consumer subsidies to achieve universal
access under low-carbon scenario
• 42 million households that need but cannot afford T1 OGS by 2030
• 31% of households without grid or micro-grid connections that require subsidy for T1
• $2.5 billion total financing required if 50% demand-side subsidy is provided
Sub-Saharan Africa Affordability of Monthly Electricity Payments
100%
Estimated Share of Households that can Afford Monthly Electricity Payment
90%
80% 2018
70% 2030 (Est.)
60%
50%
40%
30%
20%
10%
0%
0 5 10 15 20 25 30 35 40
Monthly Electricity Payment (US$)
48Pillar 1.5– Modern Energy Minimum Threshold
Pillar 1.5: HH access                         All scenarios

                                  MEM yields additional 112 Mt CO2e (compared to Tier 1), though
                                  per capita consumption increases to 130 kWh/year
         High Demand: Comparison of 2021-2030 Cum. CO2 Emissions

                                  MtCO2e                                                                                                                          Assumes 100% access achieved
                                   800

                                                                                                                   703 MtCO2e
                                   700
                                                              HH Access
                                                             rate of 69%
                                   600                        achieved
  Cumulative Emissions (MtCO2e)

                                                                                                                                                                                         498 MtCO2e
                                   500

                                               418 MtCO2e
                                   400

                                   300

                                   200

                                   100

                                    0
                                               BAU Scenario                                                    High-Carbon Scenario                                                  Low-Carbon Scenario

                                                                          Grid        Mini-Grid         Off-Grid        Backup Stopgap Use             Reg. Stopgap Use
                                                                                                                                                                                      Source: Catalyst predictive model outputs

       1 MEM scenario  results in increased CO2e emissions due to higher overall electricity consumption per capita as well as the need for larger mini-grids and off-grid solar systems (Tier 2 and 3), which have higher emissions
       associated with their manufacture and distribution
                                                                                                                                                                                                                                       50
Pillar 1.5: HH access Scenario: low carbon
MEM requires 25M more mini-grid and 37M more
Tier 3 OGS connections relative to Tier 1
2021-2030 New Connections vs. Cumulative Emissions
Total HH Access in 2030
200 700
180
600
Million New Housesholds Connected
160
Off-Grid 500
140
35%
Million Tons of CO2e
120
400
100
300
Grid 80
55%
60 200
40
100
20
Mini-Grid
0 0
10%
New Connections Cum. Emissions
Grid Mini-Grid Off-Grid Backup Stopgap Use Reg. Stopgap Use
Grid Mini-Grid Off-Grid
• MG and Tier 3 systems required to deliver on scenario’s assumed per capita consumption of 130 kWh p/a by 2030
• Over the period, mini-grids account for 16 percent of new connections and Tier 3 OGS nearly 20 percent
• In the MEM scenario, average per capita electricity consumption increases by 57 percent, and emissions 27
percent, relative to the base case
1 The 130 kWh/capita MEM annual target for 2030 is an average, with some grid HHs overshooting (i.e., getting grid, mini-grid, and Tier 3 off-grid solar access) while others have Tier 1 or 2 access. 51Pillar 1.5: HH access Scenario: low carbon
MEM’s low-carbon electrification scenario yields a
US$67.1 billion climate finance opportunity
• Larger systems required to deliver higher per capita demand of 130 kWh per year by 2030
• Off-grid solar connects 101 million households at a cost of US$37.5 billion, while mini-grids require
US$29.6 billion to electrify 31.3 million households
High Demand: Off-Grid Solar & Mini-Grid Capital Needs, 2021-2030
Mini-Grid Off-Grid Solar
US$29.6 billion US$37.5 billion
9%
30%
33%
50%
60%
20%
Mini-Grid - Debt Mini-Grid - Equity Mini-Grid - Grant OGS - Debt OGS - Equity OGS - Grant
1The quantum and blend of financing needs are calculated as in the Tier 1 scenario, but to meet the MEM target, larger mini-grids and a higher share of Tier 2 and 3 SHS are required. Financing amounts do not include
additional end-user subsidies that would be required to meet targets for all technology types.
52UNLOCKING CLIMATE FINANCE TO ACCELERATE ENERGY ACCESS IN AFRICA
Pillar 2: eliminating backup
genset use by African
enterprises and households by
2030
53Pillar 2: greening backup All scenarios
The pace of phasing out fossil-fuel burning gensets with
renewable solutions impacts scenario emission profiles
• High-carbon scenario assumes that, when gensets reach end of life, 10 percent are replaced with renewables
• In low-carbon scenario, at end of life, 50 percent of gensets are replaced with renewables; by 2030 nearly all
gensets are retired
Evolution of Backup Genset Fleet for Households and Enterprises by Scenario, 2021-30
12
10
Millions of Backup gensets deployed
8
BAU Scenario
6
High-Carbon
4
Low-Carbon
2
0
2020 2021 2022 2023 2024 2025 2026 2027 2028 2029 2030
1 The 10% and 50% replacement rates specifically occur when gensets reach their rated lifetime. As such, the total percentage of gensets replaced over the 10-year period exceed the replacement rates. 54Pillar 2: greening backup All scenarios
Displacing 9.2 million backup gensets with decentralized
renewables reduces African emissions by 226M tons of CO2e
• Emissions reductions are driven by the growth rate in backup genset fleets and the rate at which backup gensets
are replaced by renewables; replacement rates are varied across scenarios
• BAU has highest carbon footprint because renewables do not become part of the fleet mix
Comparison of 2021-2030 Backup genset, Household, and Enterprise CO2 Emissions
600
550 MtCO2e
Cumulative Emissions (MtCO2e)
500 486 MtCO2e
400
300
260 MtCO2e
200
100
0
BAU Scenario High-Carbon Scenario Low-Carbon Scenario
Enterprise BUGS Emissions Enterprise RE Emissions Residential BUGS Emissions Residential RE Emissions
1. The modeling assumes that average capacity factors of back-up generators remain fixed over time, in line with historical averages (i.e., assumes no improvement or deterioration in grid reliability). 55Pillar 2: greening backup Scenario: low carbon
Low-carbon scenario yields a US$134.4 billion
climate finance opportunity
• Displacing 9.2 million backup generators with a total generation capacity of 163 gigawatts comes at
a significant cost
• Generator displacement in later years is forecasted to be considerably cheaper thanks to sharp
reductions in RE technology costs, particularly lithium-ion batteries
Back-up: Renewable Energy Capital Needs, 2021-2030
24%
76%
Debt Equity
1 Quantum and blend of financing needs are based on the authors’ estimates and expectations about the evolution of solar+battery system costs through 2030. Grant needs for purveyors of genset replacement technology
are expected to be very limited given the strong financial case for making these investments, with debt financing playing an even more significant role due to C&I enterprises’ proportionally larger working capital needs.
56UNLOCKING CLIMATE FINANCE TO ACCELERATE ENERGY ACCESS IN AFRICA
Pillar 3: moving African
households that cook with
charcoal onto clean cooking
solutions
57Pillar 3: cleaner cooking
Clean Cooking: establishing a plausible 2030
scenario for Africa
• Achieving universal clean cooking in Africa by 2030 not feasible
• This research posits a plausible low-carbon cooking scenario whereby African charcoal
What users transition to modern fuels
• Household’s using charcoal are most likely to switch to modern fuels because:
• Charcoal users have an existing willingness and ability to pay for fuel
• Charcoal has established distribution channels that could be used for modern fuels
Why • Charcoal users are typically in urban or peri-urban areas, thus easier to access and in greater density
• Our cooking model estimates the impact of moving charcoal users onto modern fuels,
including LPG, electricity, ethanol, and wood pellets
• Scenarios vary by the percentage of charcoal-using HH that shift to modern fuels by 2030
How • High-carbon assumes 25%; low carbon assumes 100%; black carbon emissions are not included
58Pillar 3: cleaner cooking All scenarios
Displacing charcoal with modern fuels in Africa
yields 132 million tons of avoided CO2e emissions
39 million new households would cook with modern fuels, representing an 83 percent
increase in primary1 modern fuel users in Africa
Comparison of 2021-2030 Cum. CO2e Emissions by Scenario from Cooking
600 100%
Percentage of Charcoal HHs Transitioned to Modern Solutions
541 MtCO2e
90%
510 MtCO2e
500
80%
Cumulative Emissions (MtCO2e)
70%
400 378 MtCO2e
60%
300 50%
40%
200
30%
20%
100
10%
- 0%
Status Quo Scenario High-Carbon Scenario Low-Carbon Scenario
Cum. Emissions (2021-2030) % HHs w/ Modern Solutions (2030)
1 In a household, the primary fuel is the one which accounts for the majority of cooking needs. 59Pillar 3: cleaner cooking
Displacing majority of charcoal with modern fuels
in Africa would cost US$7.5 billion
The majority of charcoal households transition $7.5 billion investment required to
to LPG and electricity produce and distribute stoves and build
(though stacking continues) downstream infrastructure
HHs Transitioning Financing Need
by Fuel by Fuel
Clean Cooking Capital Needs, 2021-2030
45 8,000
40 7,000
35 10%
6,000 20%
30
5,000
Pellets 25
Million
Million
4,000
Ethanol 20
3,000
Electricity 15
70%
2,000
LPG 10
5 1,000
0 0 Equity Debt Grant
HHs Financing Need
1 The model assumes that charcoal households that transition to modern fuels continue to meet 30% of their cooking energy needs with charcoal
2 Investment
60
requirements for modern fuel transitions are based on estimates from the Modern Energy Cooking Services (MECS) programme and include stove and downstream infrastructure investment needsPillar 3: cleaner cooking
The upfront cost of converting to modern fuels is high,
~$70 for typical ‘starter kits’ (e.g., stove, cylinder, etc.)
• Moving the 39 million households cooking primarily with charcoal today onto modern fuels will
require a subsidized starter kit or PAYGO modalities.
• We estimate that without widespread PAYGO modalities for the various modern fuels, an upfront
subsidy of 50% of the equipment cost, totaling $2 billion over 10 years will be required to move
charcoal users onto modern fuels.
Share of households that can afford starter kit based on monthly savings over 3 months
100%
Estimated Share of Households that can Afford
90%
80% 2018
Starter Kit if Saving Over 3 Months
70% 2030
60%
50%
40%
30%
20%
10%
0%
0 5 10 15 20 25 30 35 40
Monthly Amount Saved over 3 Months (US$)
61UNLOCKING CLIMATE FINANCE TO ACCELERATE ENERGY ACCESS IN AFRICA
Africa’s SDG 7 and SDG 13
call to action
62Call to Action
These scenarios avoid 563-626 million tons of CO2 , deliver significant
SDG 7 impacts, and unlock a substantial climate finance opportunity
Emissions from plausible low-carbon scenarios are benchmarked against equally plausible high-carbon
counterfactuals; the difference between the two constitutes the avoided emissions
Tier 1 MEM
205
800 268 Mt CO2
Mt CO2 avoided
700 avoided
132
600 ∆ 226
Mt CO2
Mt CO2
avoided
Emissions (Mt CO2)
∆ avoided
500
∆
400
∆
300
200
100
0
BAU High-carbon Low-carbon BAU High-carbon Low-carbon BAU High-carbon Low-carbon
Access Back-up Cooking
130 million households 37 million households
Impact
9.2 million gensets retired
get first time access using clean fuels
Financing $20.7B $67.1B $134.4B $7.5B
opportunity (Tier 1) (MEM) TOTAL: $162.6B (Tier 1), $209B (MEM) Source: Catalyst predictive model outputs
1The Tier 1 scenario sees expansion of all access technologies (grid, mini-grid, and OGS of various sizes) but the majority of low- and lower-middle income households get access via Tier 1 OGS technologies.
63
The Modern Energy Minimum (MEM) scenario targets per capita consumption levels of 130 kW by 2030 and thus more households need mini-grid connections and Tier 2 and 3 OGS systems as a result.Call to Action
Summing up Africa’s low-carbon access scenarios: huge impact,
significant avoided CO2 emissions, large climate opportunity
132 million
new connections from off-grid technologies delivered
A low-carbon scenario
contributes massively
toward universal access
9.2 million
gensets used by enterprises and households displaced
and improved cooking
39 million
new households would cook with modern fuels
A low-carbon scenario
benchmarked against a Up to 626 million
high-carbon scenario tons of avoided CO2e emissions over the next decade
yields
A low-carbon scenario
requires substantial
volumes of new capital
US$162-209 billion
climate finance opportunity
64Call to Action
Three calls to action to climate-first investors to help
catalyze the SDG7- climate finance nexus
1 Finance existing energy
access enterprises 2 Support new, innovative
mechanisms 3 Help define the next wave
of investment opportunities
$200+
Billion
Climate Finance
Catalysed
via existing vehicles (e.g. to monetize social & that leverage the co-
CrossBoundary Energy environmental impact of benefits of the SDG7-
Access Facility, Energy DRE enterprises, such as SDG13 nexus & roll out
Access Ventures, Facility Universal Electricity new solutions to unlock
for Energy Inclusion) to Facility, Decentralized climate funding for the
quickly scale impact and Renewable Energy DRE sector.
get Africa on the low- Credits, and Digital
carbon SDG7 trajectory. Carbon Credits.
65Commissioned by
Produced by
Backup genset research produced in association with
Inputs from a Technical Working Group, comprised of representatives from
Backup genset research was based on previous work commissioned by
The Report is endorsed by key DRE industry associations
66UNLOCKING CLIMATE FINANCE TO ACCELERATE ENERGY ACCESS IN AFRICA
Annex: research methodology
& additional analysis
67Key questions guide the research agenda
Modern
Electricity Greening SDG 7/13
cooking
access: back-up Nexus:
access:
Providing generation: Improving
Moving HH to
first-time Solving the access,
modern
electricity unreliable grid reducing
cooking
access challenge emissions
solutions
• How to transition • How do we get enterprises • What are the
households off • What is the climate
stopgap solutions and and households off their emissions associated impact (measured in
onto modern, dependency on backup with traditional GHG emissions) of
affordable, and reliable fossil-fueled generators cooking methods? different universal
sources of electricity? (backup genset)? electrification (and
• What would it look like improved cooking)
• What are the avoided • What are the emissions if a meaningful
emissions associated scenarios?
from the use of backups, percentage of users
with a low-carbon and what would the were to graduate to • What is the climate
universal counterfactual look like?
electrification scenario modern cooking finance opportunity
(and in a high demand solutions? associated with a low-
• How much would it cost to carbon universal
context)? replace backup generators • What would this cost electricity access
• What would it cost to with renewable backup and what are some of scenario?
make this a reality? technologies? the other key
considerations?
68Research scope: focused on portions of SDG 7 and
13
Climate Finance Opportunity Our Coverage
Global Africa, India, Myanmar only
SDG 7: Access to affordable, reliable, Off-Grid Solutions for Households
sustainable, and modern energy for all Grid Extension for Households
Cooking access for Households
Electricity Access for Enterprises
SDG 13: Take urgent action to combat Carbon Scenarios
climate change and its impacts Avoided Emissions
Increase share of renewables Households (Backup genset)
Enterprises (Backup genset)
Leveraging climate finance for SDG 7/13 Universal electrification
nexus Improved electricity access
Cooking access
Full alignment Partial alignment
69We built empirical models, with 5 main components
1 2 3 4 5
Modeling to derive Modeling indirect Modeling direct Using emissions Modeling the
each technology’s GHG emissions of GHG emissions from modeling results Climate Finance
contribution each electricity household and from step 2+3 to Opportunity in
towards achieving generation & enterprise derive total Africa, India,
SDG 7, via different cooking electrification, emissions from Myanmar
scenarios, including technology, plus household cooking step 1 scenarios
‘high demand’ those from
universal access stopgap lighting
70We modeled various SDG 7 scenarios and the
associated carbon footprint
Core Data Key Levers Outputs
(Fixed Assumptions) (Var. Assumptions)
Historical access Future technology
2030 access rate
rates, from blend
Grid/MG/ Improved Standalone Carbon footprint of
Genset Grid Mini-grids
SHS cooking solar each scenario
Stopgap technology Carbon Access
use intensiveness of contributions, by
connections technology
Lifecycle
Assessment Pace of
Climate finance
Access
(including high demand & opportunity
Population growth cooking)
Levers: can be adjusted to generate a variety of key scenarios
71We undertook lifecycle assessment to understand
the GHG footprint of each generation technology
Every energy technology has a carbon footprint, even low-carbon technologies
• ‘Cradle to grave’ approach in lifecycle
assessment (LCA)
Raw Material
• Assesses environmental impact from Extraction
extraction (cradle) to end use (grave) of
energy technologies:
• Grid-tied generation (e.g., solar,
gas)
• Mini-grids
• Standalone home systems Lifecycle
• Stopgap solutions Assessment
• Standalone genset (LCA)
• LCA of energy technologies to capture
GHG emissions
• LCA captures CO2 associated with the
production of all energy technologies
• No carbon footprint from operation of
solar technologies (unlike fossil fuels)
72Lifecycle GHG emissions of utility-scale power
generation technologies
kgCO2e/MWh
Lifecycle GHG Emissions from Electricity Technologies
Wind
Nuclear
Hydropower
Geothermal
Solar PV
Natural Gas
Heay Fuel Oil
Coal
0 100 200 300 400 500 600 700 800 900
Direct Indirect
• Indirect GHG emissions: generated from extracting, processing and manufacturing activities
associated with manufacturing, transporting, and assembling generation technologies
• Direct GHG emissions: generated from operation of generation technologies, post-installation
Source: Climate Change 2014: Mitigation of Climate Change - Fifth Assessment Report of the Intergovernmental Panel on Climate Change 73Standalone, mini-grids, and genset: varied units of
measure, and significantly different GHG footprints
Mini-Grid Systems Standalone Solar Genset
kgCO2e/MWh kgCO2e/Unit
kgCO2e/Unit
Small Petrol
PV-Battery MG
w/Diesel Back-up Tier 1 SHS Small Diesel
Medium Diesel
Diesel-PV MG Tier 2 SHS Large Diesel
0 20,000 40,000
Indirect
kgCO2e/MWh**
Diesel MG Tier 3 SHS
Diesel
0 500 1000 1500 2000 0 500 1000 1500 2000 Petrol
Direct Indirect Direct Indirect 0 1,000 2,000
Direct
• Off-grid and mini-grid technologies offer lower-emissions access scenario, but only if fossil fuel-based
generation sources are minimized
• While the level of service provided by Tier 1 standalone solar solutions is limited to lighting and basic charging,
HH can graduate to larger Tier 2, 3 systems as needs and purchasing power increase
Source: Authors’ research based on existing LCA methodologies for various technologies. *Emissions assume 1,000 kWh of electricity generated. **Direct emissions ranges by generator fuel type. 74Emissions from stopgap lighting solutions vary
drastically as well…
Modern, reliable electricity technologies often displace massive amounts of CO2e emissions
1,000 kg CO2e
emitted per year on kerosene
lanterns, and particularly open Kerosene Kerosene Candles
wick models (hurricane (open wick)
lantern)
15 kg CO2e
emitted per year on battery-
powered torches, mobile-phone
torches, or small solar lanterns
Mobile Phone Flashlight Wood
Torch (dry cell-
powered)
75…though our research shows a promising shift away
from high polluting stopgap technologies (1/2)
Rwanda Kenya
• HHs using kerosene as primary lighting • Kenya is a major outlier, with sticky kerosene
source dropped from 70% to 5% between users who switch mostly to the grid or solar
2001 and 2017 • In 2017, kerosene still accounted for nearly half of
• In 2017, kerosene accounted forCountry-level deep dives show a striking shift in
kerosene usage (2/2)
Mozambique Uganda
• HHs using kerosene as primary lighting • HHs using kerosene as primary lighting
source dropped from 54% to 13% between source dropped from 85% to 34% over the
2003 and 2015 last decade
• In 2015, kerosene accounted for 21% of unelectrified HHs
• Torches powered by dry-cell batteries are primary • In 2017, kerosene did still account for approx. half
lighting source for >40% of unelectrified HHs of stopgap lighting used in the country
Mozambique - Primary HH Lighting Source Uganda - Primary HH Lighting Source
60% 80% Grid Electricity
Grid Electricity 70%
50%
Kerosene 60% Kerosene
40% 50% (Open Wick)
Candles
30% 40% Kerosene
Wood 30% (Lantern)
20%
Other 20% Other
10% 10%
0% >95% torches 0%
~50% torches
2003 2009 2015 in 2015 2006 2010 2013 2017 in 2017
Source: Relatório Final Do Inquérito Ao Orçamento Familiar (2003-2015); Uganda National Households (2006-2017) 77You can also read