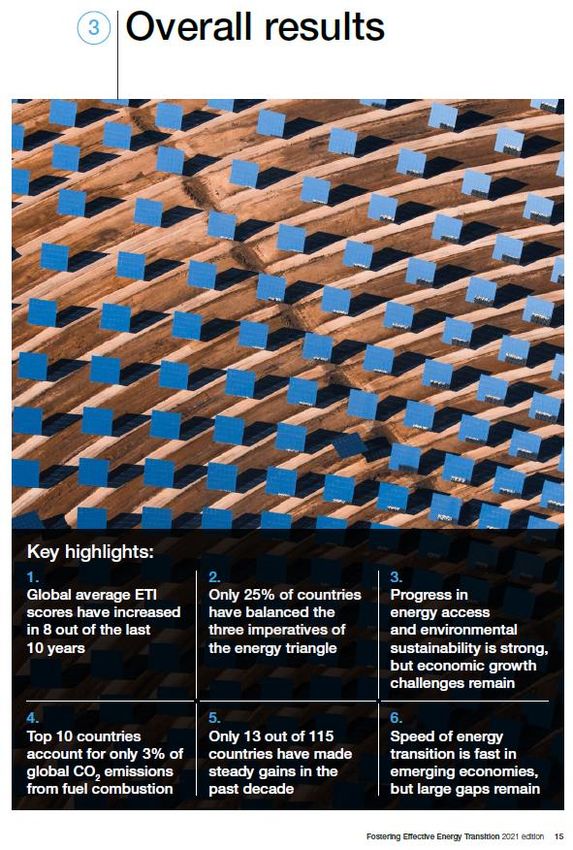
Sfide della transizione net-zero e performance del sistema energetico italiano
←
→
Page content transcription
If your browser does not render page correctly, please read the page content below
Sfide della transizione net-zero e performance
del sistema energetico italiano

Webinar FIRE
13 Luglio 2021

Francesco Gracceva (ENEA)
Sommario

1. Transizione energetica: definizione e caratteristiche
2. Caratteristiche essenziali della transizione Net-zero: scenari 2030-2050
3. Le sfide della transizione Net-zero
4. Valutare la transizione
     •    La traiettoria del sistema energetico globale
     •    La traiettoria del sistema energetico italiano
           • Un indice composito per valutare la performance del sistema energetico
           • Decarbonizzazione
           • Sicurezza energetica
           • Prezzi dell’energia e competitività tecnologica low-carbon

                                                                                      2
1. Transizione energetica: definizione e caratteristiche
2. Caratteristiche essenziali della transizione Net-zero: scenari 2030-2050
3. Le sfide della transizione Net-zero
4. Valutare la transizione
     •    La traiettoria del sistema energetico globale
     •    La traiettoria del sistema energetico italiano
           • Un indice composito per valutare la performance del sistema energetico
           • Decarbonizzazione
           • Sicurezza energetica
           • Prezzi dell’energia e competitività tecnologica low-carbon

                                                                                      3
La transizione energetica
“A shift in the nature or pattern of how energy is utilized within a system” (Araujo, The emerging field of
energy transitions: Progress, challenges, and opportunities)
• change associated with fuel type, access, sourcing, delivery, reliability, or end use as well as with the
overall orientation of the system.
• Change can occur at any level – from local systems to the global one – and is relevant for societal
practices and preferences, infrastructure
• The concept of a transition implies a temporary state, a change in a system from one equilibrium to
another. But what is changing? Energy system:
• historically, policy elites have defined energy systems in terms of fuel sources, but energy
systems are more than collections of fuels and technologies. Energy consumption profoundly
affects everything from how individuals work, play, socialize, and eat to how industries cluster,
how cities and economies grow, and how nations conduct their foreign affairs
• the set of technologies, physical infrastructure, institutions, policies and practices located in and
associated with a country/region which enable energy services to be delivered to the consumers of
that country/region
4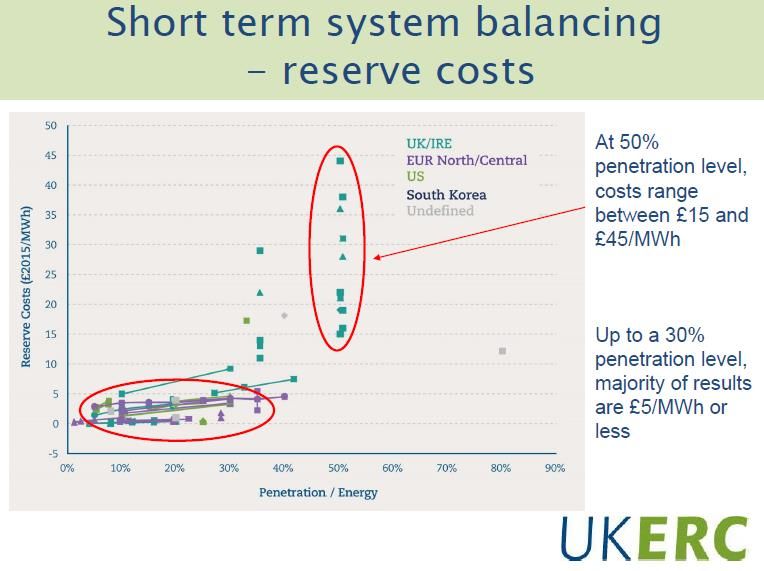
Due grandi transizioni

1. Initiated with a radical technological end use innovation: the steam
   engine powered by coal. The steam cycle represented the first
   conversion of fossil energy resources into work rather than simple
   heat. It allowed the provision of energy services to be site
   independent, since coal could be transported and stored as needed.
2. The greatly increased diversification of both energy end use
   technologies and energy supply sources. Most important single
   innovation was the introduction of electricity as the first energy
   carrier that could be easily converted to light, heat, or work at the
   point of end use. A second key innovation was the internal combustion
   engine, which revolutionized individual and collective mobility
   through the use of cars, buses, and aircraft. Again, this “diversification
   transition” was led by technological innovations in energy end use,
   such as the electric light bulb, the electric motor, the internal
   combustion engine, and aircraft. However, changes in energy supply
   have been equally far reaching.

                                                                                5
Lezioni del passato (1/4): caratteristiche sistemiche dell’evoluzione tecnologica
• systemic: a new technology needs not only to
be invented and designed, but it needs to be
produced. This requires a whole host of other
technologies as well as infrastructures
interdependence of technologies. (…) Periods
of economic development correspond with
clusters of interrelated developments in
artifacts, techniques, institutions, and forms of
social organization. These mutually
interdependent and cross-enhancing
“sociotechnical systems of production and
use” (Kline, 1985:2–4) cannot be analyzed in
terms of single technologies, but must be
considered in terms of the mutual interactions
among all concurrent technological,
institutional, and social change.
• cumulative: pattern of change depends on
previous choices, experience, knowledge
(Grubler 1998)
6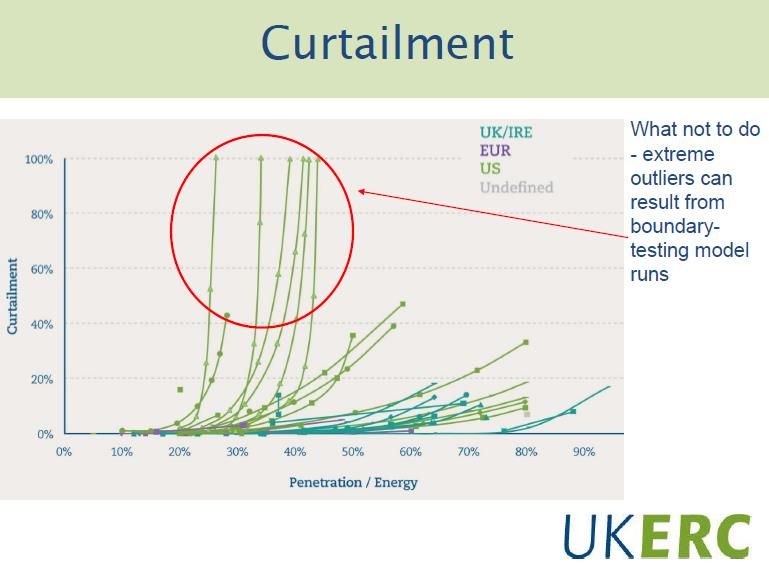
Lezioni del passato (2/4): ruolo preminente delle trasformazioni negli usi finali

•     Historical cause–effect relationship: technological and associated institutional/organizational transformations in
      energy end-use are the fundamental drivers of historical energy transitions.
       – Stationary and mobile steam power revolutionized manufacturing and transport which in turn expanded the
            demand for coal
       – Internal combustion engines, automobility, and petrochemicals were driving the growth of the oil industry.
       – Electrification of lighting, industrial drives, and transport (trams and locomotives) gave rise to electric
            utilities
•     Invariably, throughout the energy history of the US, energy end-use is much larger in terms of installed conversion
      capacity than energy supply. (Albeit, in terms of converted energy flows the difference is much smaller, due to
      significantly lower load factors in energy end-use)
                     Table - Energy technologies in the US by generic type and application (in GW, rounded numbers, italics denote first-order estimates)

                                                                         Source : Arnulf Grubler, 2012
                                                                                                                                                            7
Lezioni del passato (3/4): inerzia del sistema

•    Historical energy transitions have taken many decades: at the
     global level characteristic changeover times in primary
     energy range from 80 (growth of oil/gas/electricity replacing
     coal steam power) to 130 years (growth of coal steam power
     displacing pre-industrial, renewable energy sources).
•    Rigidità dello stock di capitale (alta intensità di capitale ,
     lunga durata, specificità di utilizzo delle delle tecnologie
     energetiche) e dell’organizzazione socio-economica
Lezioni del passato (4/4): costo dei servizi energetici
«historically, the important drivers
for the energy transitions were the
opportunity to produce cheaper
and/or better energy services. In a
majority of cases, a successful new
energy source or technology
provided the same service (i.e.
heating, power, transport or light)
with superior or additional
characteristics (e.g. easier, cleaner
or more flexible to use)”
(Fouquet 2016)
1. Transizione energetica: definizione e caratteristiche
2. Caratteristiche essenziali della transizione Net-zero: scenari 2030-2050
3. Le sfide della transizione Net-zero
4. Valutare la transizione
     •    La traiettoria del sistema energetico globale
     •    La traiettoria del sistema energetico italiano
           • Un indice composito per valutare la performance del sistema energetico
           • Decarbonizzazione
           • Sicurezza energetica
           • Prezzi dell’energia e competitività tecnologica low-carbon

                                                                                      10
Scenari globali: recente accelerazione
• IPCC Special Report on Global Warming of 1.5 °C
importance of reaching net‐zero CO2 emissions globally
by mid‐century or sooner to avoid the worst impacts of
climate change (IPCC, 2018).
• Net‐zero emissions pledges have been announced by
IEA, Net Zero by 2050 A Roadmap for the Global Energy Sector, 2021
national governments, subnational jurisdictions, coalitions
4 and a large number of corporate entities. As of 23 April
2021, 44 countries and the European Union have pledged
to meet a net‐zero emissions target: in total they account
for around 70% of global CO2 emissions and GDP. Of
these, ten countries have made meeting their net zero
target a legal obligation, eight are proposing to make it a
legal obligation, and the remainder have made their
pledges in official policy documents.
• If successfully fulfilled, the pledges to date would still
leave around 22 billion tonnes of CO2 emissions
worldwide in 2050. The continuation of that trend would
be consistent with a temperature rise in 2100 of around
2.1 °C.
11Scenari globali: molteplicità e incertezza
IEA, Net Zero by 2050 A Roadmap for the Global Energy Sector, 2021
12Scenari globali: tratti essenziali
• Energy efficiency, wind and solar provide around half of emissions
savings to 2030 in the NZE.
• the period to 2050 sees increasing electrification, hydrogen use and
CCUS deployment, for which not all technologies are available on IEA, Energy technology Perspective 2020
the market today, and these provide more than half of emissions
savings between 2030 and 2050.
IEA, Energy technology Perspective 2020
IEA, Net Zero by 2050 A Roadmap for the Global Energy Sector, 2021 13EC, Stepping up Europe’s climate ambition
“The Impact Assessment confirms that an ambition increase within
the range of 50% to 55% GHG reductions is possible, in a
responsible manner and deliver sustainable economic growth”
(EC, Stepping up Europe’s 2030 climate ambition – Impact Assessment (17.9.2020)
14Scenari UE: tratti essenziali
15
Tsiropoulos I., Nijs W., Tarvydas D., Ruiz Castello P., Towards net-zero emissions in the EU energy system by 2050 – Insights from scenarios in line
with the 2030 and 2050 ambitions of the European Green Deal, JRC Technical reportScenari UE: tratti essenziali / Energia primaria per fointe
Tsiropoulos I., Nijs W., Tarvydas D., Ruiz Castello P., Towards net-zero emissions in the EU energy system by 2050 – Insights from scenarios in line
with the 2030 and 2050 ambitions of the European Green Deal, JRC Technical report
16Scenari UE: tratti essenziali /
Elettrificazione e generazione per tecnologia
Tsiropoulos I., Nijs W., Tarvydas D., Ruiz Castello P., Towards net-zero emissions in the EU energy system by 2050 – Insights from scenarios in line
with the 2030 and 2050 ambitions of the European Green Deal, JRC Technical report
17Scenari Italia 2030 - PNIEC
18Scenari Italia 2050 / Strategia lungo termine
Scenari Italia 2050 /
Strategia lungo termine
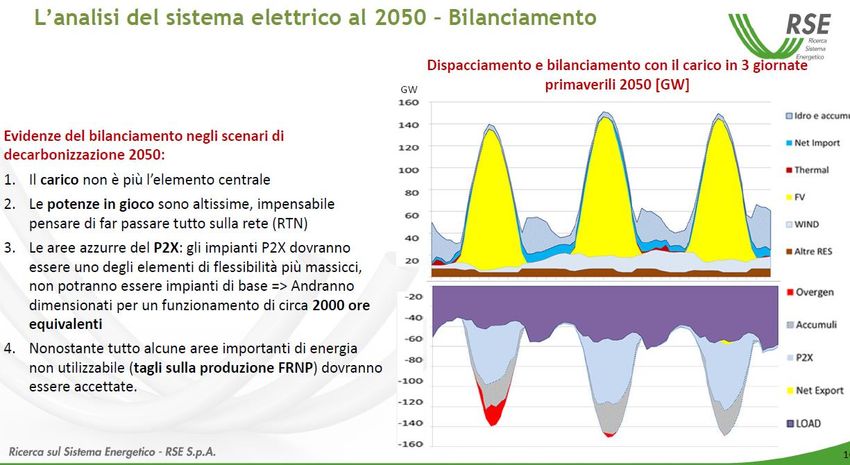
20Scenari Italia 2050 / Strategia lungo termine: sistema elettrico pivot del sistema
Sistema elettrico trasformato radicalmente e “pivot” del sistema energetico complessivo. Elettricità essenziale abilitare altri canali di riduzione:
• la generazione di combustibili con apporto nullo di CO2 (energia elettrica per la produzione di idrogeno ed e-fuels);
• la generazione diretta di calore senza emissione di CO2;
• l’applicazione in sistemi più avanzati come la sottrazione diretta di CO2 dall’atmosfera (DAC).
Generazione elettrica, inoltre: opportunità di sottrazione della CO2 da fonti emissive centralizzate (CCU e CCS) alimentate da bioenergie e da gas
naturale, sia da stoccare ( “emissioni negative” se CO2 di provenienza bio) sia per il riutilizzo nella produzione di combustibili carbon-free.
L’effettiva capacità del sistema elettrico di svolgere questo ruolo-chiave 3 macro ordini di condizioni tra loro fortemente connessi:
1. incremento della produzione elettrica e sua completa decarbonizzazione fabbisogno di elettricità fino a circa 650 TWh, più del doppio
rispetto ai livelli attuali. la capacità installata fotovoltaica raggiungerebbe valori dell’ordine di circa dieci volte il livello attuale; l’apporto
dell’eolico, sia on-shore che off-shore, potrebbe salire a 40-50 GW.
2. capacità di gestire una quota massiccia di fonti intermittenti e flessibilità del sistema elettrico capacità di sistemi di accumulo elettrochimici
su rete e distribuiti (nell’ordine dei 30-40 GW con energia complessivamente accumulata per 70-100 TWh); sviluppo di tutto il potenziale
stimato di nuovi impianti di pompaggio aggiuntivi rispetto agli attuali 7 GW (ulteriori 10 GW, comprensivi degli sviluppi già previsti nel PNIEC al
2030); gli impianti di produzione di e-fuels, assieme agli impianti Power to heat e ai sistemi DAC, diventano funzionali alla stabilità del sistema
elettrico stesso introducendo capacità di accumulo e di consumo flessibile (per una potenza stimata tra i 70 e i 100 GW: come visto sopra, si
produce metano green, idrogeno, calore e combustibili liquidi); altre forme flessibili di utilizzo dell’energia elettrica con sistemi di accumulo di
calore stagionale, anche per le reti di teleriscaldamento; nuove forme di gestione della domanda capaci di restituire flessibilità.
3. forte integrazione delle infrastrutture elettriche con il resto del sistema energetico, in grado di ottimizzare la gestione dei diversi vettori
energetici.
21Scenari Italia / sistema elettrico pivot?
Congruità con: attuale parco di generazione? sistema elettrico 2030?
«non è proponibile inserire direttamente nella rete elettrica italiana
la produzione fotovoltaica ed eolica proposta per il 2030»
non tutta l’elettricità da fossile può essere sostituita: la produzione
termoelettrica in cogenerazione non può essere sostituita
direttamente da fotovoltaico o eolico
rete di trasporto di TERNA progettata per una molteplicità di
centrali baricentriche alle aree servite; ora eolico e fotovoltaico
sono al sud ma la rete di trasporto non può trasportare più di 4-5
GW; già oggi nei weekend estivi si è vicini, al sud, alla condizione
di sovrapproduzione con distacco obbligato
Analisi RSE confermano l’estrema difficoltà e complessità di
questa transizione; ipotesi di simulazione primavera del 2050
la quota maggiore di impiego della energia fotovoltaica è nella
trasformazione in combustibili, P2X, un terzo va alla copertura
della domanda, un 15% è accumulato come elettricità mentre nei
fine settimana ci sono sovraproduzioni.
(Tomassetti, 2021)
221. Transizione energetica: definizione e caratteristiche
2. Caratteristiche essenziali della transizione Net-zero: scenari 2030-2050
3. Le sfide della transizione Net-zero
4. Valutare la transizione
• La traiettoria del sistema energetico globale
• La traiettoria del sistema energetico italiano
• Un indice composito per valutare la performance del sistema energetico
• Decarbonizzazione
• Sicurezza energetica
• Prezzi dell’energia e competitività tecnologica low-carbon
23Le sfide della transizione Net-zero
As Europe embarks upon an unprecedented shift in the decarbonisation of its economy, significant dilemmas and trade-offs loom. …
to navigating increasingly unchartered waters, namely Europe’s energy transition trajectory (OIES, June 2021)
• “EU has consistently identified three core objectives of its energy
policy; sustainability, competitiveness and security of supply. At
least in theory, these have been viewed to be an equilateral
triangle, with all objectives being equally important and to be given
equal weight in policymaking. However, in reality, at different points
in time, the three priorities have been given different levels of focus.
In 'pre-Kyoto' times, competitiveness and energy security were the
main focus of European energy policy, with the development of the
Internal Energy Market and the initiatives to develop
infrastructure… Since 2009 … the priority has unequivocally been
sustainability (FSR, 2021)
• “Triple challenge of providing secure, affordable, and
environmentally sustainable energy” (WEC).
• Una transizione energetica efficace è “timely transition towards a
more inclusive, sustainable, affordable and secure energy system
that provides solutions to global energy-related challenges, while “main tension has always been between affordability and sustainability, as
creating value for business and society, without compromising the security of supply is taken as an over-riding objective…”
balance of the energy triangle” (World Economic Forum, 2021) Centre on Regulation in Europe, The energy transition in Europ: initial lessons…, 2015
24Le sfide della transizione Net-zero / Fattibilità
• New “Shared Socioeconomic Pathways
(SSPs), inputs for latest climate models
feeding into next IPCC 6th AR, examine how
global society, demographics and economics
might change over the next century, and how
the climate goals of the Paris Agreement
could be met
• Mitigation and adaptation to climate change
can be much easier in some versions of the
future than in others
• Some versions of the future can make the
“Well Below 2C°” Paris target even
impossible
https://www.sciencedirect.com/science/article/pii/S0959378016300681
https://www.nature.com/articles/s41558-018-0091-3
25Le sfide della transizione Net-zero / Sicurezza energetica
As Europe is one of the largest oil and gas importers in the
global economy, the security impact of the energy transition
has tended to be discussed in a geopolitical framework:
renewables and energy efficiency reduce fossil fuel imports
and thus improve energy security. While this is certainly true,
Europe should not underestimate the new energy security
challenges associated with the rapid transformation of its
energy system.
Even in the age of conventional energy, the most powerful
public image of an energy security crisis is a major city in the
dark. Electricity plays a unique role in a modern society and
its importance will increase further: with wind and solar-based
electrification emerging as the most likely credible pathway to
decarbonise applications like light transport and heating,
electricity will be even more essential.
Given that a single blackout can shape social and political
attitudes for a decade, robust electricity security is a key
precondition for a viable transition.
(OIES, June 2021)
26Le sfide della transizione Net-zero / Power system security
• “The long-term trend of electrification and the rising
Flexibility challenges at 50-60% VRE
share of variable renewable technologies in electricity
generation are shifting the focus of energy security to
the reliability and resilience of electricity systems.”
• “importance of technological advances in providing
electricity system flexibility, as well as of adequate
investment in all aspects of electricity generation and
transmission and distribution infrastructure”
• IEA, Energy technology perspectives 2020
Beyond the Tipping Point. A Bloomberg New Energy Finance study commissioned by Eaton in
partnership with the Renewable Energy Association, Presentation for CEER, March 1, 2018• A number of challenges were not addressed at the time of the 2009 climate and energy package. (…) The management
challenges linked to the introduction of renewables (…). The Third Energy package (…) did not address the issue of
whether the market offered the necessary incentives to invest in a system with greater shares of RES.
• The current climate and energy targets were designed to be mutually supporting and there are indeed interactions
between them. (…) There are obvious synergies but there are also potential trade-offs.
• Some stakeholders have criticized the lack of overall consistency between policies (…) and have pointed to the need to
improve the cost-efficiency of various climate and energy measures (…)
• The policies have been criticised for having a negative impact on energy prices, adversely impacting affordability of energy
for vulnerable households and the competitiveness of energy intensive sectors (COM(2013) 169 final)Le sfide della transizione Net-zero / Feasibility of 100% electricity system Heard Brook, Wigley, Bradshawd, Burden of proof: A comprehensive review of the feasibility of 100% renewable-electricity systems, Renewable and Sustainable Energy Reviews, 76 (2017) 1122–1133 “While many modelled scenarios have been published claiming to show that a 100% renewable electricity system is achievable, there is no empirical or historical evidence that demonstrates that such systems are in fact feasible” “None of the 24 studies provides convincing evidence that basic feasibility criteria can be met ”
Le sfide della transizione Net-zero / Costi

Different versions of the future bring different costs
• “Mitigation costs are heavily influenced by the
  availability, cost, and performance of mitigation
  technologies”
• “the influence of technology on costs generally
  increases with increasing stringency of the
  concentration goal”
(IPCC, 5th AR, chapter 6)

https://www.sciencedirect.com/science/article/pii/S0959378016300681
https://www.nature.com/articles/s41558-018-0091-3

                        5th AIEE Energy Symposium – 15-17 December, 2020   30
Le sfide della transizione Net-zero / Socio-tecnnical feasibility
Interdependent social, political, cultural, and technical processes of
transitions.
• Technology, of itself, has no power, does nothing. Only in association
with human agency, social structures and organisations does
technology fulfil functions Technology as ‘configurations that work’:
alignment between a heterogeneous set of elements that fulfils a
function (Geels, 2002)
• Example: the car-based transportation system (in most Western
countries accounting for 80%–85% of passenger-kilometers).,
sustained by formal and informal institutions, such as the preferences
and habits of car drivers; the cultural associations of car-based
mobility with freedom, modernity, and individual identity; the skills
and assumptions of transport planners; and the technical capabilities
of car manufacturers, suppliers, and repair shops (Geels, 2002, 2017)
• Più le scelte si orientano verso nuove frontiere tecnologiche più stretta
e determinante ai fini del successo diviene l’interdipendenza delle
decisioni degli operatori nelle diverse fasi delle nuove filiere
produttive. (…) Per ogni filiera un reticolato di mille decisioni
sequenziali e iterative (Clô 2017)
• policy strategies that are both cost-effective and sociopolitically
feasibilitySommario
1. Transizione energetica: definizione e caratteristiche
2. Caratteristiche essenziali della transizione Net-zero: scenari 2030-2050
3. Le sfide della transizione Net-zero
4. Valutare la transizione
• La traiettoria del sistema energetico globale
• La traiettoria del sistema energetico italiano
• Un indice composito per valutare la performance del sistema energetico
• Decarbonizzazione
• Sicurezza energetica
• Prezzi dell’energia e competitività tecnologica low-carbon
32La traiettoria del sistema energetico globale
33La traiettoria del sistema energetico globale
• Out of 115 countries, 92 countries have made progress over this
period, but only 68 have improved their scores by more than two
percentage points. Notably, large emerging centres of demand, such
as China and India, have seen strong improvements.
• Meanwhile, scores in Brazil, Canada, Malaysia, Singapore and Turkey
have been relatively stable.
• Only 13 out of the 115 countries have made steady gains (defined as
consistently aboveaverage performance improvements on the ETI).
• This demonstrates the difficulty of sustaining progress and the inherent
complexity of the energy transition. In the next decade, consistent,
accelerated progress is key to meeting the world’s climate targets as
well as the UN’s Sustainable Development Goals.
341. Transizione energetica: definizione e caratteristiche
2. Caratteristiche essenziali della transizione Net-zero: scenari 2030-2050
3. Le sfide della transizione Net-zero
4. Valutare la transizione
• La traiettoria del sistema energetico globale
• La traiettoria del sistema energetico italiano
• Un indice composito per valutare la performance del sistema energetico
• Decarbonizzazione
• Sicurezza energetica
• Prezzi dell’energia e competitività tecnologica low-carbon
35La traiettoria del sistema energetico italiano: Consumi di energia primaria
• 2020: calo record in tempo di pace del fabbisogno di • Fabbisogno di energia: primaria a ≈154 Mtep, livello di
energia primaria: -10% fine anni ’80, -22% vs 2005 (massimo storico)
• Nel 2009 calo del 5,7% (in linea con il PIL) • Intensità energetica -1%, in linea con ultimo decennio
200 0,18
0,17
180 0,16
0,15
160 0,14
0,13
140 0,12
0,11
120 0,10
1971 1976 1981 1986 1991 1996 2001 2006 2011 2016
Energia primaria (Mtep) Intensità energetica (tep/M€, asse dx)
36La traiettoria del sistema energetico italiano / Consumi di energia primaria
• Calo dei consumi di energia concentrato nel II trimestre • Evoluzione consumi parallela a quella dei driver
(-20% tendenziale), -30% ad aprile • Ma caduta consumi > di quello dei driver: PIL (-8,8%),
• Nel III e IV trimestre variazioni negative del -6% circa, produzione industriale (-11%), clima (più mite nel I
con accelerazione del calo a fine anno, nascosto dal trimestre ma più rigido nel IV) e prezzi dell’energia (in
clima più rigido forte calo) superindice ENEA -8%
• Stima preliminare I trimestre 2021: calo quasi nullo • Crollo dei volumi di traffico (sia stradale che aereo),
(anche grazie al clima) molto maggiore di quella dell’attività economica
ott-19
100
nov-19
dic-19
80 feb-20
feb-20
60 mar-20
apr-20
mag-20
40 giu-20
lug-20
20 ago-20
set-20
ott-20
0 nov-20
PIL Prod. industriale Traffico
dic-20
37La traiettoria del sistema energetico italiano / Consumi di energia primaria
CAGR PIL = +1,5% CAGR PIL = -1% CAGR PIL = +2%
CAGR TPES = +1,4% CAGR TPES = -2,4% CAGR TPES = -0,4%
38La traiettoria del sistema energetico italiano: Emissioni di CO2 nell’ultimo decennio
• Calo record emissioni di CO2: -12% (-38 Mt), maggiore • Nel decennio settore elettrico principale driver del calo
del calo dell’energia primaria, più del -10% del 2009 delle emissioni (fino al 2019 oltre la metà del calo totale)
• A fine anno emissioniLa traiettoria del sistema energetico italiano: Decarbonizazione
450
• Definitivo raggiungimento CAGR PIL = -0,7% CAGR PIL = +2%
degli obiettivi 2020 400
• 3/4 della riduzione delle
emissioni dalla congiuntura 350
economica, 1/4 a
componenti «strutturali» 300
(intensità energetica e
250
intensità carbonica
dell’energia)
200
• Ma nuovi obiettivi UE al 2010 2015 2020 2025 2030
2030… Dati storici scen. PNIEC 2020
Strat. LT 2021 CO2 proiez. Pessim.
40La traiettoria del sistema energetico italiano / Scenari di decarbonizazione
Tre fasi:
• 2007-2014: forte t.m.a. riduzione intensità energetica
• 2014-2019: rallenta t.m.a. riduzione intensità energetica
• 2020: risale la riduzione dell’intensità energetica e carbonica
«Non virtuosa» correlazione positiva tra le due intensità e crescita economica?
Cali intensità comunqueLa traiettoria del sistema energetico italiano / Decarbonizzazione ed «efficienza»
• Calo consumi di energia (-10%) > delle variabili guida • Differenza fra andamento consumi energetici e variabili
(sintetizzate nell’indice delle variabili guida ENEA, -8%) guida stima di massima delle riduzioni dei consumi di
• Ma l’andamento del fabbisogno di energia resta energia riconducibili a fattori «strutturali»
coerente l’andamento della variabili guida • Disaccoppiamento economia/energia più forte nella
prima metà del decennio, poi rallentato con la ripresa
• L’impatto dell’emergenza sanitaria sulla mobilità
5% possibile nuovo fattore «strutturale»?
0%
140 18
-5%
135 16
-10% 130 14
12
-15% 125
10
120
-20% 8
115
-25% 6
I III I III I III I III I III I III I III I III I III I III I III I III I 110 4
2009 2010 2011 2012 2013 2014 2015 2016 2017 2018 2019 20202021 105 2
Cons. finali energia Superindice variabili guida 100 0
2010 2011 2012 2013 2014 2015 2016 2017 2018 2019 2020
Stima risparmi "strutturali" Consumi finali di energia
Proiezione cons. secondo driver
42La traiettoria del sistema energetico italiano / Sicurezza energetica - Raffinazione
• Crack spread su benzina e gasolio ai minimi • Forte calo dell’utilizzo degli impianti (≈65%)
decennali, sul carboturbo su valori negativi • Sui minimi della prima parte del decennio scorso,
• Margini in forte calo ovunque, nell’area Med in quando la capacità di raffinazione fu ridotta di ≈20 Mt
territorio negativo ininterrottamente dal II trimestre
dell’anno, negativi anche nell’Europa Nord Occidentale
nel III trimestre 100%
Francia
90% Germania
10
80% Italia
6
70% Spagna
60% Regno
2 Unito
Europa
50%
OCSE
-2
2006 2007 2008 2009 2010 2011 2012 2013 2014 2015 2016 2017 2018 2019 2020
Mediterraneo Europa N.O. Dubai US GC
43La traiettoria del sistema energetico italiano / Sicurezza energetica - Sistema elettrico
• «Il sistema ha retto l’urto» di un’improvvisa • Segnali di criticità: contributo decisivo alla flessibilità
anticipazione del sistema elettrico del 2030 fornito da eolico e import:
• Nuovi massimi storici per FRNP (20% mensile a • Indicazioni di limitazioni significative alla
maggio, >70% su base oraria) produzione eolica con ordini di dispacciamento
nel 2020 nuovo massimo storico (0,8 TWh, 4,5%
della prod. Eolica)
• Esportazioni nette elevate per periodi prolungati
• Scarsità di margini di generazione programmabile
e flessibile
5,000
3,000
1,000
-1,000
-3,000
-5,000
1 7 1319 1 7 1319 1 7 1319 1 7 1319 1 7 1319 1 7 1319 1 7 1319
27-Apr 28-Apr 29-Apr 30-Apr 1-May 2-May 3-May
Diff. Previsione-Produzione eolica Import netto
44La traiettoria del sistema energetico italiano / Sicurezza energetica - Sistema elettrico
• Forti incrementi del ricorso di Terna a MSD: nuovo
• Dispacciamento e prezzi – 1 maggio 2020 massimo annuale (+12%), +60% tra marzo e
maggio
45La traiettoria del sistema energetico italiano / Competitività italiana nelle tecnologie
low-carbon
• Importazioni totali di merci economia italiana -14% • Quota mobilità verde sulle importazioni low-carbon
• Tecnologie low-carbon >2 mld€ (+27%) e disavanzo >50% (1/3 nel 2019)
commerciale > 1 mld€ (+60%) • Quota PHEV raddoppiata, quote BEV e Li-Ion +50%
• Saldi normalizzati in peggioramento, tanto più quanto
maggiore il contenuto low-carbon 100%
90%
0.2 0 80%
Totale merci 70%
0.0 -200
60%
Totale low- 50%
-0.2 -400 carbon
40%
Totale core 30%
-0.4 -600 low-carbon
20%
-0.6 -800 Mobilità 10%
verde
0%
2017 2018 2019 2020**
-0.8 -1,000 Saldo comm.
Low-carbon BEV PHEV Li-Ion ACC SOLAR PV WIND
(M€, dx)
-1.0 -1,200
2017 2018 2019 2020
46La traiettoria del sistema energetico italiano / Valutazione di sintesi
• ISPRED +38% su base annua • Forti miglioramenti degli indici prezzi (+80%) e
decarbonizzazione (+40%), in lieve calo l’indice della
• Ma +3% nel IV trimestre quanto congiunturale,
sicurezza energetica
quanto strutturale?
• Ridotti i differenziali positivi tra prezzi all’ingrosso e al
• Tornato >0,5 (situazione di miglioramento relativo
dettaglio italiani e altri UE quanto strutturale?
rispetto all’orizzonte temporale)
• Nel 2021 peggiorano tutte le componenti
• Nuovo forte peggioramento nel I trimestre 2021, già sui
valori di inizio 2020 • In generale le tre dimensioni non sembrano correlate
positivamente trade-off?
47Alcune conclusioni
• La transizione energetica è una sfida enorme, con molteplici
implicazioni e possibili trade-off
• Understand if / to what extent alternative images of the future net-zero
energy system can have different implications
• Are these alternative futures feasibile? What are their costs?
• Ruolo centrale
• riduzione dell’intensità energetica
• sfide nel settore elettrico
• decarbonizzazione mobilità e trasporti
• Anno che non ha precedenti quanto di congiunturale quanto di
strutturale? Transizione italiana non in linea con gli obiettivi
48https://www.enea.it/it/seguici/pubblicazioni/analisi-trimestrale-del-sistema-energetico-italiano/analisi-trimestrale-del-sistema-energetico-italiano
francesco.gracceva@enea.it50
Adequacy : theory and insights from recent trends
Peak load adequacy during hours with high demand and low renewable input; contribution of
variable renewables to peak demand can be low: low capacity credit of wind / solar
Enough dispatchable capacity is needed to meet peak demand (incl. generation capacity, storage
and demand response) BUT low capacity factors
Peak load adequacy Capacity margin Italy 2013-2017
Baritaud, 2012Adequacy and flexibility: theory and and insights from recent trends
Minimum load balancing: need to maintain generation equal to the load during hours with low
demand and high RES input; minimum residual load
Hours of excess VRE output (negative residual load)
2011
Risk of curtailment
17/04/2017
6,000 3,000
Termoel.
5,000 2,000
Idro
4,000 1,000
Eolico
3,000 0
FV
2,000 (1,000)
D tot.
1,000 (2,000) (asse dx)
Baritaud, 2012 D residua
0 (3,000) (asse dx)
1 3 5 7 9 11 13 15 17 19 21 23Increased frequency of low/negative prices
VER shift the supply curve of conventional electricity virtually out of the market temporarily
very low market prices close to zero
Negative prices can occur if wind has to be dispatched and conventional load are running at
their minimal technical level and want to avoid shut down for economic reasons or must be kept
online for system security reason
Spark spread Italy 2008-2017 and %
thermal generation
40 80%
75%
30
70%
20 65%
60%
10 55%
50%
0
45%
-10 40%
1 5 9 1 5 9 1 5 9 1 5 9 1 5 9 1 5 9 1 5 9 1 5 9 1 5 9 1 5 9
2008 2009 2010 2011 2012 2013 2014 2015 2016 2017
Italia % gener. termica
Integrating variable energy resources at the California ISO
Presented to the Air & Waste Management Association Mother Lode Chapter
March 22, 2016, Delphine HouImplications of increasing share of RES/VER: evidence based
approach (UKERC)
Trade-offs of conventional plants to back up v-
RES: effect of partloading on efficiency – and
hence emissions – often neglected. CCGT
efficiency drops as low as 35% when its load is
reduced to 50% or less of the rated power
output – an efficiency reduction of 20
percentage pointsYou can also read