ELECTRICITY GENERATION - FACTS AND FIGURES - VGB PowerTech e.V.
←
→
Page content transcription
If your browser does not render page correctly, please read the page content below
FACTS AND FIGURES

ELECTRICITY GENERATION   2019|2020
FAC TS A N D FI G U R ES                                                                                       EL E C T R I C I T Y G EN ER AT I O N 2019 l 2020

DEVELOPMENT OF THE GLOBAL AND EUROPEAN ELECTRICITY DEMAND

T    he global population of 7.7 billion people is increasing by 90 million
     people per year. Electricity consumption will grow faster, average 2000
to 2017: 66 %, than any other form of energy consumption due to an increas-
                                                                                    Contents

                                                                                    n Electricity demand worldwide and in the EU                         2  – 3
ing demand and population growth − one quarter of the global population
                                                                                    n Renewables (RES) in the EU                                             4
does not yet has access to electricity. Additionally, digitisation, electromobil-
ity and sector-coupling will increase electricity demand.                           n Hydro power, wind energy, biomass                                  5–7
The IEA estimates in its main preferred scenario, “New Policies Scenario”           n Distributed power, storage technologies                            8–9
that in all fields and regions the annual demand will increase by +2.0 %
                                                                                    n Flexible conventional power plants                             10 – 11
until 2040. The worldwide gross electricity consumption will increase from
25,679 billion kWh to 40,443 billion kWh; an yearly increase of about               n Framework for conventional power plants                        12 – 13
2.0 %. The “New Policy Scenario” of the IEA covers a reduction of green-            n Nuclear power worldwide                                        14 – 15
house-gas emissions with respect to known policies announcements.                   n Small modular reactors                                         16 – 17
Further scenarios e.g. by BP, ExxonMobil and the U.S. Energy Administra-
tion (EIA) and are available. According to all forecasts the worldwide electric-    n New power generation capacities needed                         18 – 19
ity demand will increase by 2040 in a range of 34,000 to 42,000 billion kWh         n Global climate policy needed                                   20 – 21
per year. At +0.3 % p.a., the increase in electricity demand in the EU is lower.    n VGB: Activities and members                                    22 – 23
Generation capacities worldwide are increasing with +2.0 % p.a., a signifi-
                                                                                    n Imprint                                                               24
cant increase.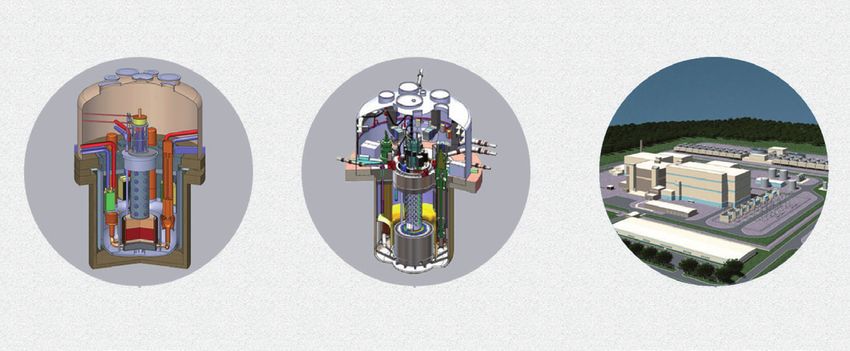
Expected growth in electricity generation in billion (109) kWh worldwide                                                                     Expected growth in electricity generation in billion (109) kWh in the EU

45,000
                                                                                                                                             4,500
                                                                                                                             IEA:
                                                                                                                                                                                                                      New Policies Scenario
                                                                                                                     New Policies Scenario
40,000                                                                                                                                                                                                                       +8 %
                                                                                                                           +61 %             4,000                                                                      +0.3 % per year
                                                                                                                      +2.0 % per year

                                                                                                                                             3,500

                         New Policies Scenario (IEA)

                                                                             EIA - Reference Scenario
30,000
                                                                                                                                             3,000

                                                       BP - Energy Outlook

                                                                                                                                                                                        New Policies Scenario (IEA)
                                                                                                                      Wind,                  2,500

                                                                                                        ExxonMobil
                                                                                                                      biomass, solar                                                                                  Wind,
                                                                                                                                                                                                                      biomass, solar
20,000
                                                                                                                      Hydro                  2,000
                                                                                                                                                                                                                      Hydro
                                                                                                                      Nuclear
                                                                                                                                             1,500                                                                    Nuclear
                                                                                                                      Fossil
10,000                                                                                                                                                                                                                Fossil
                                                                                                                                             1,000

                                                                                                                                               500

     0
         2017                                             2040                                                                                   0
                  Year                                                                                                                                           2017                  2040
                                                                                                                                                                          Year

                                                                                                                                                          Sources: IEA, BP, U.S. EIA, ExxonMobil, EU Commission, VGB (own calculations)

                                                                                                                                                                                                                               PAG E 2 – 3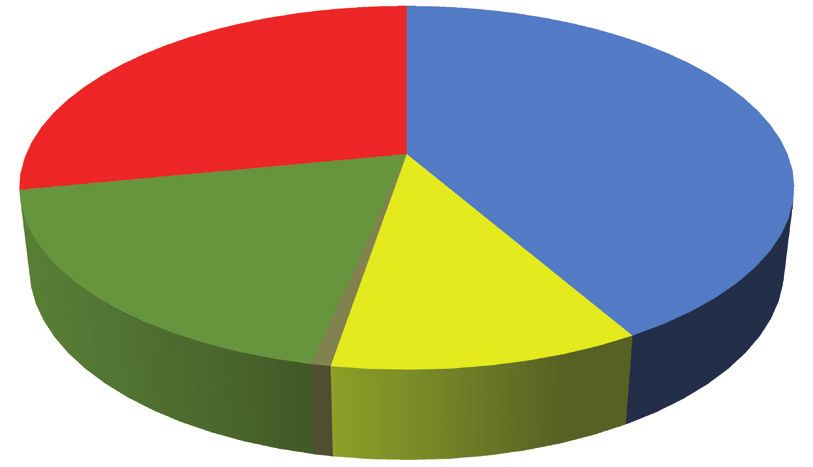
FAC TS A N D FI G U R ES EL E C T R I C I T Y G EN ER AT I O N 2019 l 2020
RENEWABLES – EU’S AMBITIOUS TARGETS FOR 2020
The EU and their member states have set binding, ambitious targets to Sweden 49 Target
54.5
promote the expansion of renewable energy sources. For the electricity sec- Finland 41.0 38 Target reached
reached
tor, the EU expects renewables to account for 34 % by 2020. Latvia
Denmark
39.0
35.8
40
30 Target reached
Since the implementation of the EU Directive for climate protection and Austria 32.6 34
energy ‒ often referred to as the “20-20-20 package” ‒ adopted in Decem- Estonia
Portugal
29.2
28.1
25 Target reached
31
ber 2008, the share of renewables in gross final energy consumption has Croatia 27.3 20 Target reached
increased steadily. In 2017 the share reached 17,5 %, almost twice as high Lithuania
Romania
25.8
24.4
23 Target reached
24 Target reached
as in 2004 (8.5 %). This represents an increase of 0.5 percentage points Slovenia 21.6 25 EU-targets for RES till 2020:
over the previous year 2016. Bulgaria
Italy
18.7
18.3
16 Target reached
17 Target reached 20 % share of renewable
energy in gross final energy
At 54.5 %, Sweden‘s share of renewables was by far the highest in 2017, Spain 17.5 20
consumption
followed by Finland (38.7 %), Latvia (37.2 %), Denmark (35.8 %) and Greece
France
16.3
16.3
18
23 10 % share of energy
from renewable sources
Austria (32.6 %). The lowest shares of renewable energy were registered for Germany 15.5 18 in transport
Czech. Republic 14.8
Luxembourg (6.4 %), the Netherlands (6.6 %) and Malta (7.2 %). In total, Hungary 13.3
13 Target reached
13 Target reached
eleven of the 28 EU member states have met their 2020 targets: Bulgaria, Slovakia 11.5 14 EU
Czech Republic, Denmark, Estonia, Croatia, Italy, Lithuania, Hungary, Poland
Ireland
11.0
10.7
15
16
2017: 17.5 % 2020: 20 %
Romania, Finland and Sweden. Austria and Lithuania are missing about United King. 10.2 15
Cyprus 9.9 13
1-%-point to reach its target for 2020. Belgium 9.1 13 2017
Energy from renewables will play a key role for the years after 2020. For this Malta 7.2 10 Target 2020
Netherlands 6.6 14
reason, the member states have agreed on a new EU target of at least 32 % Luxembourg 6.4 11
by 2030. EU-28 17.5 20
0 10 20 30 40 50 60
Share of renewables of gross final energy consumption in %
Source: Eurostat 2019 (data base: 2017)HYDRO POWER – AN INDISPENSABLE SOURCE OF ENERGY
Hydro power is not only a reliable renewable energy source, but also the
frontrunner in Europe in the generation of electricity from renewable en-
ergy sources. With a production of more than 332 TWh – around 33.0 % Target for RES-electricity Status 2017 – Total: 1,006 TWh
of the electricity generated from renewable energy sources – hydro power in EU-28 Target in 2020: 1,196 TWh
makes a significant contribution to achieving the EU target of 34 % of 2017 2020
83 target; current targets achieved
In brackets (...): Individual
electricity generation from renewable energy sources by 2020. 30.5 % 34.0 % 304
In addition to the predictable and constant generation of run of river pow-
er plants for base load coverage, the provision of reserve power and peak
load to ensure security of supply and, in particular, control power to main- Wind energy
Hydro power
tain grid stability in an increasingly flexible energy market is becoming
362
more and more important. In Europe, these requirements are primarily met (495; 73 %) 332
by high-efficiency pumped storage and storage hydro power plants with a (355; 93 %)
total installed bottleneck capacity of more than 48,506 MW.
Hydro power is therefore not only an extremely efficient, reliable and stor- 185
(232; 80 %) 119
able form of energy, but also an indispensable renewable source of energy (103; 116 %)
7
which has to be conserved and further developed within the framework of (11; 61 %)
the energy transition.
Biomass
Geothermal Solar energy
Source: Eurostat 2019 (data base: 2017)
PAG E 4 – 5FAC TS A N D FI G U R ES EL E C T R I C I T Y G EN ER AT I O N 2019 l 2020
WIND ENERGY – A MAINSTAY OF THE ENERGY TRANSITION
In order to meet the European Union’s targets for the energy and climate
package by 2020, it is also imperative to further expand the use of wind Wind power:
energy. In Germany at the end of 2018, around 30,518 wind turbines with Capacities in Europe
end of 2018 in MW
a total capacity of 59,311 MW were in operation. At that time, the installed
capacity of wind turbines in Europe was 189,229 MW and worldwide Total Europe*:
FI
592,000 MW. 189,229 MW
NO 2,041
A retrospective analysis of the wind turbine market reveals continuous fur- 1,675 SE
7,407
ther development of system technology, accompanied by increasing rated ES 310
power, rotor diameter and hub height. From the first small plants with an IR DK LV 66 RU
^39
5,758
average output of around 30 kW and rotor diameters of less than 15 m in 3,564
UK NL LT 439
20,970 4,471 BY
the mid-1980s, machines with a rated power of 8 MW and more as well as DE PL
3
BE
rotor diameters of 160 m have been developed. Wind turbines have already 3,360 59,311 5,864
paid for themselves in terms of energy after three to seven months of op- LU
FR 120
CZ
317
UA
533
SK 3
eration. This means that after this time the turbine has produced as much 15,309 CH 75 AT
3,045 HU RO
energy as is required for its production, operation and disposal. In addition PT
SI HR
329 3,029
to the consistent further development of system technology, the optimiza- 5,380 ES
23,494
IT
9,958
3 583
BG
tion of maintenance strategies in particular will play a decisive role in the 691
future in order to increase technical availability and thus economic effi- GR TR
7,369
2,844
ciency. Especially reliability, weight, costs and efficiency play a key role in
this respect.
CY 158
* Including not listed countries. Source: WindEuropeBIOMASS – THE ALL-ROUNDER
Energy production from biomass is a decisive component of the energy
transition. Currently, 185 TWh of electricity is produced from biomass in
Europe, which means that biomass accounts for 18.4 % of renewable elec- Biomass: Development of electricity generation in the EU
tricity generation. In Europe, Sweden, Italy, Germany and the United King- Sweden Italy Germany United Kingdom EU-28
dom were the countries with the highest electricity production from bio- 250
mass in 2017.
Biomass is used as a fuel in thermal power plants or is fermented to produce
Electricity generation in billion (109) kWh
methane in biogas plants. Biomass power plants meet the same require- 200
ments for the stability of the electricity grid as fossil-fired power plants.
They are suitable for base-load as well as for the supply of balancing and
control power. In addition, it is also possible to convert coal-fired power 150
plants to biomass in order to continue using existing sites. Biogas is usually
used in gas engines to generate electricity or can be fed into the natural gas
grid. This contributes a considerable storage potential. 100
Biomass power plants and biogas plants can be used both in centralized and
distributed systems. Biomass, as an all-round renewable energy source, is
therefore an indispensable component of future energy supply systems. 50
0
2011 2012 2013 2014 2015 2016 2017 2020
Year
Source: Eurostat
PAG E 6 – 7FAC TS A N D FI G U R ES EL E C T R I C I T Y G EN ER AT I O N 2019 l 2020
DISTRIBUTED POWER GENERATION – NEW SUPPLY SYSTEM STRUCTURES
D istributed generation is an essential part of the energy transition and
will increase significantly in the coming years. However, the complex
system of distributed energy supply, consisting of generation – transmission
Growth of distributed power production in different regions
120,000
– distribution – consumption, must be considered in its entirety. North America Western Europe Eastern Europe
Combined heat and power plants are mainly based on the classic reciprocat- 100,000
ing engine process. In addition, fuel cells can open up new fields of applica-
tion for combined heat and power (CHP). They represent important tech-
Capacity in MW
nical innovations, as they enable the use of CHP technology even in the 80,000
very small power range. This applies in particular to applications in the local
heating sector, but also in the commercial and industrial sectors. 60,000
In connection with the increase in distributed energy generation, these sys-
tems will increasingly have to offer the necessary network services in the
future, including the provision of control power. 40,000
To support the necessary measures, smart metering will now also be intro-
duced in Germany since 2017 onwards, depending on consumption 20,000
(>10,000 kWh/a in 2017; >6,000 kWh/a in 2020 for private households).
It has to be considered that a high standard of IT security must be main-
tained for the measurement and control systems. 0
2014 2015 2016 2017 2018 2019 2020 2021 2022 2023
Year
Source: Navigant ResearchSTORAGE TECHNOLOGIES – AN IMPORTANT COMPONENT OF SYSTEM STABILITY
I n parallel with the increase in decentralized energy supply and the steady
increase in electricity generation from fluctuating renewable energy
sources, there is an urgent need to expand storage capacity in the future.
Specification High capacity High amount of energy
Storage time Seconds Minutes Hours (days)
The systems can be divided into central storage power plants, distributed
small storage facilities, and short or long-term storage facilities. It is also Application
(examples)
Voltage stabilisation ˝Black start“ Stand-alone networks,
electricity trading
Frequency stabilisation Uninterruptible
possible to store electrical or thermal energy. A decisive criterion for the power supply Peak-load smoothing
Flicker compensation Load balacing
selection of the appropriate storage technology is the time range which is to Soft-hybrides
Batterie-power vehicles
be covered. Choosing the right location also plays an important role. Classification Thermal Local Decentral Central storage
Short-time storage
Market-driven conditions are required for the use of the various storage technologies storage small storage large batteries power plants
technologies. The current possible alternatives include, for example, the Storage
concepts Sensitive storages Double-layer Lead-acid Lead-acid Pumped-storage
expansion of the electricity grid, making the existing power plant portfolio Latent storages capacitors batteries (Pb) batteries (Pb) power plants
Lithium-Ion Lithium-Ion Compressed-air
more flexible, and also the use of demand side management. Chemical
storages
Superconducting
magnetic batteries (LIB) batteries (LIB) power plants
At present, only the use of hydroelectric power in the form of pumped stor- energy storage Nickel-cadmium Natrium-
batteries (NiCd) sulphur
Hydrogen-storage
age power plants is available as a fully developed technology. Large-scale Fly-wheel Nickel-metal- batteries (NaS) power plants
hydrid batteries
battery systems have already proven their technical suitability for use in the (NiMH)
Redox-flow-
batteries (RFB)
Type of storage
control power market and can also be used commercially in niche applica-
Virtual storage
tions. Electrical (electromagnetic or -static field)
Electro-chemical (chemical energy)
Mechanical (kinetic or potential energy)
Source: Fraunhofer ISI (2012)
PAG E 8 – 9FAC TS A N D FI G U R ES EL E C T R I C I T Y G EN ER AT I O N 2019 l 2020
FLEXIBLE CONVENTIONAL POWER PLANTS – GUARANTEEING SECURITY OF SUPPLY
T he CO2 emissions of coal-fired power plants have been gradually re-
duced as a result of technological development. In consequence, the
average global efficiency has risen from roughly 30 % to about 33 %, and
The new power plants currently under construction have therefore been
designed for particularly flexible operation, especially in Germany.
Essential technical criteria for flexibility are stable minimum load, start-up
the consistent application of state-of-the-art technology with an efficiency and shutdown times as well as minimum operation and downtimes, load
level of 44 % to 47 %, the CO2 volume could continue to be significantly gradients and the control ranges in different load scenarios. Another com-
reduced worldwide. In countries with a growing share of fluctuating renew- pletely different aspect is flexibility with regard to quality fluctuations in the
able energy sources in electricity generation, the primacy of efficiency is main fuel and the use of substitute, refuse derived, fuels.
increasingly being replaced by the need for flexibility.
New and appropriately upgraded thermal power plants can contribute to
Generation of conventional plants must adapt quickly and flexibly to the the integration of renewable energies into a modern power supply system
residual load at all times, i.e. be available to compensate for the difference through their flexible operation. The focus of technical developments is on
between consumption and fluctuating feed-in from photovoltaic and wind the exploitation of the existing potential for flexible plant operation.
energy plants. Short-term feed-in fluctuations are triggered by the rapidly Against the backdrop of the expansion targets for renewable energy
increasing output of photovoltaic systems. The resulting effects become the throughout Europe, a broad and flexible thermal power plant portfolio will
decisive driver for the day to day feed-in fluctuation with the increasing continue to be indispensable in the future in order to ensure economic ef-
intensity of solar radiation from spring onwards. In the medium to long ficiency and security of supply at all times.
term, the average cycle lies between strong and weak wind phases; in north-
western Europe, it corresponds to about three to five days. Due to limited
interconnection capacities, the necessary flexibility for permanent load bal-
ancing has to be met to a large extent by the power plants in Germany.Flexibility parameters of thermal power plants:
High load gradients, low minimum load,
Flexibility of thermal power plants – State-of-the-art short ramp-up times
1,300 Plant type Hard coal Lignite CCGT Gas turbine
Lignite (e.g. BoA) Nuclear
1,200 Load gradient
2/4/8 2 /Max
4 /capacity
6 4~1,300
/ 8 / 12 8 / 12 / 15
Capacity in MW
Max
in %capacity
per minute~1,000 MW MW
Nuclear power plants Min capacity ~420 MW Min capacity ~520 MW
1,000 ... ramp rate
Max +/-30 MW/min Max ramp rate +/-63 MW/min
in the load range 40 ... 90 50 ... 90 40* ... 90 40* ... 90
of %
Combined Cycle Power Plant (CCGT) Hard coal
800 Minimum load
Max capacity ~2 x 440 MW Max capacity ~800 MW
in % of 40 / 25 / 15 60 / 40 / 20 50 / 40 / 30 * 50 / 40 / 20*
Lignite fired power plants Min capacity ~520*/260** MW Min capacity ~210 MW
nominal capacity
Max ramp rate +/-36 MW/min Max ramp rate +/-20 MW/min
600
Combined Cycle Ramp-up time
Power Plants (CCGT) *in two
hours (h),operation
boiler 3/2/1 6/4/2 1,5 / 1 / 0,5FAC TS A N D FI G U R ES EL E C T R I C I T Y G EN ER AT I O N 2019 l 2020
NEW FRAMEWORK FOR THE OPERATION OF CONVENTIONAL POWER PLANTS
A t the end of the last century, the development of the electricity sector was
strongly influenced by the liberalisation of the energy market in Europe.
This led to a rethinking of the information policy of the operational data of
The trends shown in the diagram underline a steady increase of unplanned,
unavailable UA for coal-fired power plants from 1998 (approx. 3 %) to 2018
(approx. 9 %), while the planned share has been declining since 2010. The
power plants. For example, in 1998 about 270 fossil-fired plants from Europe unplanned share of gas turbines has remained constant at an average of ap-
participated in the data collection of VGB´s KISSY-system (Power Plant In- prox. 3 % in the period from 2007 to 2016. Since then it has increased up to
formation System). By 2007 this number had risen to over 350 plants − with approx. 5 %. The planned share in the period from 2007 to 2018 is 8 % on
the result that the average values of the early 1990s reflected a significantly average.
different plant park than today. The legal requirements, such as the introduc- When interpreting trends, the change in the KISSY database must be taken
tion of the European ETS (Emissions Trading System) in 2005 or the pre- into account. The number of plants is constantly changing due to the decom-
ferred feed-in of renewables, led to more flexibility and partial load as well as missioning of old plants and the commissioning of new plants. However,
lower utilisation for fossil-fired plants. Other examples are the decommission- KISSY‘s database has increased significantly over the last 15 years and has be-
ing of nuclear power plants in Germany (decided and started in 2011, which come much more international.
will be completed in 2022) or the transition of a significant number of fossil-
fired power plants from the electricity market to the grid reserve. Due to these
Sources
framework conditions, the number of plants was then reduced to around 230 Technical and Commercial Key Indicators for Power Plants,
in 2018. With these changes of the market and political requirement, a more VGB-S-002-03-2016-08-EN, VGB PowerTech, ISBN 978-3-86875-934-1 (eBook, free of charge)
flexible start-up behaviour of the power plants is demanded or forced, which Availability of Power Plants 2009 – 2018, VGB-TW 103Ve,
Issue 2019, VGB PowerTech, ISBN: 978-3-96284-156-0
is reflected in the availability and in particular in the unavailability (UA) of
Analysis of Unavailability of Thermal Power Plants 2009 – 2018, VGB-TW 103Ae,
the plants. Issue 2019, VGB PowerTech, ISBN: 978-3-96284-158-4Energy availabilty of European power plants Unavailability (UA) of European power plants
Energy availabilty, coal Energy availabilty, gas UA planned, coal UA disposable, coal UA not disposable, coal
Energy utilisation, coal Energy utilisation, gas UA planned, nat. gas UA disposable, nat. gas UA not disposable, nat. gas.
100 12
10
80
Energy availabiltyin %
Unavailability in %
8
60
6
40
4
20
2
0 0
1998 2000 2002 2004 2006 2008 2010 2012 2014 2016 2018 1998 2000 2002 2004 2006 2008 2010 2012 2014 2016 2018
Year Year
Source: VGB data base KISSY (Power plant information system, data: 2018)
PAG E 12 – 13FAC TS A N D FI G U R ES EL E C T R I C I T Y G EN ER AT I O N 2019 l 2020
NUCLEAR POWER – CONTINUED EXPANSION WORLDWIDE
I n 2018, electricity generation from nuclear power was around 2,519 bil-
lion kWh worldwide and slightly above the 2017 figure of about 2,490 bil-
lion kWh. The further restart of nuclear power plants in Japan following the
Electricity generation from nuclear power worldwide
100 3,000
Electricity generation from nuclear power plants in billion (109) kWh
events in Fukushima in March 2011 ‒ 9 out of 37 plants are back on line ‒ as
Availability in %
well as the excellent operating results of the plants worldwide had a signifi- 2,500
cant impact. The share of nuclear power in worldwide electricity generation
has been roughly at some 11 %. The EU is the leading economic area world-
Others 2,000
wide in nuclear energy production with 14 countries operating nuclear
power plants and a production of about 787 billion kWh. Japan
50 1,500
Since the first commercial nuclear power plant was commissioned in Calder
Hall in the United Kingdom in 1956, around 81,300 billion kWh of elec- USA
tricity have been produced on a cumulated basis. This corresponds to about 1,000
three times the current annual global electricity demand.
The growth of nuclear electricity generation in the 1980s is remarkable. 500
EU
During that time, large power plant projects with unit outputs in excess of
1,000 MW, which had been launched in the 1970s. In 2018, Taishan 1, 0 0
China, currently the world’s most powerful nuclear power plant unit with 1956 1960 1970 1980 1990 2000 2010 2018
Year
a gross capacity of 1,750 MW, was commissioned.
Today, the operation of nuclear power plants is characterised by high avail-
Source: atw – Int. Journal for Nuclear Power 5/2019
ability with a worldwide average of nearly 80 %.NUCLEAR POWER: PLANTS, PLANNED SHUTDOWNS, NEW PLANTS AND PROJECTS
USA
France 58 - 2 + 1
99 + 2 4 +1 +1
4+2
Finland
Hungary
C urrently 451 nuclear power plants with a
total capacity of 424,937 MW are being op-
erated worldwide in 31 countries: another 53
Japan 39 + 2 46 + 11 + 32 China plants are under construction, while roughly 200
United Kingdom 15 + 10 3 +1 Argentina
plants are being planned or pre-planned to be
Russia 36 + 6 + 16 2 +1 + 4 Brazil
commissioned by 2030 (state December 2018).
Canada 19 + 7 2+2 Mexico
Germany 7 -7 5 +2+2
The trend towards new projects in Asian coun-
Pakistan
South Korea 24 + 5 + 11 2 South Africa
tries and in “newcomer” countries, including Af-
India 22 + 7 + 7 Nuclear power plants worldwide 1-1+1 Armenia
rica, is intensifying, the Middle East and South
Ukraine 15 + 2 in operation 2018: 449 1 The Netherlands America ‒ essential with the participation of sup-
Sweden 8 2+2 Romania plier countries.
Spain 7 1+1 Slovenia Following the Japanese events of March 11,
Belgium 7 1+1 Iran 2011, new built plans were abandoned in Italy
Taiwan, China 4 +2 +4 + 2 UAE
and Switzerland only.
Bulgaria 2 +2 +4 Poland
Slovakia 4 +2+2
+1 Lithuania Long-term planable perspectives in terms of elec-
Switzerland 5-1
+4 Vietnam tricity generation costs and nuclear fuel supply
+1+3 Turkey
Czech Republic 6+4 Belarus
motivate investors to launch new build pro-
+2
+2 Bangladesh grammes with further capacities.
New build: 53 Planned shut-downs: 11 Projects: 200 (including projects in further 14 countries)
Sources: IAEA, atw – Int. Journal for Nuclear Power, status: 12/2018
PAG E 14 – 15FAC TS A N D FI G U R ES EL E C T R I C I T Y G EN ER AT I O N 2019 l 2020
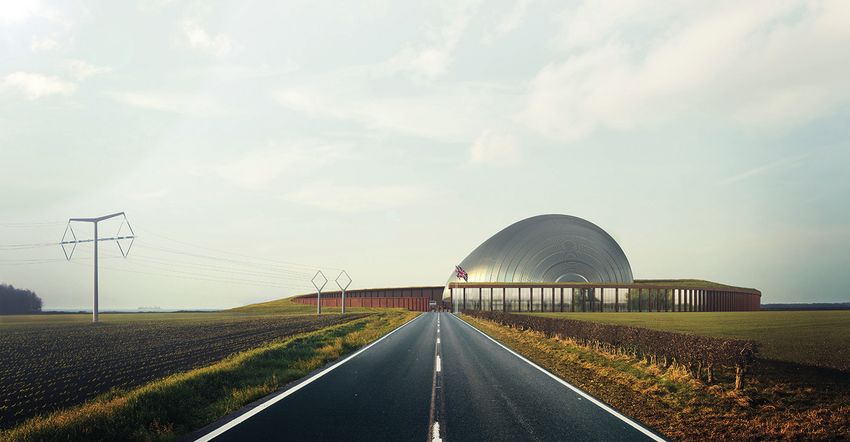
SMALL MODULAR REACTORS (SMR)
T he development of advanced reactor types − mainly based on the relia-
ble light water reactor technology − has been pushed worldwide over
the past decades. Today, nuclear power plants can be built and operated in a
These concepts are characterised above by the following properties:
ll Highest safety standards through passive systems or physically inherent
safety features.
reliable regulatory environment at competitive prices and with the highest
ll Modular design. Depending on requirements, single modules can be
safety standards. These Generation III+ reactors now are the basis for new
construction programmes and will continue to do so in the coming decades. built at a site step by step and optimised to individual local require-
But the geographical focus of nuclear new build is shifting. The future new ments and investment. The modular design also enables modular
construction programmes will focus on the Asian countries that already use construction with all the advantages of series production.
nuclear energy today and on “newcomer” countries in Africa and Asia. ll Long maintenance intervals and operating times for nuclear fuel loading
However, nuclear technology also offers many opportunities for further for several years. This results in low operating costs.
development and innovation beyond the reliable nuclear power plant types ll Installation of the modules in underground caverns and thus also close
with outputs of up to 1,600 MW that have been commercially introduced to the demand sites. In addition to power generation, this also makes it
into the markets. A particular interest of concepts and projects lies in small possible to supply district or process heat.
and medium capacity reactors up to approx. 600 MW, the so-called “Small
ll Island operation. Remote regions can be self-sufficiently supplied with
Modular Reactors” (SMR).
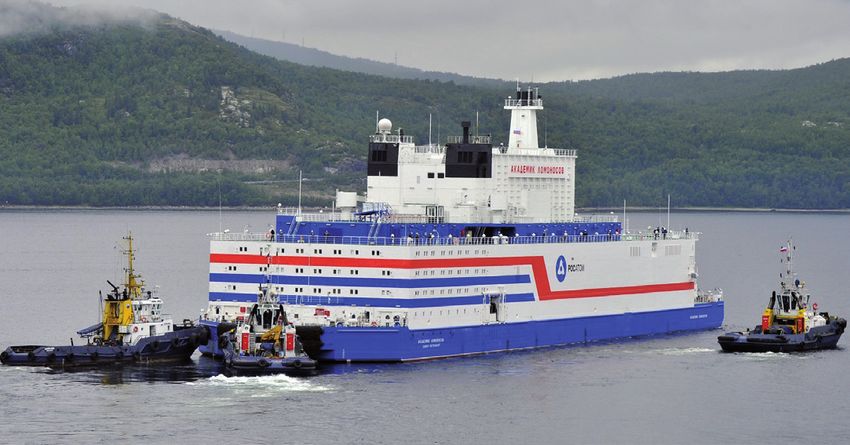
energy − electricity and heat − from SMR, also on swimming platforms.(1) (3)
Some examples for “Small Modular Reactors”:
(SMR, capacity < 600 MW)
ll 400 to 450 MW UK SMR project lead by Rolls-Royce Power Systems;
commercial pilot plant to be commissioned by the end of the 2020s (1)
ll TerraPower: Traveling Wave Reactor. Stages of the project. (2)
ll Akademik Lomonosov, Russia, transfer to the final plant site in
mid-2019. Floating barge with two 40 MW nuclear reactors for
the electricity and heat supply of remote areas (3)
(2)
PAG E 16 – 17FAC TS A N D FI G U R ES EL E C T R I C I T Y G EN ER AT I O N 2019 l 2020
NEW POWER GENERATION CAPACITIES REQUIRED
F or more than two decades, European electricity generation has been in-
vesting predominantly in renewable energy sources and gas-fired power
plants, whereas in the 1970s and 1980s, investments focused on conven-
The future of today´s electricity generating capacities in operation
1,000
tional coal-fired and nuclear power plants. This structural change is above all Other
the result of various financial support systems for renewables in the indi- Geothermal
Capacity in operation in GW*
vidual European countries. 800
Hydro
Conventional power plants in Europe, mainly coal-fired and nuclear power Photovoltaic
plants, have therefore now reached a technical age at which future decom- Waste
600
missioning is foreseeable. The typical technical lifetimes of coal-fired power Peat
plants are about 40 years, those of nuclear power plants about 60 to 80 Biomass
years, and those of hydroelectric power plants about 100 years. In addition, 400 Wind, offshore
it is also foreseeable that in the coming years, renewables capacities will
Wind, onshore
increasingly reach the end of their technical operating life; the service life of
Nuclear
wind power and photovoltaic systems is considered to be 20 to 30 years. 200
Based on typical service life data and individual political decisions (e.g. Oil
phasing out nuclear power in Germany by 2022), it can be estimated that Lignite
by the year 2030 around 30 % of the electricity generation capacities cur- 0 Hard coal
rently in operation in Europe will be decommissioned. By 2050, this figure 2015 2025 2035 2045 2050
Year
will be around 80 %. * ˝Mortality“, Base: Capacities in operation end of 2014
This estimate makes it clear that with today‘s time horizons for planning,
construction and commissioning of power generation plants of 10 years and
more, suitable replacement capacities for a secure electricity supply will
have to be prepared in good time – now. Source: Investment Requirements in the EU electricity sector up to 2050
Chalmers University of Technology, Department of Energy and Environment, Energy TechnologyPLANNED AND ANNOUNCED NEW CONSTRUCTION PROJECTS IN EUROPE
T he need to replace existing power generation capacities in Europe has
led many companies to plan new construction projects. Despite the
massive expansion of energy from renewables, coal, natural gas and nuclear
Projected and announced power plant capacities in Europe
energy continue to be the most important primary energy sources for reliable Share of energy source 2019 Gas (32,888 MW, 33.0 %)
available power generation. Highly efficient new plants are replacing less Oil (0 MW, 0 %)
efficient power plants. In addition to a significant reduction in CO2 emis-
sions, new power plants will also reduce further emissions and their increased Hard coal (13,915 MW, 14.0 %)
flexibility will contribute to a secure electricity supply and the integration of Lignite and peat (1,160 MW, 1.2 %)
renewable energy into the supply system. However, due to a lack of long-
Nuclear (7,000 MW, 7.0 %)
term political framework conditions across Europe, investment in new ca-
pacities is stalled. Hydro (10,595 MW, 10.7 %)
According to the updated VGB PowerTech new construction statistics, the
Wind (33,470 MW, 33.6 %)
{
technology of gas-fired power plants accounts for the largest share of the
available capacity of disposable conventional plants at around 33 % . With Biomass
(291 MW, 0.3 %)
a share of approx. 15 % these are followed by hard coal and lignite power
Residues and waste
plant projects, particularly in Eastern European countries. The low-emis- (120 MW, 0.1 %)
sion sources hydropower and nuclear account for 10.6 % and 7.0 %. Pro- Other renewables
jects based on non-schedulable generation technologies continue to focus Total*: 99,559 MW (120 MW, 0.1 %)
on wind power plants with a capacity share of approx. 33 %.
Within a decade, the projected and announced new build capacities gath-
ered have declined considerably, from 277,884 MW in 2010 to 99,559 MW * without photovoltaic, oil: no projects.
in 2019. Source: Data base VGB, state: 8/2019
SEI T E 18 – 19FAC TS A N D FI G U R ES EL E C T R I C I T Y G EN ER AT I O N 2019 l 2020
CLIMATE POLICY: GLOBAL APPROACH NEEDED
Between 1990 and 2016, the total greenhouse gas emissions (GHGE) in the Current Policies New Policies Sustainable Dev.
European Union (EU-28) decreased by 22 % (World Bank, state: 2018). in billion tce
Targets for climate and energy policy were revised by the EU Commission in
2015
2025
2040
2025
2040
2025
2040
November 2018. Vision is a prosperous, modern, competitive and climate-
neutral economy for the period up to 2050.
For the stabilisation and actual reduction of GHGE emissions, action, based Coal 5,357 5,711 6,813 5,383 5,441 4,350 2,281
on the principle of effectiveness and cost efficiency, has to be taken world- Oil 6,336 7,003 7,957 6,791 6,991 6,191 4,509
wide. Cost-efficient measures such as insulation of buildings, fossil-fired Natural gas 4,439 5,166 6,863 5,056 6,337 4,934 4,889
power plants with higher efficiencies, the application of CCU (Carbon Cap-
Nuclear 983 1,147 1,359 1,150 1,387 1,230 4,904
ture and Utilisation), expanded use of renewables or further use of technolo-
gies with low GHGE like nuclear energy must be applied with priority and Hydro 504 590 734 593 734 616 859
without prejudice in order to mitigate the globally increasing amount of Biomass 1,979 2,246 2,531 2,271 2,644 1,960 2,149
GHGE. Other 363 684 1,354 737 1,747 926 3,046
The International Energy Agency (IEA) developed a stabilisation concept renewables
which is to stabilise GHGE at a value of 450 ppm CO2 in the atmosphere Total* 19,960 22,546 27,611 21,983 28,051 20,209 19,593
(“Sustainable Development Scenario”) through a bundle of measures in com- Share of 60 % 63 % 70 % 63 % 70 % 63 % 68 %
parison to the reference scenario (“Current Policies”). non-OECD
countries
IEA stabilisation concept. Share of the energy sources.
* incl. roundings
Source: IEA, World Energy Outlook 2017/2018CO2 emissions total and per capita from fossil fuel combustion CO2 emissions from different power plants
for selected regions for 2016 and changes from 1990 to 2016 in g CO2 equivalent per kWh,
calculated for the life cycle of the power plant
t CO2 per capita billion (109) t CO2 per year
BoA technology
0 1 2 3 4 5 6 20
Lignite 950 to 1,230
EU-28 6.2
Region | Change 1990 to 2016
- 22 % 3,192
Hard coal 790 to 1,080
India 1.6
+ 293 % 2,036 Oil 890
USA 14.9
+1 % 4,833 Natural gas 640
143 Gas
China 7.5 combined 410 to 430 Electricity generation with CCU
+ 321 % 9,102 cycle
127
Photovoltaik 35 to 160
World 4.35
+ 57 % 32,314
Nuclear 16 to 23
0 1 2 3 4 5 6 30
Wind 8 to 16 Result range due to different
methods of calculation
Hydro power 4 to 13 and different site implications.
Sources: U.S. Department of Energy’s (DOE) Environmental System Science Data Infrastructure for a Sources: PSI Paul Scherrer Institut/Switzerland, ESU-services, VGB (own calculations)
Virtual Ecosystem (ESS-DIVE) 2018, and IEA: CO2 emissions from fuel combustion
PAG E 20 – 21FAC TS A N D FI G U R ES EL E C T R I C I T Y G EN ER AT I O N 2019 l 2020
VGB POWERTECH E.V.
VGB PowerTech e.V. is the international technical association for generation Structure of the VGB membership:
and storage of power and heat with head office located in Essen (Germany).
Currently VGB has 437 members, comprising operators, manufacturers, and Fossil-fired power plants 227,500 MW
institutions connected with energy engineering. Nuclear power plants 33,500 MW
Our members come from 34 countries and represent an installed power plant Hydro power plants and other renewables 40,000 MW
capacity of 301,000 MW located in Europe. Total 301,000 MW
The activities of VGB PowerTech comprise: EU: 414 members in 21 countries
ll Provision of an international platform for the accumulation, exchange, Austria, Belgium, Croatia, Czech Republic, Denmark, Finland,
and transfer of technical know-how. France, Germany, Greece, Ireland, Italy, Latvia, Luxembourg,
ll Acting as “gate-keeper” and provider of technical know-how for the The Netherlands, Poland, Portugal, Romania, Slovenia, Spain, Sweden
member companies and other associations of our industry. United Kingdom
ll Harmonisation of technical and operational standards.
ll Identification and organisation of joint R&D activities. Other Europe: 11 members in 3 countries
ll Exclusive member access to qualified expert knowledge. Russia, Switzerland, Turkey
ll Representation of members´ interests.
Outside Europe: 12 members in 10 countries
VGB is performing these tasks in close cooperation with Eurelectric on
Argentina, Canada, China, Israel, Japan, Malaysia,
European-level and further national and international associations.
Mongolia, Morocco, Saudi Arabia, South Africa
Total: 437 members in 34 countriesTASKS OF THE INTERNATIONAL
TECHNICAL ASSOCIATION VGB POWERTECH
General Assembly
VGB PowerTech e. V. supports its members with all technical
issues of generation and storage of electricity and heat in Board Technical Advisory
order to further optimise Scientific Advisory Board Board
of Directors
ll Safety
ll Efficiency Management
ll Environmental friendliness
ll Economic efficiency and Competence Areas for the Generation and Storage of Power and Heat
ll Occupational safety and health protection
The competence areas “Nuclear Power Plants”, “Power Plant Nuclear Renewables Environmental
Power Plant Technology, Technical
Technologies”, “Renewables and Distributed Generation”, Power and Distributed Chemistry, Safe-
Technologies Generation Services
Plants ty and Health
and “Environmental Technology, Chemistry, Safety and
Health” are dealing with all aspects of nuclear, conventional
and renewable generation. They are cooperating closely to
fully exploit the synergies.
The engineering services of the “Technical Services” with engi-
neering consulting, materials and oil laboratory and water
chemistry, the VGB Research Foundation, data bases, and pub-
lications. e.g. the technical journal VGB POWERTECH per-
fectly round off the portfolio of expertise of VGB PowerTech. VGB Committees
PAG E 22 – 23VGB PowerTech e.V. Editorial: Oliver Then (responsible),
Deilbachtal 173 Mario Bachhiesl, Ludger Mohrbach, Stefan Prost
45257 Essen | Germany and Christopher Weßelmann
August 2019
Phone: +49 201 8128 – 0 www.vgb.org | info@vgb.org
Fax: +49 201 8128 – 302 Photo credits: Offshore Windpark, EnBW
50-MW-Stromspeicher BigBattery Lausitz, LEAGYou can also read