Siemens Energy Spin-off: Meet the Management - 23 June 2020 - Digital ...
←
→
Page content transcription
If your browser does not render page correctly, please read the page content below

Siemens Energy Spin-off:
Meet the Management
23 June 2020
Disclaimer

This presentation and the information contained herein are for information purposes only and do not constitute a prospectus or an offer to sell or a solicitation of an offer to buy or
subscribe for any securities of Siemens AG or Siemens Energy AG. This presentation is not directed to, or intended for distribution to or use by, any person or entity that is a citizen
or resident or located in any locality, state, country or other jurisdiction where such distribution, publication, availability or use would be contrary to law or regulation of such
jurisdiction or which would require any registration or licensing within such jurisdiction. Any failure to comply with these restrictions may constitute a violation of the laws of other
jurisdictions. Any securities to be distributed in connection with this transaction have not been and will not be registered under the U.S. Securities Act of 1933 (as amended) or the
laws of any state of the U.S. Neither Siemens AG nor Siemens Energy AG intends to register any securities referred to herein in the U.S.

This presentation is being distributed to, and is directed only at, persons in the United Kingdom ("U.K.") in circumstances where section 21(1) of the Financial Services and Markets
Act 2000 does not apply. This document does not constitute an offer document or an offer of securities to the public in the U.K. to which section 85 of the Financial Services and
Markets Act 2000 of the U.K. applies and is not, and should not be considered as, a recommendation that any person should subscribe for or purchase any securities. This
document is being communicated only to (i) persons who are outside the U.K.; (ii) persons who have professional experience in matters relating to investments falling within
article 19(5) of the Financial Services and Markets Act 2000 (Financial Promotion) Order 2005 (as amended) (the "Order") or (iii) persons within the scope of article 43 of the Order
or (iv) high net worth companies, unincorporated associations and other bodies who fall within article 49(2)(a) to (d) of the Order (all such persons together being referred to as
"Relevant Persons"). Any investment or investment activity to which this document relates is available only to and will be engaged in only with Relevant Persons, and any person
who is not a Relevant Person must not act or rely on this communication or any of its contents. This document should not be published, reproduced, distributed or otherwise made
available, in whole or in part, to any other person without the prior consent of Siemens AG or Siemens Energy AG.

No representation or warranty, express or implied, is made as to the fairness, accuracy, completeness or correctness of the information contained herein, and no reliance should be
placed on it. Neither Siemens AG nor Siemens Energy AG nor any of their affiliates, advisers, connected persons or any other person accepts any liability for any loss howsoever
arising (in negligence or otherwise), directly or indirectly, from this presentation or its contents or otherwise arising in connection with this presentation.

Certain numerical data, financial information and market data in this presentation have been rounded in accordance with commercial rounding. Unless otherwise indicated, all
financial data presented in the text and tables in this presentation is shown in millions of euros (€ million), commercially rounded to the nearest million. Percentage changes and
ratios in the text and tables of this presentation are calculated based on the rounded numbers shown in this presentation, and then commercially rounded to a whole percentage or
to one digit after the decimal point. Such rounded figures and percentages may not add up to 100% or to the totals or subtotals contained in this presentation.

Page 2                                                                                                                                            Unrestricted © Siemens 2020
Disclaimer (cont’d)

Certain financial data included in this presentation consists of non-IFRS financial measures. These non-IFRS financial measures may not be comparable to similarly titled
measures presented by other companies, nor should they be construed as an alternative to other financial measures determined in accordance with IFRS. You are cautioned not to
place undue reliance on any non-IFRS financial measures included herein.

This presentation contains forward-looking statements. These statements are based on the current views, expectations, assumptions and information of the management of
Siemens AG and Siemens Energy AG. Forward-looking statements involve known and unknown risks and uncertainties and, therefore, should not be construed as guarantees of
future results, performance and events. Actual results, performance or events may differ materially from those described in such statements due to, among other things, changes in
the general economic and competitive environment, risks associated with capital markets, currency exchange rate fluctuations, changes in international and national laws and
regulations, in particular with respect to tax laws and regulations, affecting Siemens Energy AG, and other factors. Siemens AG or Siemens Energy AG do not undertake any
obligation to update any forward-looking statements.

Any assumptions, views or opinions contained in this presentation represent the assumptions, views or opinions of Siemens AG or Siemens Energy AG as of the date of this
presentation and are subject to change without notice. All information not separately sourced is from Siemens AG or Siemens Energy AG data and estimates. Market and market
share data is based on company internal estimates derived from continuous analysis and aggregation of internal and external market data, including data from third-party sources.
Third party industry publications, studies and surveys generally state that the data contained therein have been obtained from sources believed to be reliable, but that there is no
guarantee of the accuracy or completeness of such data. While Siemens Energy AG believes that each of these publications, studies and surveys has been prepared by a
reputable source, neither Siemens AG nor Siemens Energy AG or any other party has independently verified the data contained therein. Accordingly, undue reliance should not be
placed on any of the industry or market data contained in this presentation. Information contained in this presentation related to past performance is not an indication of future
performance. The information in this presentation is not intended to predict actual results, and no assurances are given with respect thereto.

Advertisement
This communication is an advertisement for the purposes of the Prospectus Regulation EU 2017/1129 and underlying legislation. It is not a prospectus. The listing of the shares of
Siemens Energy AG on the regulated market of the Frankfurt Stock Exchange (Frankfurter Wertpapierbörse) is subject to the publication of a prospectus. The prospectus is
expected to be approved by the German Federal Financial Supervisory Authority (Bundesanstalt für Finanzdienstleistungsaufsicht – "BaFin") in accordance with the Prospectus
Regulation regime. However, the approval of the prospectus by BaFin should not be understood as an endorsement of the shares of Siemens Energy AG. Investors should
purchase shares solely on the basis of the prospectus relating to the shares and should read the prospectus before making an investment decision in order to fully understand the
potential risks and rewards associated with the decision to invest in the shares. Copies of the prospectus will, following approval of BaFin, be available free of charge from Siemens
Energy AG, Werner-von-Siemens-Straße 1, 80333 Munich, Germany, or on Siemens Energy AG’s website (www.siemens-energy.com).
Page 3                                                                                                                                         Unrestricted © Siemens 2020
Agenda

 1   Update on spin-off process

 2   Introduction of Siemens Energy

 3   Financials

Update on spin-off process
Siemens Energy spin-off: A mutually beneficial transaction
Focused resource allocation offers attractive opportunities
         Siemens                                                                      Siemens Energy
1. Focus
                                                €80.5bn         €28.8bn            91k                 1. Focus:
                                               Order backlog     Revenue         Employees   % Total
                                                                                                          Optimize resource allocation
2. Simplification                                 Mar-20         FY2019           Mar-20     Revenue
                                                                                                       2. Accountability:
3. Resource allocation                                                                                    Deliver on goals set to capital market
                                                                Generation
                                                                                              GP1)     3. Adaptability:
                                                                                                          Unique offering in both conventional
                                                                                              65%         and renewable energy
                                                                 Oil & Gas
                      Transfer of
                     SGRE shares                                                                       4. Transformation:
                                                               Transmission                               Entrepreneurial independence
                     Spin-off until                                                                       with SGRE as integral part of the group
                      Sep 2020
                       planned                                                                         5. Value creation
                                                           SGRE (share of 67%)                35%1)

         Spin-off creates independent and agile energy champion with strong Siemens engineering DNA and brand
Page 6   1) FY2019 pre consolidation effects                                                                       Unrestricted © Siemens 2020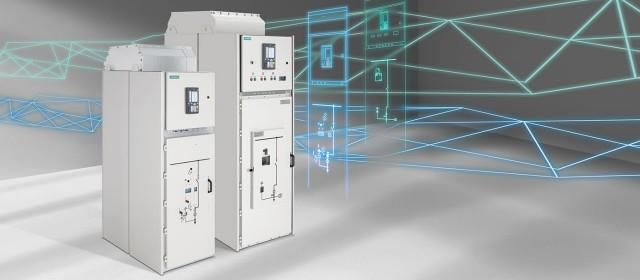
Siemens Energy on track for listing end of September

    March               April       May                June          July       August         September
    2020                2020        2020               2020          2020        2020            2020

               Carve-out                                                                            Road-
               finalized                                                                            show
                                                          Today:
                                                         Meet the
         Portfolio set-up defined
                                           Spin-off-    Management                  Capital
         Brand name announced               Report                                 Market Day
                                                                                    (Sep 1)
  Acquisition 8.1% SGRE stake                                                        Prospectus
                                                               Extraordinary                        Planned first
     Leadership team in place                                 General Meeting                       day of trading
                                                                   (Jul 9)                            (Sep 28)
  Carve-out effective March 31

         Siemens Energy in D/O

     Spin-off report published

Page 7                                                                                   Unrestricted © Siemens 2020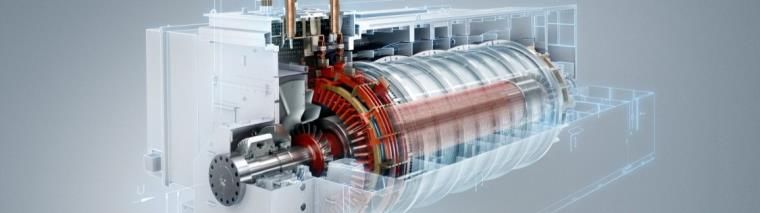
Key spin-off parameters

                   •   Approval by Siemens AG EGM expected on 9 July 2020
 Key milestones
                   •   First day of trading envisaged for 28 September 2020

     Siemens       •   Siemens: 35.1% / Siemens Pension-Trust e.V.: 9.9% prior to first day of trading
   shareholding    •   Within 12-18 months post spin-off, Siemens intends to further significantly reduce its stake in Siemens Energy

     Allotment     •   Siemens AG shareholders receive 1 Siemens Energy AG share for 2 Siemens AG shares (allotment ratio: 2:1)
        ratio      •   55% of Siemens Energy AG shares will be transferred to Siemens AG shareholders prior to first day of trading

         Listing   •   Listing on the Regulated Market and in the Prime Standard segment of the Frankfurt stock exchange

                   •   Siemens Energy and Siemens concluded a deconsolidation agreement to safeguard that Siemens Energy is an
                       independent company immediately post spin-off

 Deconsolidation •     Siemens waives controlling influence on Siemens Energy, e.g.:
   Agreement             –   Voting rights at AGM limited with respect to election of supervisory board shareholder representatives
                         –   Max. 3 out of the 10 shareholder representatives in Siemens Energy supervisory board dependent on
                             Siemens

Page 8                                                                                                     Unrestricted © Siemens 2020
Siemens Energy has a strong management team with clear
      responsibilities aligned to one common goal
        EXECUTIVE BOARD

                                        Christian                                    Maria                                 Tim                               Jochen
                                        Bruch                                        Ferraro                               Holt                              Eickholt
                                        CHIEF                                        CHIEF                                 SEGMENT                           SEGMENT
                                        EXECUTIVE                                    FINANCIAL                             MANAGER                           MANAGER
                                        OFFICER                                      OFFICER                               GAS AND                           GAS AND
                                                                                                                           POWER,                            POWER
                                                                                                                           SGRE

               •   Executive Vice President            •   CFO Siemens Operating                 •   CEO Siemens Power               •   Chairman and Managing Partner
                   Linde plc and CEO of                    Company Digital Industries                Generation Services                 of Siemens Portfolio Companies
                   Linde Engineering
                                                       •   Chief Diversity Officer               •   CEO Siemens Power & Gas         •   Siemens Head of Integration
               •   Speaker of the Executive Board          Siemens AG                                Service Business Unit               Management Siemens Alstom
                   of Linde AG
                                                       •   CFO Digital Factory Division          •   CEO Siemens Renewables          •   CEO Siemens Mobility Division
Experience
               •   Executive Board Member                                                            Service Business Unit
                   responsible for the Engineering     •   CFO Siemens UK                                                            •   CEO Siemens
                   Division and the Corporate                                                    •   Vice President Strategy             Rail Systems Division
                   Function Technology &               •   CFO Siemens Canada                        Siemens Power Generation
                   Innovation, and thus for                                                          Services Division               •   CEO Siemens Rail Automation
                   Digitalization of Linde AG          •   Additional experience:                                                        Business Unit
                                                           PricewaterhouseCoopers &
                                                           Nortel Networks

                                         Today’s presenters
      Page 9                                                                                                                         Unrestricted © Siemens 2020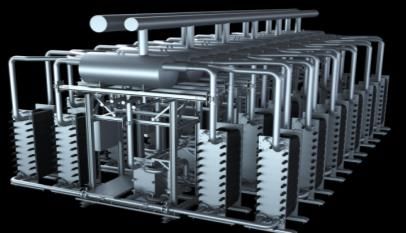
Incentivization geared towards performance and ownership culture

              Recurring Executive Board compensation                                             Spin-off employee incentive programs

           Long-term variable                                                   Participants     • Selected employees            • Broader employee base
                                               Base
          (Stock awards,
          4 year vesting)                   30% (cash)
                            40%
          – 40% Total
             shareholder                                                        Form             • Stock Awards: 75%             • Stock Awards: 100%
                                                                                (% of target
             return                                                             amount)          • Cash: 25%
                                                   Short-term variable
          – 40% EPS                                (cash)
          – 20% ESG criteria
                                        30%
                                                   – 1/3 Adj. EBITA margin
                                                   – 1/3 ROCE
                                                   – 1/3 Individual targets                      • Cash incentive paid out at spin-off
                                                                                Mechanics        • Stock incentive depends on Siemens Energy share price
                                                                                                   performance and is paid out 3 years post listing

                Spin-off incentive for Executive Board
                                                                                Max pay-out      • Up to 4.75x of target         • Up to 6.0x of target
• Target amount: c.1.0x base salary                                             (+100% share       amount                          amount
                                                                                price increase
• Pay-out of 100-200% of target amount 120 days post spin-off in cash if        post spin-off)   • Up to €100m                   • Up to €680m
  certain targets are achieved (no pay-out if 100% target is not reached)
• Executive Board obliged to re-invest net profits from spin-off incentive in
  Siemens Energy shares

Page 10                                                                                                                    Unrestricted © Siemens 2020
Introduction of Siemens Energy
Siemens Energy combines all Siemens’ energy businesses in one
independent company
                                                                                                Siemens Energy AG
Reportable                                                                                                                                                          Siemens Gamesa Renewable
 segments                                                             Gas and Power (“GP”)
                                                                                                                                                                    Energy (“SGRE”)

                                                                                                                                                                    Order backlog (Mar-20): €28.6bn
       Key
                Order backlog (Mar-20): €52.0bn                   |    Ext. revenue FY2019: €18.6bn                 | Employees (Mar-20): ~67k                       Ext. revenue FY2019: €10.2bn
 financials
                                                                                                                                                                       Employees (Mar-20): ~25k

 Divisions

                Generation1)                                     Oil & Gas                                        Transmission                                                  67% owned

                   Distributed3)    #1                                                                                                                                             Offshore5)    #1
   Market                                                             In addressed
positions2)                                                               markets4)   #2                                             #1
                       Central3)    #2                                                                                                                                             Onshore5)     #3

                                                                         New Energy Business
                                                                          (Hydrogen Economy)
     Other
operations
                    EthosEnergy JV (49%)                                  Voith Hydro JV (35%)                              Siemens India (24%)6)

              1) Shanghai Electric Power Generation JV to be transferred from Siemens AG to Siemens Energy in FY2021 2) Based on internal market assessment for FY2019 in addressed markets. 3) Market
              position in terms of number of units ordered for large gas turbines (central) and industrial gas turbines (distributed). 4) Based on market value for new equipment in addressed markets. 5) Based
              on Wood Mackenzie (“Global Wind Turbine OEM 2019 Market Share”). Onshore position excluding China. Market positions for wind turbine suppliers are based on installed (China) and grid-
              connected (all other countries) new wind capacity for calendar year 2019. 6) As of 19 June 2020. Market value of listed participation: €1.1bn (EUR/INR = 85.3135; INR 1,067/share). To be
              allocated to divisions for financial reporting.
Page 12                                                                                                                                                                Unrestricted © Siemens 2020
Electrical infrastructure is system critical, growing and
in transformation
Transforming infrastructure Energy megatrends create opportunities for Siemens Energy
Electricity
generation Demand growth Decarbonization Digitalization Decentralization
in TWh
41,373
5% 38,713 • Access to • Growing share • Renewable • Shift towards
Electricity of renewables integration decentralization
11% 9% Other1)
• Datacenters • Grid investment requires in gas
digitalization
15% 19% Solar • Electrification
26,603 of industries • Value-add via
2% 3% 13%
18% • Electromobility
digitalization in
16% Hydro Service
5%
22%
23% 21% Wind
3% 1%
Gas Offshore wind Opportunities for
25% 14% increases small/medium
38% Oil
1% Opportunities for New demand in New service gas turbines
6% Coal
11% Nuclear all divisions transmission business models New solutions in
10% 8%
Hydrolyzers industrial
2018 2040 2040 emerging applications
Stated Sustainable
Policies Development
Source: IEA
1) Other includes geothermal, bioenergy and other renewables
Page 13 Unrestricted © Siemens 2020Differentiation through products, solutions, services and global
setup to address global energy megatrends
Demand growth Digitalization
9000HL GAS TURBINE HVDC
HVDC
PLUS
PLUS TOPSIDE 4.0 SENSPRODUCTS
Grid access to offshore Remote control and
>63% CC-efficiency IoT connected grid devices
wind farms monitoring for offshore
Decentralization Decarbonization
FLOATING POWER INDUSTRIAL POWER H2 ELECTROLYZER OFFSHORE WIND
~145MW of floating power to SGT-800 MGT: Silyzer 300: best-in-class SG 14-222 DD: Powerful
the Dom. Rep. 50% H2-capability efficiency of ~75% / 2,000 kg/h 14-15 MW turbine
Present in more than 90 countries we deliver leading technology to customers on a global scale
Page 14 Unrestricted © Siemens 2020Service is our strong base and drives our strategy
Conversion rate1)
Key pillars
High efficiency LGTs2: close to 100%
Lower efficiency LGTs2: 60 – 70%2)
• Large diverse fleet
Offshore: ~75%3)
Onshore: ~60%3)
• Broad customer base
New units
Highly • Highly attractive margin
resilient and
profitable
• Global network
• Digitalization opportunity
Order backlog (Mar-20)4) Service contract duration
• Group: €80.5bn 10 - 15 years5)
• GP: €52.0bn
5 - 10 years
• SGRE: €28.6bn
1) Percentage of new unit projects sold together with service agreements. 2) Renewal rate: 60% (estimate), target of 70% by 2020. 3) Conversion rate of own fleet based on SGRE definition as of FY2019.
4) Comprises New units and Service. Group incl. consolidation. 5) The average long-term program duration for O&G rotating equipment is ~8 years
Page 15 Unrestricted © Siemens 2020The new independent Siemens Energy: Performance powerhouse Combines all Siemens’ energy businesses under one roof Covers the full energy value chain from conventional to renewables Leading force in the global energy infrastructure Large service business provides foundation for value creation Management team with proven track record fully aligned with shareholders Page 16 Unrestricted © Siemens 2020
Financials
Summary financials

                                                                 Siemens Energy1)                                                      GP                                                     SGRE
in €m (unless otherwise indicated)                          FY2017    FY2018      FY2019                            FY2017            FY2018            FY2019               FY2017           FY2018            FY2019
Orders                                                        29,673           31,046            33,734               21,029           19,283            21,187                 8,768           11,875           12,749
Growth                                                                            4.6%             8.7%                                 (8.3)%             9.9%                                 35.4%                7.4%

External revenue                                              30,086           28,023            28,797               22,164           18,900            18,569                 7,920            9,121           10,226

Growth                                                                          (6.9)%             2.8%                               (14.7)%            (1.8)%                                 15.2%                12.1%

Adj. EBITA
                                                               2,061             1,316            1,305                1,746                815              836                  356               555                513
(pre severance)
Margin                                                          6.9%              4.7%             4.5%                 7.9%              4.3%             4.5%                 4.5%              6.1%               5.0%

Severance                                                          70              452               280                    43              375              247                    26                77                32

Adj. EBITA                                                     1,991               864            1,025                1,703                440              589                  330               478                481
Margin                                                          6.6%              3.1%             3.6%                 7.7%              2.3%             3.2%                 4.2%              5.2%               4.7%

Free Cash Flow                                                  (121)                80              876                  722               212              651                (288)               373                407

  • Positive order momentum in FY2017 – FY2019
  • Past profitability significantly impacted by ongoing reorganizations. Adj. EBITA pre severance stabilized in FY2019
  • Free Cash Flow in FY2019 benefitted from positive working capital effects at Generation and Transmission
1) Includes Corporate Items and Reconciliation which includes certain business activities and topics that are not directly related to the reportable segments. These are Real Estate Services, expenses and income
from pension-related topics not allocated to the segments as well as eliminations, treasury and other central topics to which the definition of Adjusted EBITA applies
Page 18                                                                                                                                                                      Unrestricted © Siemens 2020
Strong backlog and high and resilient service share
Order backlog1) Mar-2020 External revenue FY2019
By segment By business
Stable, recurring and profitable
revenue contribution
Service
GP
€18.6bn Service
SGRE
35%
€80.5bn Group
GP: €52.0bn
€28.8bn
SGRE: €28.6bn
65% Service
GP
SGRE
€10.2bn
1) Comprises New units and Service. Group incl. consolidation
Page 19 Unrestricted © Siemens 2020Moderate revenue decline despite macroeconomic headwinds
Revenue1): H1 FY2019 vs. H1 FY2020 (€bn) Comments: H1 FY2020
• Slight revenue increase in Gas and Power business
─ Moderate revenue growth in Transmission
-1.7%
13.4 13.2 ─ Stable revenue in Generation
Gas and
─ Moderate revenue decrease in Oil & Gas
Power
• Adj. EBITA H1 FY2020 below prior year
─ Product mix effects and additional costs for stand-alone set up
─ First impact of COVID-19, limited so far in H1
GP2) 8.8 +2.9% 9.0 • SGRE with revenue decline year-on-year
─ Strong order intake with new offshore projects in Taiwan (incl.
service), UK and the Netherlands
─ COVID-19 caused project execution delays in onshore and
offshore businesses and prolonged slowdown of Indian market
SGRE
─ Growing service business partially offset decline in project
execution
SGRE2) 4.7 -9.6% 4.2 • Y-o-Y profitability decline impacted by execution challenges in the
Northern European pipeline and the slow-down in India with
additional impact from COVID-19
H1 FY2019 H1 FY2020
1) Siemens Energy incl. central and consolidation. 2) External revenue.
Page 20 Unrestricted © Siemens 2020Strong balance sheet with sizeable net cash position
As of 31 March 2020
Capitalization SE excl. SGRE SGRE SE group
SGRE net debt: €(0.3)bn
-1.1
2.1 1.4
0.0
-0.6
1.5 1.4
-0.6
1.2 0.2
Excl. Excl.
leases: leases:
€2.1bn €2.6bn
Siemens net Loans SE Leases SE Net cash SE Cash Loans Leases Net cash SE Reversal: B/S net cash
cash injection excl. SGRE excl. SGRE excl. SGRE SGRE SGRE SGRE incl. SGRE def. carve- SE incl. SGRE
1) Siemens net cash injection includes certain earmarked cash effects from carve-out activities, which due to timing are not yet reflected in cash and cash equivalents out funding1)
as of 31 March 2020 of the Combined Financial Statements
Page 21 Unrestricted © Siemens 2020Siemens Energy leverages the Siemens ecosystem
• Corporate identity of Siemens Energy and SGRE continues to include “Siemens” brand
• Brand fee:
Usage of
– Siemens Energy ex. SGRE: 0.3-1.2% of brand-relevant revenue, based on Adj. EBITA margin1)
Siemens brand
– SGRE: none
• Initial tenure of trademark license agreement: 10 years
• Continued access to Siemens Financial Services for project financing of Siemens Energy customers
Project – Equity financing: Up to €1.5bn in first 5 years after spin-off; in subsequent 5-year period
Financing commitment for resulting sales proceeds, at least €0.5bn
– Debt financing/leasing: At arms’ length without recourse to Siemens Energy
Transitional & • Total cumulative volume over contract period: ~ €1.0bn (as of 31-Mar-2020)
long-term service
agreements • Focused on a.o. Human Resources, Accounting, Purchasing, Information Technology and selected R&D areas
1) Based on EBITA margin adjusted for the purpose of the trademark license agreement; EBITA margin < 6.5% = 0.3% / EBITA margin > 9.0% = 1.2%
Page 22 Unrestricted © Siemens 2020Sound capital structure & financial policies
• Sound €1.2bn net cash position1)
• €5.9bn undrawn credit lines give financial flexibility
Liquidity
– Siemens Energy (excl. SGRE): €3.0bn
– SGRE: €2.9bn
• Pension deficit SE incl. SGRE as of 31-Mar-20: €1.0bn (thereof SGRE: €14m)
Pensions
• In total €3.2bn gross pension and similar obligations and €2.1bn pension plan assets
Rating • Targeting a solid investment grade rating
• First dividend planned for FY2021 (pay-out in FY2022)
Dividend policy
• Pay-out ratio: 40-60% of net income2) to be funded from Siemens Energy’s Free Cash Flow
1) Siemens net cash injection includes certain earmarked cash effects from carve-out activities, which due to timing are not yet reflected in cash and cash equivalents as of 31 March 2020 of the Combined Financial
Statements
2) Net income attributable to Siemens Energy AG adjusted for extraordinary non-cash effects
Page 23 Unrestricted © Siemens 2020CFO takeaways
Strong capital structure with sizeable cash position
Large order backlog from a broad customer base across divisions
High and resilient service share from large installed base
Management focused on improvement of EBITA and cash generation
Page 24 Unrestricted © Siemens 2020Wrap-up
Key management priorities

                            Simplify work processes, improve cost base of organization and reduce
 Operational excellence     non-conformances through project execution excellence

                            Unlock cash from portfolio streamlining, footprint optimization, working
          Focus on cash     capital management and strict return criteria for capex and acquisitions

                            Invest in IT and digital infrastructure, drive data consistency and
          Embrace digital   automation of work processes across all areas of the company

  Competitive portfolio     Focus R&D on megatrends to extend our technology leadership position

          One company,      Align company culture to common goals, clear accountabilities, customer
           one culture      focus and people development

Page 26                                                                                   Unrestricted © Siemens 2020
Appendix: Business Page 27 Unrestricted © Siemens 2020
Overview of Generation Business

                                                                                       Portfolio overview

               Distributed generation                                                   Central generation                                                    Service

Products                  Solutions                                     Products                          Solutions                    • Maintenance programs • Long term programs,
• Industrial gas turbines • Industrial power                            • Large gas turbines              • Large power plants         • Modernizations &       operation &
• Indus. steam turbines     plants                                      • Large steam turbines                                           upgrades               maintenance
• Engines                                                               • Large generators                                                                    • Digital services
• Instrument. & controls                                                • Instrument. & controls

          Customer groups                                                                   Generation business segments and drivers
                                                   Business
           Utilities /                                              Central generation >100 MW                                                           Decentral generation
Overview of Oil & Gas Business
Portfolio overview
EAD Solutions
Products1) Services
(Electrical, Automation, Digitalization)
• Gas turbines • On-/offshore solutions • Spare parts, repairs, field services
• Industrial steam turbines • Marine solutions • Modernizations & upgrades
• Turbo compressors • Fiber solutions • Long-term service program, operation &
• Reciprocating compressors • Water Solutions maintenance program
• Generators • Subsea products & solutions • Digital services
Customer groups Broad coverage of the value chain
Oil & Gas Upstream Midstream Downstream Industries
Subsea Offshore Conv. onshore LNG Refining Synthetic Fiber Marine Distributed
products and production, production and processing fuels generation
solutions processing services
Gas & liquid
pipelines Petrochemicals
Industrial Offshore Onshore Unconventional (pumping, Chemicals Air Metals & Municipa-
drilling drilling compression) separation mining lities
Storage services services
Water solutions
1) Medium Gas Turbines, Generators, Industrial Steam Turbines sourced from Generation Division
Page 29 Unrestricted © Siemens 2020Overview of Transmission Business
Portfolio overview
Switching Non-switching Solutions Service
• Transmission systems • Power and distribution transformers • Substation and grid access • Product related services
• Gas-insulated switchgear • Bushings, instrument transformers, • HVDC / MVDC / FACTS • Modernization, upgrades
• Circuit breakers, surge arresters, coils • E-packages and mobile solutions • Long term programs incl.
disconnectors • Bundles and systems • Compact transmission lines operations
Customer groups Full coverage of electricity transmission value chain
Consumer
Generation
Transmission and distribution Industry &
TSOs central & decentral
infrastructure
Utilities /
Independent Power Producers
Oil & Gas
Industry & Infrastructure
Page 30 Gas insulated switchgear Air insulated switchgear Power & distr. transformers Unrestricted © Siemens 2020Overview of SGRE Business
Portfolio overview
Onshore wind Offshore wind Services
• 9 main turbines types in current portfolio ranging • 5 turbines types in current portfolio ranging • Operation and maintenance offerings
from 2.1 to 5.8 MW 1) from 6 to 14 MW 2) • >70 GW under maintenance
• Presence in adjacent renewable fields such as • Testing projects in floating wind turbines • Latest acquisition of Senvion’s intellectual
hybrids property and onshore service fleet in Europe
Customer groups Global reach and scale3) Selected performance indicators
€28.6bn order backlog (Q2 FY2020)
Utilities /
Independent Power Producers
€10.2bn external revenue (FY2019)
Other ~25k employees (Q2 FY2020)
Project Financial
energy
developers investors
consumers
~100 GW installed (Q2 FY2020)
1) Excluding legacy products. 2) 14 MW nominal capacity, can be expanded to 15 MW under certain conditions. 3) Main sites only, non-exhaustive
Page 31 Unrestricted © Siemens 2020SGRE is integral part of the group:
key cooperations and corporate governance aspects
• Ownership: Siemens Energy holds 67% strategic stake in SGRE; at least qualified (2/3) majority at AGM
(depending on free float AGM participation)
Ownership & • Shareholder agreement with Iberdrola terminated in February 2020 and legal disputes with Iberdrola settled
governance
• Board of Directors: 5 proprietary directors, 4 independent and one executive
• Management team in place with extensive industry background
• Framework agreement will regulate the governance interaction between Siemens Energy and SGRE
• Strategic Alliance agreement will provide a framework for business collaboration aimed to contribute to
announced synergies1)
─ Examples of identified areas of collaboration: Procurement (pooling of volumes, strategic supply of selected
Operating components), cross-division and cross-regional customer and market development cooperation
cooperation
─ Upon the spin-off, parties will continuously investigate fields of common interest
• Related party transactions approval process in place to ensure transactions are carried out at arm's length and in
accordance with applicable law for the best interest of the company
• Audit, Compliance and Related Party Transactions Committee with majority of independent directors
• Siemens Energy standalone rating expected to be supportive or beneficial for SGRE’s
Financing
• Siemens Energy and SGRE with separate cash pooling and credit lines
1) Siemens AG announced on 4-Feb-2020 annual savings of up to €100m through intensified collaboration between Siemens and SGRE
Page 32 Unrestricted © Siemens 2020Appendix: Financials Page 33 Unrestricted © Siemens 2020
Reconciliation of financials (1/3)
Orders and revenue

                                       Orders                                                                           External revenue

In €m                                            FY2017      FY2018      FY2019             In €m                                        FY2017      FY2018         FY2019

 1        Segment Gas and Power                   21,029      19,283      21,187             1   Segment Gas and Power                    22,164      18,900        18,569

 2        Segment SGRE                             8,768      11,875      12,749             2   Segment SGRE                              7,920       9,121        10,226

          Reconciliation to Combined                                                             Reconciliation to Combined
 3                                                  (124)       (112)      (202)             3                                                  2           2            2
          Financial Statements                                                                   Financial Statements

Siemens Energy group                              29,673      31,046      33,734            Siemens Energy group                          30,086      28,023        28,797

     1•     Financials of Gas and Power segment do not reconcile with Siemens AG’s historical Gas and Power segment reporting due to scope adjustments

     2•     Financials of SGRE segment can be reconciled with SGRE’s standalone reporting and Siemens AG’s segment reporting

     3•     Corporate items and reconciliation includes certain topics that are not directly related to the reportable segments as well as consolidation effects

Page 34                                                                                                                               Unrestricted © Siemens 2020
Reconciliation of financials (2/3)
Bridge from Adj. EBITA to EBT
Reconciliation from Adj. EBITA to EBT Commentary
1• Adj. EBITA
In €m FY2017 FY2018 FY2019 ─ Gas and Power: Reflects spin-off scope / deviates from Siemens
AG segment reporting
Gas and Power 1,703 440 589
─ SGRE: Consistent with Siemens AG reporting
1
SGRE 330 478 481 ─ Corporate items and reconciliation: Contains elements of Real
Reconciliation to Combined Financial Estate services, pension as well as eliminations, treasury and
(42) (54) (44) other central items that meet the definition of Adj. EBITA
Statements
Adj. EBITA 1,991 864 1,025 2• PPA amortization
PPA amortization (507) (545) (499) 2 ─ Amortization of acquired intangibles assets (a.o. Dresser Rand,
Rolls Royce, SGRE combination, Adwen)
Reversal: Net fin. income operating business 6 51 70 3 3• Net financial income from operating business
EBIT 1,490 370 597 ─ Mainly interest income/expense from pension plans
Reversal: Associate income1) (65) 85 (111) 4• Associate income1): Largest at-equity investments and JVs:
EBIT (excl. associate income / net fin. ─ RWG (Repair & Overhauls) – 50% shareholding
1,425 455 486
income from operating business) ─ Maschinenfabrik Reinhausen – 20% shareholding
─ Siemens Limited India – 24% shareholding
Associate income1) 65 (85) 111 4
Financial result2) (182) (219) (280) 5 5• Financial result2)
─ Does not reflect future capital structure implemented as of 31
Income before income taxes 1,309 151 317 March 2020
1) Income (loss) from investments accounted for using the equity method, net
2) Financial result represents the sum of (i) interest income, (ii) interest expense and (iii) other financial income (expenses), net Unrestricted © Siemens 2020
Page 35Reconciliation of financials (3/3)
Details on Siemens Energy Free Cash Flow
Reconciliation of Siemens Energy free cash flow Commentary
In €m FY2017 FY2018 FY2019 1• Free Cash Flow – Total segments
FCF – Gas and Power 722 212 651 ─ Gas and Power / SGRE: Reflects segment Free Cash Flow
before taxes and central/other items
FCF – SGRE (288) 373 407 1 ─ Volatility reflects payment patterns of large projects
Free Cash Flow – Total segments 434 584 1,058 2• Tax related cash flows
Income taxes paid (618) (541) (287) 2 ─ Reflects income taxes paid
Reconciliation to Combined Financial 3
62 37 105 3• Reconciliation to Combined Financial Statements
Statements
Free Cash Flow – Group (121) 80 876 ─ Consists of pension (accruals and prepaid costs) and
depreciation attributable to the Real Estate function
─ Reflects mainly interest income/expense, net and pension
related interest expense
FY2017 FY2018 FY2019 4• Free cash flow presentation as per Combined Financial
Statements
Cash flow from operating activities 686 844 1,694
Additions to intangible assets & PPE1) (807) (764) (818) 4
Free Cash Flow – Group (121) 80 876
1) Property, plant and equipment
Page 36 Unrestricted © Siemens 2020Efficient asset base with low tangible capital employed
Combined Statement of Financial Position
Commentary
of Siemens Energy as of 31 March 2020 (€bn)
Assets Liabilities and Equity Capitalization:
Cash and cash equivalents 1.9 Short-term debt 0.7 • Siemens Group receivables/payables largely related to
financing (net financing receivables: €1,873m)
Receivables from Siemens Group 3.7 Payables to Siemens Group 1.0
Financial debt:
Trade receivables & contract assets 9.0 Trade payables & contract liabilities 14.2 • Significant portion of financial debt relates to liabilities
arising from lease arrangements
Inventories 7.5 Other current liabilities 5.7
– Current: €0.3bn
Other current assets 2.2 – Non-current: €0.9bn
• Non-leasing financial debt mainly at SGRE level
Current assets 24.3 Current liabilities 21.6
Net cash and equity ratio:
Goodwill & other intangible assets 14.3 Long-term debt 1.7 • Strong €2.4bn net cash position (excl. leases) / €1.2bn
Provisions for pensions and similar (incl. leases)1)
Property, plant and equipment 4.7 1.0
obligations • Equity ratio at 38%
Invest. acc. for using equity method 0.8 Other non-current liabilities 4.1
Other non-current assets 1.7
Non-current assets 21.5 Non-current liabilities 6.8
Total equity 17.3
Total assets 45.8 Total liabilities and equity 45.8
1) Siemens net cash injection includes certain earmarked cash effects from carve-out activities, which due to timing are not yet reflected in cash and
Page 37 Unrestricted © Siemens 2020
cash equivalents as of 31 March 2020 of the Combined Financial StatementsBanks advising Siemens on Siemens Energy spin-off
Lead financial
advisors and
listing agents
Co-advisors
Page 38 Unrestricted © Siemens 2020You can also read


