Life Cycle Assessment Model of Plastic Products: Comparing Environmental Impacts for Different Scenarios in the Production Stage - Semantic ...
←
→
Page content transcription
If your browser does not render page correctly, please read the page content below
polymers
Article
Life Cycle Assessment Model of Plastic Products: Comparing
Environmental Impacts for Different Scenarios in the
Production Stage
Viktoria Mannheim

                                          Higher Education Industrial Cooperation Center, University of Miskolc, 3515 Miskolc-Egyetemváros, Hungary;
                                          mannheim@uni-miskolc.hu

                                          Abstract: This paper assesses the environmental loads of polypropylene and PP-PE-PET mixed-
                                          plastic products throughout the products’ life cycle in the production stage, with particular focus
                                          on the looping method. A life cycle model of homogeneous and mixed-plastic products has been
                                          developed from the raw material extraction and production phase through its transport with the
                                          help of the life cycle assessment method. To find the answers to the questions posed, different
                                          impacts were analyzed by the GaBi 9.5 software. The analysis lasted from the beginning of the
                                          production process to the end. The aim of this research was to determine the energy and material
                                          resources used, the emissions produced, and the environmental impact indicators involved. This
                                          article examines three scenarios in the production stage, based on the usage of plastic scrap and
                                          process water: (1) plastic scrap and wastewater are recirculated with looping method; (2) plastic
                                          scrap goes through an incineration process and wastewater is treated in a municipal wastewater
                                treatment plant; (3) plastic scrap is sent to a municipal landfill and wastewater is treated. This article
                                   tries to answer three questions: (1) how can we optimize the production stage? (2) Which materials
Citation: Mannheim, V. Life Cycle         and streams are recyclable in the design of the life cycle assessment? (3) What is the relationship
Assessment Model of Plastic               between the environmental impacts of homogeneous and mixed-plastic products? The results of this
Products: Comparing Environmental         research can be used to develop injection-molding processes with lower environmental impacts and
Impacts for Different Scenarios in the    lower releases of emissions.
Production Stage. Polymers 2021, 13,
777. https://doi.org/10.3390/             Keywords: mixed-plastic product; polypropylene product; production life cycle stage; life cy-
polym13050777
                                          cle assessment

Academic Editor: Józef Flizikowski

Received: 14 February 2021
                                          1. Introduction
Accepted: 1 March 2021
Published: 3 March 2021
                                               Life cycle assessment (LCA) is a methodology proposed by Bicalho et al. that is used
                                          to evaluate the environmental impacts of products from the production of raw materials to
Publisher’s Note: MDPI stays neutral
                                          the products’ end of life [1]. According to the scientific works of Jensen et al. [2], life cycle
with regard to jurisdictional claims in
                                          analyses flows were initially determined for the depletion of material and energy resources.
published maps and institutional affil-   Life cycle assessment is one of the most common and reliable methods by Klöpffer and
iations.                                  Grahl [3]. Life cycle methodologies can be applied to several aspects of production. To
                                          achieve process optimization, life cycle assessment can be successfully used to analyze the
                                          environmental impact of different stages of a product’s life cycle [4,5]. The LCA process
                                          begins with the determination of goals and system boundaries. In cases where boundaries
Copyright: © 2021 by the author.
                                          are well defined, the following step is life cycle inventory analysis (LCI) and then life
Licensee MDPI, Basel, Switzerland.
                                          cycle impact assessment (LCIA). Finnveden et al. [6–8] review the differences in life cycle
This article is an open access article
                                          assessment methods. The variety of developed databases and software programs provide
distributed under the terms and           us the opportunity to devise environmental impact reduction solutions at different life
conditions of the Creative Commons        cycle stages, as demonstrated by Bach et al. [9].
Attribution (CC BY) license (https://          The use of plastic products in the technological sphere has, in recent years, received
creativecommons.org/licenses/by/          increased attention. The use of injection-molding processes is widespread in the manu-
4.0/).                                    facture of plastic products. Due to the importance of these processes, scientific research is

Polymers 2021, 13, 777. https://doi.org/10.3390/polym13050777                                            https://www.mdpi.com/journal/polymers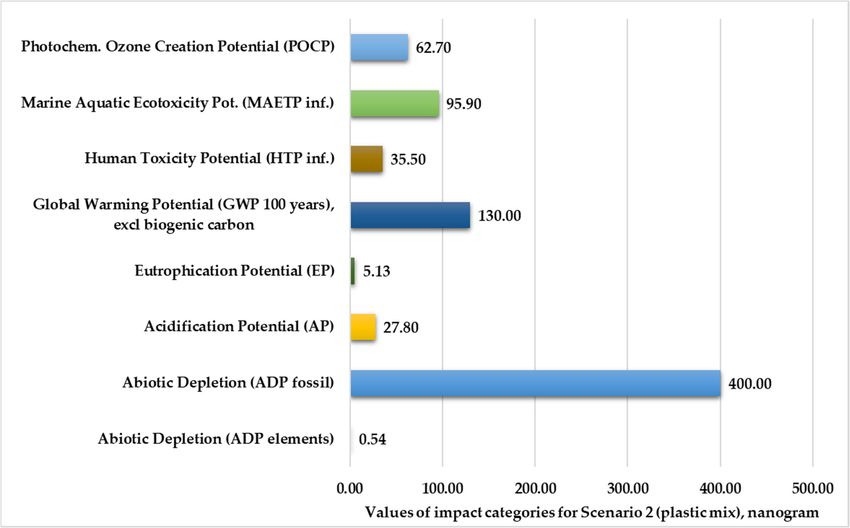
Polymers 2021, 13, 777                                                                                             2 of 20

                         increasingly concerned with the life cycle analysis of molded products [10,11]. Life cycle
                         assessment is one of the most appropriate methods for analyzing the environmental impact
                         of a polymer product.
                               In the context of circular economy and sustainability, it is important to evaluate the
                         life cycle of plastic products. In accordance with the European Environment Agency, the
                         practical solutions aimed at establishing a circular economy include extending the life
                         cycle of products [12]. Many research studies have argued that the circular economy
                         promotes minimizing material and energy flows and reducing waste [13]. Focusing on the
                         safety of the circular economy can take LCA to a new level and set additional targets for
                         reduced environmental impact. The idea of a full life cycle in this research topic has been
                         raised by Civancik-Uslu et al. [14,15]. According to the conclusions of Erdélyi et al. [16], in
                         accordance with the life cycle assessment approach, the carbon footprint associated with
                         the phases of transport and waste management processes should also be specified.
                               In assent with the scientific results of Labuschagne et al. [17], in the innovative techno-
                         logical developments based on life cycle assessments, the manufacturing stage must be
                         considered especially. At the production stage, we need to consider that plastic waste can be
                         treated via disposal, incineration, or recycling processes. In assent with LCA studies [18,19]
                         and European Food Safety Authority (EFSA) [20], recycling plastic waste is generally
                         environmentally preferred. The quality of the recycled polymer product mainly depends
                         on the physicochemical properties of the polymer, as well as the processing conditions and
                         the purity of the input waste. Several studies have attempted to address economic and
                         ecological issues by limiting the widespread use of chemical recycling processes [21,22].
                         Life cycle analysis with looping method in the manufacturing stage promotes sustainable
                         production by maintaining the value of products [23]. In the production phase, the use
                         of renewable raw materials has increased in recent years and waste generation has de-
                         creased [24]. Plastic scrap looping has the potential to become a new and effective strategy
                         in the production stage within the new framework defined by sustainable production and
                         the circular economy. In agreement with the scientific studies of Villares et al. [25], the use
                         of life cycle assessment at early planning stages gives neither final nor accurate results but
                         can have a great impact on the environmental performance, especially when comparing
                         scenarios. the application of life cycle assessment in the early planning stages gives neither
                         definitive nor accurate results, but can have a major impact on environmental performance,
                         especially when comparing different scenarios. Grosso et al. [26] introduced beneficial
                         solutions involving the use of recycled scrap instead of virgin material. A life cycle analysis
                         of plastic products with the use of scrap and process water looping has not been previously
                         performed within the European Union. The principle of reduction aims at minimizing the
                         use of raw materials, energy, and waste during the production phase, while the principle
                         of re-use aims at the proper re-use of products (Ghisellini et al. [27]).
                               The aim of this research was to analyze the environmental burdens of a polypropylene
                         product and a mixed-plastic product throughout the product’s production phase, focusing
                         on the injection-molding stage. The main goal was to investigate information on the
                         impact categories and resources related to the injection-molding of polymer products. In
                         this research, three different solutions were examined: (1) the use of recirculated plastic
                         waste and water looping; (2) not using the looping, where plastic scrap is incinerated and
                         wastewater is treated; and (3) without looping, where scrap is landfilled and wastewater
                         is treated.
                               The first goal of this research work was to compare the environmental impact of the
                         different plastic products’ manufacturing phases. The second objective was to propose an
                         injection-molding technology that offers an enviro-friendly technological solution. The
                         first section of this paper explains the methodology, including our goal, different examined
                         scenarios, the determination of the functional unit and the system boundaries, the allocation
                         method, and the applied software. The first part of this article explains the methodology
                         and the applied methods, including the functional unit and system boundaries, the different
Polymers 2021, 13, 777                                                                                            3 of 20

                         scenarios, the allocation method, and the life cycle assessment software. The next part
                         describes the life cycle inventory and evaluates the life cycle impact assessment.
                              This paper introduces the calculated environmental impact categories, the material
                         and energy resources, and the emission values. The main section provides the obtained
                         research results for three scenarios. The last section presents the conclusions of the research
                         work. The results serve the design of manufacturing processes with lower environmental
                         impact and the improvement of the environmental performance of the injection-molding
                         process. This work is relevant because the reduction in resources and environmental
                         impacts is authoritative in a life cycle analysis.

                         2. Materials and Methods
                         2.1. Methodology and Scenarios
                               The life cycle assessment methodology was applied in accordance with the recom-
                         mendations of ISO 14040 and 14044 standards [28,29]. The ISO 14040 standard defines the
                         LCA methodology by explaining different life cycle phases. The goal phase defines the
                         context of the research study. The life cycle inventory phase identifies the inputs that are
                         inputs to the system. The life cycle impact assessment phase defines the environmental
                         impact categories. In the interpretation phase, the information from the results are evalu-
                         ated [5,28,29]. This research study comprises the life cycle inventory phase, the life cycle
                         impact assessment phase, and the interpretation of the results. This approach enables the
                         analysis of the environmental impacts associated with the manufacturing stage in the life
                         cycle of the plastic products (from different plastic granules), from the extraction of raw
                         materials for their injection-molding until the plastic scrap becomes plastic waste. The
                         homogenous polypropylene and PP-PE-PET granules are produced in the European Union
                         and processed in the local injection-molding plant of polymer products. The granules are
                         molded and the plastic scrap is managed as plastic waste in an incineration plant or on
                         a landfill.
                               This paper analyzes three scenarios that define the life cycle of the different plastic
                         products. Different methodologies have been developed for the distribution of material and
                         energy consumption and the resulting emissions and waste. Two parameters (plastic scrap
                         and process water) and two plastic products from different polymer granules were analyzed
                         in terms of their response to possible changes in the manufacturing stage to identify which
                         of the different examined scenarios is preferable from an environmental view.
                               In the first scenario, the injection-molding process is examined with looping-method.
                         Here, plastic waste is recycled, and the cooling water is managed in 50% as wastewater.
                         The second and third scenarios determine the manufacturing process without looping. In
                         the second scenario, plastic waste is incinerated, and wastewater is handled in a municipal
                         wastewater treatment plant. The third scenario determines the resources and environ-
                         mental impacts when plastic scrap is landfilled, and wastewater goes through wastewater
                         treatment. The effects of replacement and recycling were not calculated. The input-output
                         data for the production stage were calculated considering the reference flows.
                               This research provides new information regarding the objective environmental impacts
                         associated with the production of different polymer products in the European Union by
                         comparing different scenarios for the injection-molding process with a looping method
                         and without looping using plastic waste and wastewater treatment technologies.

                         2.2. System Boundaries, Functional Unit and Allocation
                              This research examines the life cycle of the manufacturing stage, taking into account
                         the stage of extraction of raw materials needed for injection-molding. The manufacturing
                         process was assigned as a function of the mass of the molded polymer. The system
                         boundaries were developed from the beginning to the end. Datasets were linked with
                         injection-molding process data to create life cycle inventories for the examined plastic
                         products. Auxiliary systems included transporting materials for production, obtaining
                         electric power from a Hungarian energy mix, and diesel oil for the transportation of the raw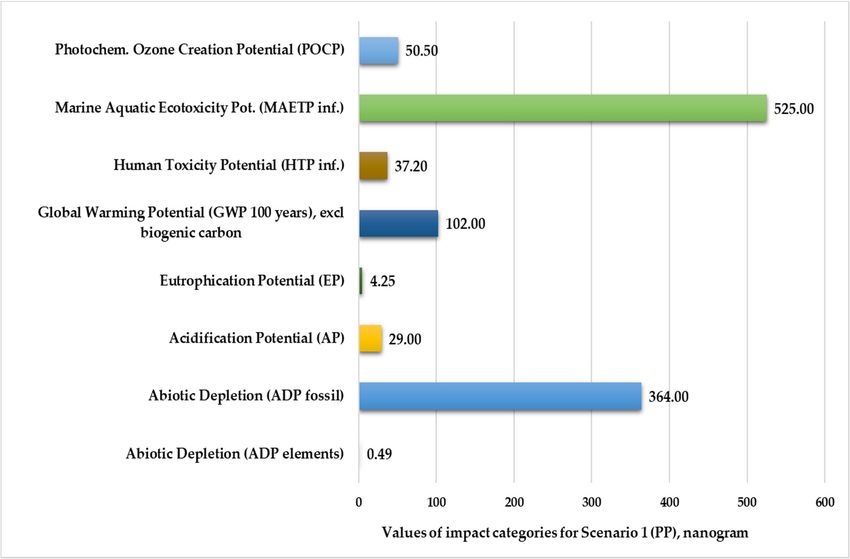
Polymers 2021, 13, 777                                                                                          4 of 20

                         materials. Plastic products have a 20-year lifetime and the analyzed amount was molded
                         in 1 h.
                              Considering the effects of the life cycle of products in the manufacturing phase, the
                         functional unit is defined as the distribution of 28 kg of product output. In the production
                         stage all materials and energy that were used as well as all emissions that were produced
                         are related to the plastic product of the injection-molding process. In addition to the main
                         polymer products, this process produces plastic waste and wastewater.
                              The allocation hierarchy we used was that suggested by ISO 14044 [29]. For the
                         transport of refinery products (diesel oils), the emission allocation was by mass. The
                         energy demand was taken into account as a function of the input energies. Recycling
                         of plastic waste would reduce the environmental impact by following the distribution
                         method and ignoring the collection and transport stages. Therefore, we can optimize the
                         injection-molding process with a lower environmental load.

                         2.3. LCA Software
                               The aim was to determine and quantify the resources, emissions, and environmental
                         impacts for the different polymer products in the production stage with professional
                         and extension dataset. The analysis of the tested system was performed by using GaBi
                         9.5 thinkstep software (Sphera Solutions Ltd., Stuttgart, Germany). Normalized and
                         weighted values for the different scenarios were determined by the Higher Education
                         Industrial Cooperation Centre (HEICC) of the University of Miskolc. The applied LCA
                         software provided valuable resources to support the consistent modelling of the production
                         life cycle. The results from the LCA software highlight the estimated environmental
                         performance in terms of various aspects, such as carbon footprint, resource and energy
                         consumption, and various environmental impacts [30].

                         2.4. Life Cycle Inventory Methodology and Life Cycle Impact Assessment Method
                               In this research analysis, the environmental effects associated with the production
                         life cycle of plastic products are considered. Cradle-to-gate data for polymer products are
                         provided to illustrate the contribution of the converting process to the life cycle inventory
                         results to produce injection-molded products. The quality of the life cycle inventory method
                         is directly related to the accuracy of the data. The applied life cycle inventory method
                         includes the input-output material flows and energy requirements for the unit process. For
                         the modelling of injection-molded product systems, we used product-specific input data.
                         This methodology distributes energy demand and emissions among molded products in
                         addition to mass allocation. The dataset for polymer granules includes annual averages.
                         The life cycle inventory is primarily in line with industry data on internationally prevalent
                         manufacturing processes.
                               Accounted resource inputs include material and energy use, while process production
                         includes plastic products and emissions to soil, air and water. In the manufacturing stage,
                         each dataset includes incoming transportation. The injection-molding process was also
                         examined as a looped system by accounting for all resource inputs and process outputs.
                         I used allocation to divide the environmental load of process water and plastic waste.
                         The amount of energy used to heat, cool, and illuminate the injection-molding space is
                         not included in the LCI system boundaries. The life cycle inventory does not include
                         the following components: investment vehicles, miscellaneous materials and additives.
                         The applied methodology is in line with the life cycle inventory described in ISO 14040:
                         2006 [28].
                               The aim of the life cycle assessment is to find the optimal process conditions, which
                         will lead to a reduction in the consumption of natural resources [31]. LCA phases include
                         goal and scope definition, life cycle inventory, environmental impact assessment, and
                         interpretation of the results [28,31]. The life cycle impact assessment method can be used
                         to determine the relative risk of emissions from the system under study to humans or the
                         environment. The Energy and Climate Policy Framework for 2030 established ambitious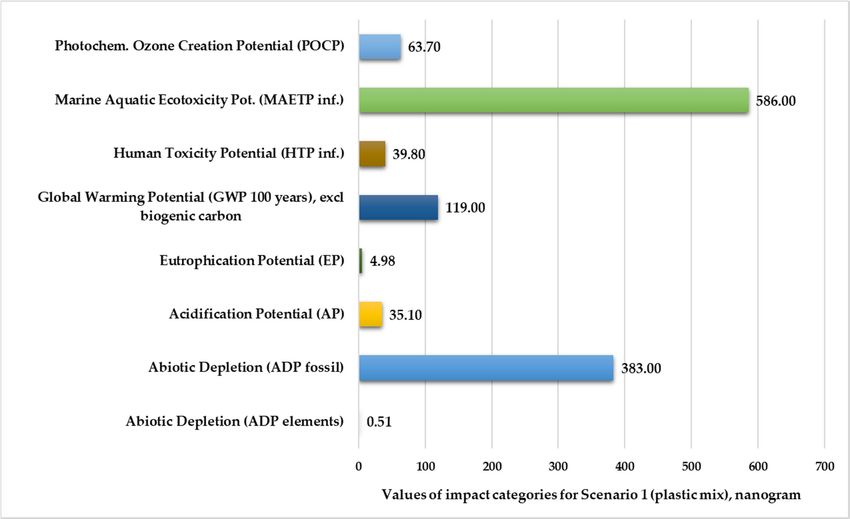
Polymers 2021, 13, 777                                                                                           5 of 20

                         commitments to reduce greenhouse gas emissions by at least 40% by 2030 [31,32]. There
                         are many aspects of ISO 14040 standards for the design and implementation of life cycle
                         assessment [28,33]. The life cycle impact assessment phase aims to investigate the possible
                         environmental impacts in the studied system [34].
                              During the life cycle impact assessment, the reference system was the total inputs
                         and outputs for the European Union. In Europe, the focus is on the characterization
                         methods, I applied the CML (the Institute of Environmental Sciences) method. In this
                         method, the impact categories have been developed by the Centre for Environmental
                         Science at Leiden University [35–37]. The normalization and weighting methods were
                         the same for all analyses performed. The applied normalization reference represented the
                         environmental impacts of 28 European Union countries. The weighting method for the
                         LCIA survey in 2012 was CML 2016 for Europe. Eight environmental impacts—global
                         warming, eutrophication, acidification, photochemical ozone creation, human toxicity,
                         abiotic depletion (fossil and elements), and marine aquatic ecotoxicity—were used for
                         this research analysis. The potential value of global warming is for 100 years, except
                         for biogenic carbon. Sulphur, nitrogen oxides, and phosphorous compounds are directly
                         related to eutrophication and acidification potentials. The formation of tropospheric ozone
                         was considered in terms of the photochemical ozone creation potential. Human toxicity
                         potential describes the effects of toxic substances. Abiotic resource depletion is one of the
                         most debated impact categories. Guinée et al. [38–40] based the characterization model
                         of abiotic resource depletion on physical data on reserves and annual deaccumulation.
                         Marine aquatic ecotoxicity refers to the effects of toxic substances released into marine
                         aquatic ecosystems.
                              In this paper, the functional unit value was 28 kg of plastic product and different
                         environmental loads were investigated for the life cycle of the product. A standard unit
                         of output was used as the basis for determining the life cycle resource requirements
                         and environmental emissions of different plastic products of 28 kg. By the assessment
                         of the production stage of the investigated plastic products and its optimal approaches,
                         the life cycle assessment results for different products were compared by quantifying
                         the environmental impacts, resources, and emissions. The environmental loads were
                         calculated for all scenarios and summarized to compare the environmental impacts of the
                         polymer products.

                         3. Results and Discussion
                         3.1. Production Stage Setup Process
                               The life cycle of the plastic products can be divided into different stages based on the
                         environmental product declaration (EPD) modules [41]. As shown in Figure 1, points of
                         intervention for material and energy efficiency strategies can occur throughout a product’s
                         life cycle by EPD technological modules. In the manufacturing stage (A1–A4), numerous
                         factors and environmental loads must be considered. This phase encompasses the supply
                         of raw materials (plastic granules, compressed air, and process water), energy supply, the
                         transport of raw materials, and the injection-molding process. The production stage of the
                         examined plastic products is based on an injection-molding process under actual operating
                         conditions. At the production stage, I worked with the latest data from the GaBi 2020
                         database. This stage involved injection-molding the plastic granules as well as shipping the
                         plastic product to be used. During the life cycle assessment of the injection-molding process,
                         the background of the raw and auxiliary materials was also considered. These data are
                         valid for the period 2019–2022. The raw materials used for the injection-molding process
                         are homogeneous polypropylene and mixed-plastic granules, compressed air, and process
                         water, where 30 kg of granules form 28 kg of plastic product in 1 h. The polypropylene
                         granules are a polypropylene technology mix. The mixed-plastic granules are the author’s
                         own PP-PE-PET mix (in an equal weight distribution) from EU-28. For electricity, the
                         Hungarian energy mix was introduced in the latest statistical database.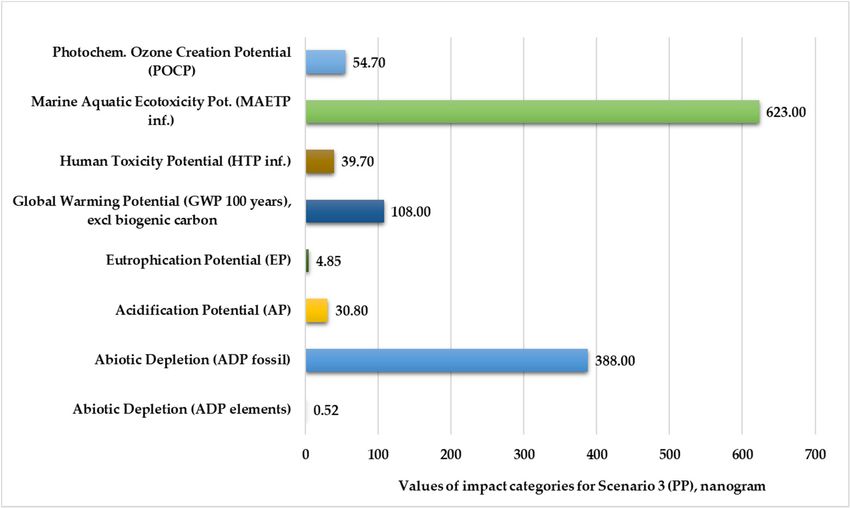
These data are valid for the period 2019–2022. The raw materials used for the injection-
molding process are homogeneous polypropylene and mixed-plastic granules, com-
pressed air, and process water, where 30 kg of granules form 28 kg of plastic product in 1
h. The polypropylene granules are a polypropylene technology mix. The mixed-plastic
Polymers 2021, 13, 777
granules are the author’s own PP-PE-PET mix (in an equal weight distribution) from EU-
6 of 20
28. For electricity, the Hungarian energy mix was introduced in the latest statistical data-
base.
Figure 1.
Figure 1. Product life
life cycle
cycle by
by environmental
environmental product
product declaration
declaration modules.
modules.
In
In this research
research analysis,
analysis, the
the life
life cycle
cycle of a polypropylene
polypropylene product
product and and aa mixed-plastic
mixed-plastic
product
productwerewereexamined
examinedfrom fromthethe
raw rawmaterial extraction
material to the
extraction to end
the ofendtheofproduction stage
the production
with transports. I designed with a maximum product loss of 7%
stage with transports. I designed with a maximum product loss of 7% in the manufactur- in the manufacturing
phase. The The
ing phase. examined
examinedscenarios in the
scenarios in production
the productionstagestage
are as
arefollows:
as follows:
Scenario 1: The plastic waste and the wastewater are looped.
Scenario 1: The plastic waste and the wastewater are looped.
Scenario 2: The plastic waste is incinerated and the wastewater is treated (without the
Scenario 2: The plastic waste is incinerated and the wastewater is treated (without
looping method).
the looping method).
Scenario 3: The plastic waste is landfilled and the wastewater is emitted to a municipal
Scenario 3: The plastic waste is landfilled and the wastewater is emitted to a munici-
wastewater treatment plant (without the looping method).
pal wastewater treatment plant (without the looping method).
First, I determined the mass and energy values of the input-output parameters of the
First, I determined
injection-molding process the
ofmass
pure and energy values
polypropylene andof the input-output
plastic mix products, parameters of the
such as process
injection-molding
water, process
plastic granules, of pureand
electricity, polypropylene
compressed and plastic
air. The mixflows
waste products, such
(plastic as pro-
scrap and
cess water, plastic
wastewater) granules,
generated in theelectricity,
production and compressed
stage air. The waste flows (plastic scrap
were determined.
and wastewater)
I applied dummy generated in thein
processes production
the softwarestage were determined.
to design the production. I connected a
I applied dummy processes in the software
flow output to the same process as the input. According to designto the production.
first scenario,I connected
I circulateda
flowwater
the output
flowto in
thea same process
50% closed as the
loop, andinput. According
the other part oftothethe first flow
water scenario, I circulated
was handled as
the water flow
wastewater. Theinlife
a 50%
cycleclosed loop, and
assessment the other
processes andpart
plansof were
the water
set up flow
for was handled as
the production
wastewater.
life cycle stageThein life
the cycle assessment
applied processes and plans were set up for the production
GaBi 9.5 software.
life cycle stage in the applied GaBi 9.5 software.
3.2. Environmental Impact Results for the Different Scenarios
The environmental impacts of water consumption on the product systems were
assessed with the LCIA methods developed by Pfister et al. [42] as well as the method
proposed by Frischknecht et al. [43,44]. In the second scenario, the product loss was
treated as plastic scrap with incineration, and in the third scenario the plastic scrap was
landfilled. The transport distance was 100 km with utilization of 85%, taking into account
road transport in the European Union. The electricity and refinery products were modelled
in harmony with the individual country-specific situation. Table 1 describes the examined
environmental impacts in this research analysis.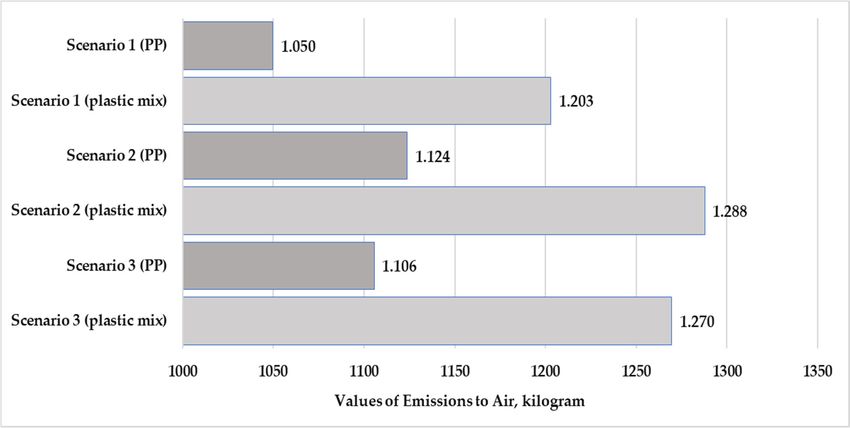
The environmental impacts of water consumption on the product systems were as-
sessed with the LCIA methods developed by Pfister et al. [42] as well as the method pro-
posed by Frischknecht et al. [43,44]. In the second scenario, the product loss was treated
as plastic scrap with incineration, and in the third scenario the plastic scrap was landfilled.
Polymers 2021, 13, 777 The transport distance was 100 km with utilization of 85%, taking into account 7 of 20 road
transport in the European Union. The electricity and refinery products were modelled in
harmony with the individual country-specific situation. Table 1 describes the examined
environmental impacts in this research analysis.
Table 1. The examined environmental impact categories [28,29].
Table 1. The examined
Impactenvironmental
Categories impact categories [28,29]. Equivalent
Abiotic Depletion ADP elements, ADPE kg Sb Equivalent
Impact Categories
Abiotic Depletion ADP fossil, ADPF
Equivalent
MJ
Abiotic Depletion ADP
Acidification elements,
Potential AP ADPE kg kg
SO2Sb Equivalent
Equivalent
Eutrophication Potential
Abiotic Depletion ADP fossil, EPADPF kg Phosphate Equivalent
MJ
Freshwater A. Ecot. P. FAETP inf. kg DCB Equivalent
Acidification
Global Potential
Warming Pot. GWP 100 APyears kgkg
COSO 2 Equivalent
2 Equivalent
Eutrophication Potential
Human Toxicity Potential HTPEP inf. kgkgPhosphate Equivalent
DCB Equivalent
Marine A. Ecotox. Pot. MAETP inf. kg DCB Equivalent
Freshwater A. Ecot. P. FAETP inf. kg DCB Equivalent
Photochem. Ozone Creat. Pot. POCP kg Ethylene Equivalent
GlobalTerrestric
Warming Pot.Pot.
Ecotox. GWP TETP 100
inf.years kgkg
DCBCO 2 Equivalent
Equivalent
Human Toxicity Potential HTPstate
Ozone Depletion Pot. ODP steady inf. kgkg DCB Equivalent
R11 Equivalent
Marine A. Ecotox. Pot. MAETP inf. kg DCB Equivalent
Photochem. Ozone
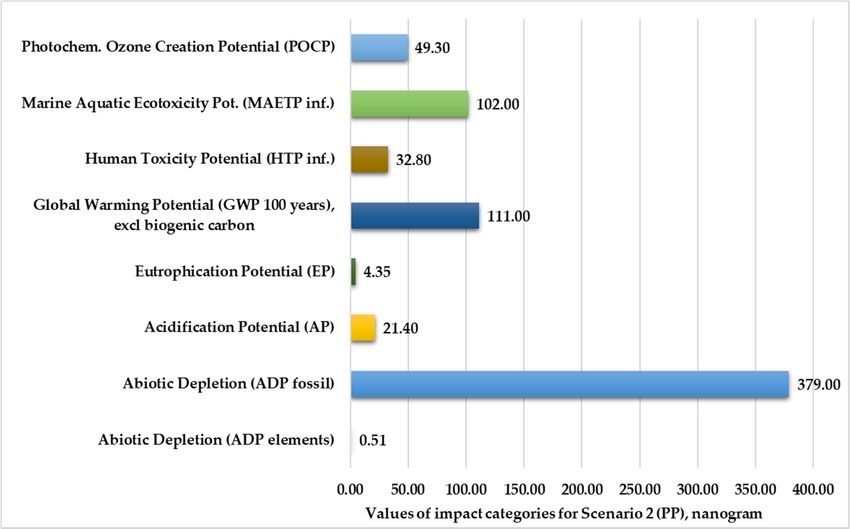
Figures 2 and Creat.the
3 present Pot. POCP and weightedkg
normalized Ethylene
values Equivalent
for eight environmental
impact categories in nanograms under
Terrestric Ecotox. Pot. TETP inf. the injection-molding conditions
kg DCB Equivalentof Scenario 1.
These figures clearly show that the marine aquatic ecotoxicity potential (525–586 kg) and
Ozone Depletion Pot. ODP steady state kg R11 Equivalent
abiotic depletion for fossil fuels (364–383 kg) are higher compared to other environmental
impact categories. The values of elements abiotic depletion are negligible for both plastic
Figures(0.49–0.51
products 2 and 3 present
kg). the normalized and weighted values for eight environmental
impact Figures
categories in nanograms under theand
4 and 5 show the normalized injection-molding
weighted values for conditions of Scenario 1.
the environmental
These figures
impact clearly
categories forshow that2.the
Scenario marine
These aquatic
figures clearlyecotoxicity potential
show that the (525–586 for
abiotic depletion kg) and
abiotic
fossildepletion for fossil
fuels (379–400 fuels
kg) and the(364–383 kg) arepotential
global warming higher compared to other
for 100 years environmental
(111–130 kg) are
higher
impact than otherThe
categories. environmental impact categories.
values of elements The values
abiotic depletion areofnegligible
abiotic depletion
for bothforplastic
elements are negligible
products (0.49–0.51 kg). for both plastic products (0.51–0.54 kg).
Figure 2. Environmental impact categories for Scenario 1 in the production stage with transport (functional unit: 28 kg
polypropylene product. Normalization reference: CML 2016, EU 25+3, year 2000, excl. biogenic carbon. Weighting method:
thinkstep LCIA Survey 2012, Europe, CML 2016, excl. biogenic carbon).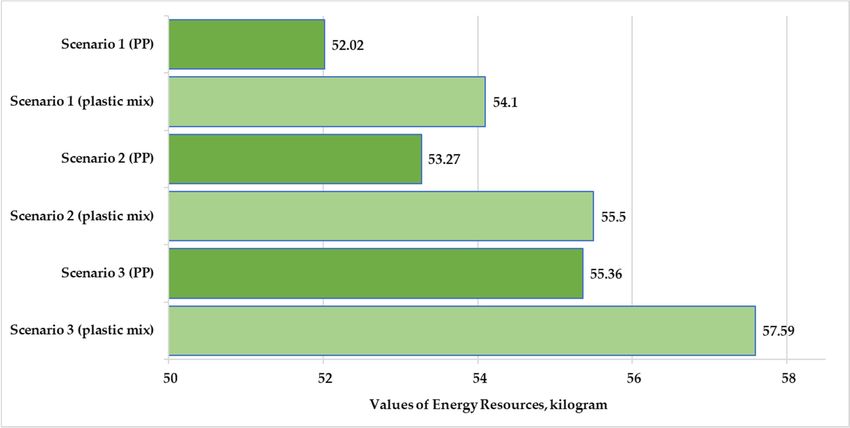
polypropylene product. Normalization reference: CML 2016, EU 25+3, year 2000, excl. biogenic carbon. Weighting method:
Polymers 2021, 13,LCIA
     thinkstep     x FORSurvey
                         PEER REVIEW
                               2012, Europe, CML 2016, excl. biogenic carbon).                                                      8 of 20

     Figure
      Polymers2. Environmental
               2021, 13, 777   impact categories for Scenario 1 in the production stage with transport (functional unit: 828
                                                                                                                           of kg
                                                                                                                              20
     polypropylene product. Normalization reference: CML 2016, EU 25+3, year 2000, excl. biogenic carbon. Weighting method:
     thinkstep LCIA Survey 2012, Europe, CML 2016, excl. biogenic carbon).

     Figure 3. Environmental impact categories for Scenario 1 in the production stage with transport (functional unit: 28 kg
     plastic mix product).

                                      Figures 4 and 5 show the normalized and weighted values for the environmental
                                 impact categories for Scenario 2. These figures clearly show that the abiotic depletion for
                                 fossil categories
     Figure 3. Environmental impact      fuels (379–400   kg) and
                                                   for Scenario  1 inthe
                                                                       theglobal warming
                                                                           production   stagepotential  for 100
                                                                                              with transport      years (111–130
                                                                                                               (functional  unit: 28 kg)
           Figure 3. Environmental impact categories for Scenario 1 in the production stage with transport (functional unit: 28 kg
                                                                                                                                     kg are
     plastic mix product).
           plastic mix product). higher than other environmental impact categories. The values of abiotic depletion for
                                 elements are negligible for both plastic products (0.51–0.54 kg).
                                       Figures 4 and 5 show the normalized and weighted values for the environmental
                                 impact categories for Scenario 2. These figures clearly show that the abiotic depletion for
                                 fossil fuels (379–400 kg) and the global warming potential for 100 years (111–130 kg) are
                                 higher than other environmental impact categories. The values of abiotic depletion for
                                 elements are negligible for both plastic products (0.51–0.54 kg).

                 Figure 4. Environmental impact categories for Scenario 2 in the production stage with transport.
                     Figure 4. Environmental impact categories for Scenario 2 in the production stage with transport.

                  Figure 4. Environmental impact categories for Scenario 2 in the production stage with transport.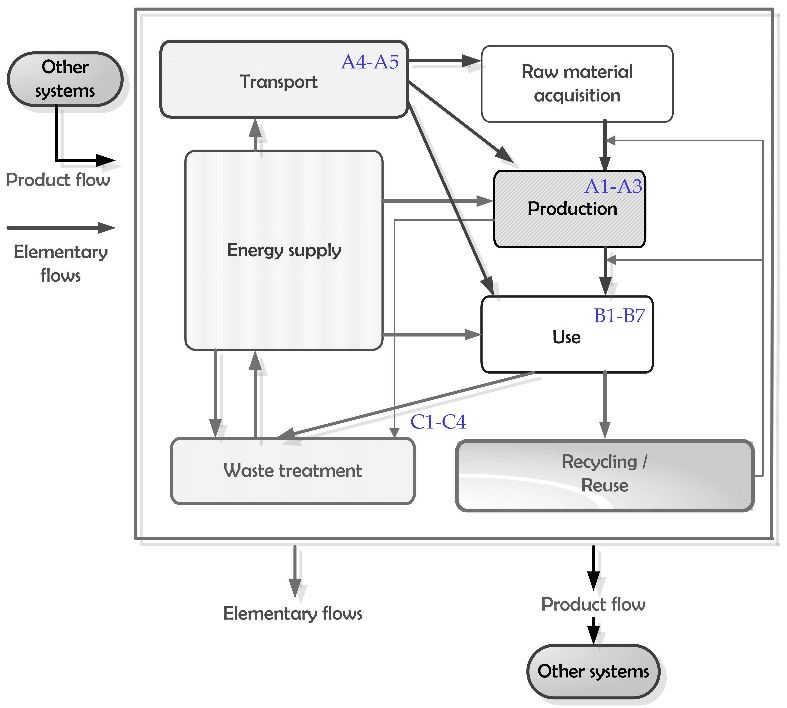
Polymers 2021, 13, 777                                                                                                              9 of 20
   Polymers 2021, 13, x FOR PEER REVIEW                                                                                                                 9 of 20

mers 2021, 13, x FOR PEER REVIEW                                                                                               9 of 20

         FigureFigure
                 5. Environmental   impact
                      5. Environmental impactcategories for   Scenario  22 in the production
                                                                                   productionstage
                                                                                               stage  with  transport   (functional unit: 28 kg
 Figure 5. Environmental  impact categories for categories
                                                Scenario 2 for Scenario
                                                            in the         in the
                                                                   production                      with
                                                                                stage with transport     transport
                                                                                                     (functional   (functional
                                                                                                                 unit: 28 kg unit: 28 kg
         mixed-plastic product).
 mixed-plastic mixed-plastic
               product).     product).

                                     Figures 6 and Figures
                                                Figures      6 and
                                                          6 and
                                                    7 illustrate      7normalized
                                                                        illustratethe
                                                                   7 illustrate
                                                                  the               the  normalized
                                                                                       normalized
                                                                                     and   weighted and andweighted
                                                                                                      values weighted     values for
                                                                                                                          values
                                                                                                                for environmental     environmental
                                                                                                                                  forim-
                                                                                                                                       environmental im-
                                              impact  categories
                                          pact categories           for  Scenario   3.  The  figures  show    that  the  marine  aquatic   ecotoxicity
                               pact categories  for Scenariofor    Scenario
                                                               3. The   figures3.show
                                                                                  The figures
                                                                                        that the show
                                                                                                  marinethat    the marine
                                                                                                           aquatic           aquatic
                                                                                                                     ecotoxicity poten-ecotoxicity poten-
                                              potential
                                          tialkg)
                                               (616–623  (616–623
                                                           kg) and  kg)   and
                                                                       abiotic abiotic  depletion   for  fossil  fuels (388–409  kg)  are higher. The
                               tial (616–623      and abiotic   depletion    fordepletion
                                                                                  fossil fuelsfor fossil fuels
                                                                                               (388–409   kg) are (388–409   kg) values
                                                                                                                    higher. The   are higher. The    values
                                              values of abiotic depletion for elements are very low (0.52–0.55 kg).
                               of abiotic of abioticfor
                                          depletion   depletion
                                                          elementsfor areelements
                                                                           very low are    very low
                                                                                      (0.52–0.55  kg). (0.52–0.55 kg).

                             Figure 6. Environmental impact categories for Scenario 3 in the production stage with transport
                Figure 6. Environmental impact categories for Scenario 3 in the production stage with transport (functional unit: 28 kg
                             (functional unit: 28 kg polypropylene product. Normalization reference: CML 2016, EU 25+3, year
                polypropylene product. Normalization reference: CML 2016, EU 25+3, year 2000, excl. biogenic carbon. Weighting method:
                             2000, excl. biogenic
                                         Figure  6.carbon. Weighting impact
                                                    Environmental     method:categories
                                                                              thinkstep LCIA Survey 2012,
                                                                                        for Scenario       Europe,
                                                                                                     3 in the      CML 2016,
                                                                                                              production  stage with transport
                thinkstep LCIA  Survey
                             excl.      2012,
                                   biogenic   Europe, CML 2016, excl. biogenic carbon).
                                            carbon).
                                          (functional unit: 28 kg polypropylene product. Normalization reference: CML 2016, EU 25+3, year
                                          2000, excl. biogenic carbon. Weighting method: thinkstep LCIA Survey 2012, Europe, CML 2016,
                                          excl. biogenic carbon).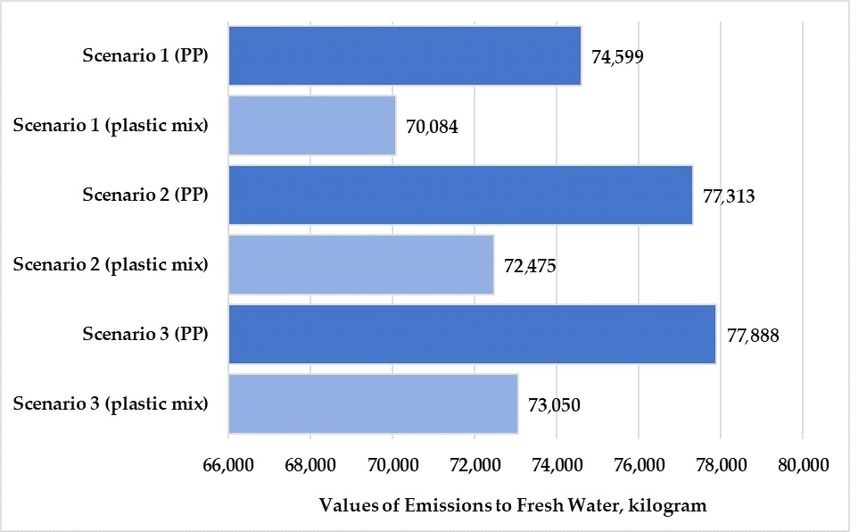
Polymers 2021, 13, 777 10 of 20
Polymers 2021, 13, x FOR PEER REVIEW 10 of 20
Figure
Figure 7.
7. Environmental
Environmental impact
impact categories
categories for
for Scenario
Scenario 33 in
in the
the production
production stage
stage with
with transport
transport (functional
(functional unit:
unit: 28
28 kg
kg
mixed-plastic product).
mixed-plastic product).
3.3.
3.3.Comprising
ComprisingofofEnvironmental
EnvironmentalImpacts
Impacts for
for Different
Different Scenarios
Scenarios
In this research study, eight environmental impacts
In this research study, eight environmental impacts and and
thethe value
value difference
difference associ-
associated
ated with the plastic products for the three different scenarios are analyzed.
with the plastic products for the three different scenarios are analyzed. Tables 2–4 describe Tables 2–4
describe the examined environmental impacts in the research analysis.
the examined environmental impacts in the research analysis. The highest environmental The highest envi-
ronmental
load comesload fromcomes from the
the granule granule production
production itself. The acidification
itself. The acidification potential
potential (AP), (AP),
photochem-
photochemical ozone creation potential (POCP), global warming potential
ical ozone creation potential (POCP), global warming potential (GWP), and eutrophication (GWP), and
eutrophication potential (EP) impact categories have a greater difference
potential (EP) impact categories have a greater difference on the life cycle assessment on the life cycle
assessment
results of the results of the
examined examined
products. In products.
summary, In wesummary,
can say is we
thatcan
the say is that
values the
of all thevalues
effect
of
categories are greater for the mixed-plastic product (the exception for Scenarios 2 for
all the effect categories are greater for the mixed-plastic product (the exception andSce-
3 is
narios 2 and
the value 3 is the value
of marine aquatic ofecotoxicity
marine aquatic ecotoxicity
potential (MAETP). potential (MAETP).
Table 2. Environmental impacts
Tablein2. the production stage
Environmental of the
impacts in plastic products for
the production Scenario
stage of the 1plastic
(functional unit:for
products 1 kg of
Scenario 1
plastic product. Normalization reference: CML 2016, EU 25+3, year 2000, excluding biogenic carbon. Weighting method:
(functional unit: 1 kg of plastic product. Normalization reference: CML 2016, EU 25+3, year 2000,
thinkstep LCIA Survey 2012, Europe, CML 2016, excluding biogenic carbon).
excluding biogenic carbon. Weighting method: thinkstep LCIA Survey 2012, Europe, CML 2016,
Impact Categories excluding biogenic carbon).
PP (ng) Plastic Mix (ng) Difference (%)
Abiotic Depletion ADP fossil 364.000 383.000 5.00
Impact Categories PP (ng) Plastic Mix (ng) Difference (%)
Acidification Potential AP 29.00 35.10 17.00
Abiotic Depletion ADP fossil 364.000 383.000 5.00
Eutrophication Potential EP 4.25 4.98 15.00
Acidification Potential AP 29.00 35.10 17.00
Global Warming Pot. GWP 100 Eutrophication
years 102.000
Potential EP 119.000
4.25 4.98 14.00 15.00
Human Toxicity Potential HTP inf.
Global Warming Pot. GWP 37.20
100 years 102.00038.90 119.000 4.00 14.00
Human
Marine A. Ecotox. Pot. MAETP inf. Toxicity 525.00 inf.
Potential HTP 37.20
586.00 38.90 10.00 4.00
Marine A. Ecotox. Pot. MAETP inf. 525.00 586.00
Photochem. Ozone Creat. Pot. POCP 50.50 63.70 21.00 10.00
Photochem. Ozone Creat. Pot. POCP 50.50 63.70 21.00
Abiotic Depletion ADP elements
Abiotic Depletion ADP0.49elements 0.49 0.51 0.51 4.00 4.00
Table 3. Environmental impacts in the production stage of the plastic products for Scenario 2 (functional unit: 1 kg of
plastic product. Normalization reference: CML 2016, EU 25+3, year 2000, excluding biogenic carbon. Weighting method:
thinkstep LCIA Survey 2012, Europe, CML 2016, excluding biogenic carbon).
Impact Categories PP (ng) Plastic Mix (ng) Difference (%)
Abiotic Depletion ADP fossil 379.000 400.000 5.00
Acidification Potential AP 21.40 27.80 23.00Polymers 2021, 13, 777 11 of 20
Table 3. Environmental impacts in the production stage of the plastic products for Scenario 2
(functional unit: 1 kg of plastic product. Normalization reference: CML 2016, EU 25+3, year 2000,
excluding biogenic carbon. Weighting method: thinkstep LCIA Survey 2012, Europe, CML 2016,
excluding biogenic carbon).
Impact Categories PP (ng) Plastic Mix (ng) Difference (%)
Abiotic Depletion ADP fossil 379.000 400.000 5.00
Acidification Potential AP 21.40 27.80 23.00
Eutrophication Potential EP 4.35 5.13 15.00
Global Warming Pot. GWP 100 years 111.000 130.000 15.00
Human Toxicity Potential HTP inf. 32.80 35.50 8.00
Marine A. Ecotox. Pot. MAETP inf. 102.00 95.90 6.00
Photochem. Ozone Creat. Pot. POCP 49.30 62.70 21.00
Abiotic Depletion ADP elements 0.51 0.54 6.00
Table 4. Environmental impacts in the production stage of the plastic products for Scenario 3
(functional unit: 1 kg of plastic product. Normalization reference: CML 2016, EU 25+3, year 2000,
excluding biogenic carbon. Weighting method: thinkstep LCIA Survey 2012, Europe, CML 2016,
excluding biogenic carbon).
Impact Categories PP (ng) Plastic Mix (ng) Difference (%)
Abiotic Depletion ADP fossil 388.000 409.000 5.00
Acidification Potential AP 30.80 37.30 18.00
Eutrophication Potential EP 4.85 5.63 14.00
Global Warming Pot. GWP 100 years 108.000 127.000 15.00
Human Toxicity Potential HTP inf. 39.70 42.40 7.00
Marine A. Ecotox. Pot. MAETP inf. 623.000 616.000 2.00
Photochem. Ozone Creat. Pot. POCP 54.70 68.10 20.00
Abiotic Depletion ADP elements 0.52 0.55 6.00
Tables 5 and 6 illustrate the values of environmental impacts associated with the
production life cycle of a 28 kg plastic product for the three examined scenarios. In
summary, the values of all the impact categories are greater for Scenario 3. The exception is
the value of global warming potential. There are basically minimal differences in the GWP
value, but they are slightly higher for Scenario 2.
Table 5. Environmental impacts of the polypropylene product for different scenarios (functional unit:
1 kg of polypropylene product. Normalization reference: CML 2016, EU 25+3, year 2000, excluding
biogenic carbon. Weighting method: thinkstep LCIA Survey 2012, Europe, CML 2016, excluding
biogenic carbon).
Environmental Impacts of PP
Scenario 1 (ng) Scenario 2 (ng) Scenario 3 (ng)
Product
Abiotic Depletion ADP fossil 364.000 379.000 388.000
Acidification Potential AP 29.00 21.40 30.80
Eutrophication Potential EP 4.25 4.35 4.85
Global Warming Pot. GWP 100 years 102.000 111.000 108.000
Human Toxicity Potential HTP inf. 37.20 32.80 39.70
Marine A. Ecotox. Pot. MAETP inf. 525.00 102.00 623.000
Photochem. Ozone Creat. Pot. POCP 50.50 49.30 54.70
Abiotic Depletion ADP elements 0.49 0.51 0.52Polymers 2021, 13, 777 12 of 20
Table 6. Environmental impacts of the mixed-plastic product for different scenarios (functional unit:
1 kg of plastic mix product. Life cycle impact assessment method: CML 2016).
Environmental Impacts of Plastic
Scenario 1 (ng) Scenario 2 (ng) Scenario 3 (ng)
Mix Product
Abiotic Depletion ADP fossil 383.000 400.000 409.000
Acidification Potential AP 35.10 27.80 37.30
Eutrophication Potential EP 4.98 5.13 5.63
Global Warming Pot. GWP 100 years 119.000 130.000 127.000
Human Toxicity Potential HTP inf. 38.90 35.50 42.40
Polymers 2021, 13, x FOR PEER REVIEW 12 of 20
Marine A. Ecotox. Pot. MAETP inf. 586.00 95.90 616.000
Photochem. Ozone Creat. Pot. POCP 63.70 62.70 68.10
Abiotic Depletion ADP elements 0.51 0.54 0.55
However, the value of all the impact categories is higher for the mixed product except
for marineHowever,
aquaticthe ecotoxicity
value of all the impact categories
(MAETP). The value is higher for the mixed
for MAETP product
is slightly except
lower for the
for marine aquatic ecotoxicity (MAETP). The value for MAETP is slightly
mixed-plastic product in Scenarios 2 and 3. If ecotoxicity is not assessed, then the highestlower for the
mixed-plastic product in Scenarios 2 and 3. If ecotoxicity is not assessed, then the highest
values are for global warming potential (GWP) and abiotic depletion for fossil fuels
values are for global warming potential (GWP) and abiotic depletion for fossil fuels (ADPF);
(ADPF); these environmental impact categories have been illustrated in nanograms. Fig-
these environmental impact categories have been illustrated in nanograms. Figure 8 shows
urethe8 shows the global
global warming warming
potential potential of polypropylene
of polypropylene and mixed-plastic and mixed-plastic
products products
for the three
for scenarios
the threeinscenarios in thestage
the production production stage with
with transport. Figure transport.
9 presentsFigure 9 presents
the abiotic thefor
depletion abiotic
depletion
the fossilfor theoffossil
fuels fuels offor
both products both
eachproducts fortheeach
scenario in scenario
production in with
stage the production
transport. In stage
withthetransport.
case of GWP, we case
In the see aof
difference
GWP, we of see
3–4%; in the case of
a difference of 3–4%;
ADPF, in there
theiscase
a difference
of ADPF, of there
is a1–1.5% for each
difference scenario.for each scenario.
of 1–1.5%
FigureFigure
8. Values of global
8. Values warming
of global warmingpotential
potentialfor
forpolypropylene andmixed-plastic
polypropylene and mixed-plastic products
products for for
the the different
different scenarios
scenarios
(functional unit: 28 kg product. Normalization reference: CML 2016, EU 25+3, year 2000, excl. biogenic carbon. Weighting
(functional unit: 28 kg product. Normalization reference: CML 2016, EU 25+3, year 2000, excl. biogenic carbon. Weighting
method: thinkstep
method: LCIA
thinkstep Survey
LCIA 2012,
Survey Europe,
2012, Europe,CML
CML2016,
2016, excl. biogeniccarbon).
excl. biogenic carbon).
In both examined production processes, except for global warming potential the val-
ues of all the impact categories are greater for Scenario 3. In this case, the plastic scrap is
traditionally deposited as plastic waste. The global warming potential value is greater for
Scenario 2, where the plastic waste is incinerated. For all the examined scenarios except
for marine aquatic ecotoxicity, the environmental impacts are greater for the mixed-plastic
product.Polymers 2021, 13, 777 13 of 20
Polymers 2021, 13, x FOR PEER REVIEW 13 of 20
Figure 9. Values of abiotic depletion for fossil fuels of polypropylene and plastic mix products for the different scenarios
Figure 9. Values of abiotic depletion for fossil fuels of polypropylene and plastic mix products for the different scenarios
(functional unit: 28 kg product. Normalization reference: CML 2016, EU 25+3, year 2000, excl. biogenic carbon. Weighting
(functional unit: 28 kg product. Normalization reference: CML 2016, EU 25+3, year 2000, excl. biogenic carbon. Weighting
method: thinkstep LCIA Survey 2012, Europe, CML 2016, excl. biogenic carbon).
method: thinkstep LCIA Survey 2012, Europe, CML 2016, excl. biogenic carbon).
3.4. Material and Energy Resources for the Different Scenarios
In both examined production processes, except for global warming potential the
values In oftheallsecond scenario,
the impact the end-of-life
categories are greaterof the
forplastic
Scenario scrap
3. was
In thismodelled
case, the with the
plastic
waste
scrap incineration
is traditionally of plastics
depositedin a asmunicipal waste incineration
plastic waste. The global plant warming in thepotential
Europeanvalue Un-
ion. In the for
is greater third scenario,
Scenario 2, the end-of-life
where of the
the plastic plastic
waste is scrap was modelled
incinerated. For all with the land-
the examined
filling
scenariosof plastics
except in foramarine
municipal landfill
aquatic plant in the
ecotoxicity, the environmental
European Union. Manyare
impacts studies
greatersum-for
marize information
the mixed-plastic product. for the waste management processes of plastic waste with a compari-
son between the different technologies available [45–48]. The conventional incineration
3.4. Material
process and Energycan
and landfilling Resources for the Different
be compared Scenarios
on the basis of their environmental impacts and
energy In efficiency. Waste-to-energy
the second scenario, (WTE)ofincineration
the end-of-life the plastic scrap plants
was are inextricably
modelled with linked
the waste to
the circular economy
incineration of plasticssystem, social harmony,
in a municipal environmental
waste incineration plantoutcomes,
in the Europeanrisk assessment,
Union. In
and energy
the third transformation
scenario, [49]. Taşkin
the end-of-life of theet plastic
al. [50] scrap
evaluatedwas three different
modelled withmunicipal solid
the landfilling
waste (MSW)
of plastics in amanagement
municipal landfillstrategies
plant with LCA
in the method Union.
European in termsManyof environment and en-
studies summarize
ergy. Dastjerdi
information foret the
al. [51]
wasteadopted the LCAprocesses
management method toof study the waste
plastic potential withof aWTE technol-
comparison
between
ogies theareas
in the different technologies
of energy recovery available [45–48]. The
and greenhouse gasconventional
emissions. Inincineration
the energy process
aspect,
itand landfillingto
is important can be compared
transform energy on from
the basis of their
residual MSW environmental
and assess the impacts and energy
potential energy
efficiency.from
recovery Waste-to-energy
waste in relation (WTE) incineration
to the plants arestrategy
circular economy inextricably linked
[49,52]. WTEtoincineration
the circular
economy
plant system, social
site selection can beharmony,
considered environmental outcomes,
as a multi-criteria risk assessment,
decision-making problemand [49].
energy
transformation
For the transportation of plastic waste, the transport distance was 100 km bywaste
[49]. Taşkin et al. [50] evaluated three different municipal solid road
(MSW)
within the management
European Union strategies
into with LCA
account. Themethod in termsand
raw materials of environment
energy streams and energy.
used de-
Dastjerdienergy
termine et al. [51] adopted the
consumption and LCA method to study
environmental impacts, the potential
so they can of WTE
affecttechnologies
the produc-
in the
tion areasand
phase of energy
life cycle recovery
of plastic and greenhouse
products. gas emissions.
Residual steam and In the energy
electrical energyaspect,
mustitbe is
important
reused in atospecially
transform energy from
designed plant.residual MSW and assess the potential energy recovery
fromMaterial
waste inresources,
relation to energy
the circular economy
resources, andstrategy
emissions [49,52]. WTE incineration
to freshwater and air are plant site
larger
selection can be considered as a multi-criteria decision-making
than other flows; therefore, these parameters were illustrated. The percentage of these pa- problem [49].
rametersFor was
the transportation
48–49% for material of plastic waste,and
resources the51%
transport distance
for emissions towas 100 km The
freshwater. by road
val-
within the European Union into account. The raw materials
ues of the other emissions examined (deposited goods, emissions to seawater, and emis- and energy streams used de-
termine
sions energy consumption
to agricultural and environmental
and industrial soil) were small impacts,
for thesothree
they scenarios
can affect examined.
the production The
percentages of emissions to sea water were 0.09–0.18%. Therefore, these flows must
phase and life cycle of plastic products. Residual steam and electrical energy are not be
reused in a specially
shown in the figures. designed plant.
Material10resources,
Figures energythe
and 11 present resources,
values of and emissions
material andto freshwater
energy and air
resources for are
the larger
three
than other flows; therefore, these parameters were illustrated.
examined scenarios in the production stage. Figures 12 and 13 show the values of The percentage of emis-
these
parameters was 48–49% for material resources and 51% for emissions to freshwater. The
sions to freshwater and air for the three examined scenarios.Polymers 2021, 13, 777 14 of 20
values of the other emissions examined (deposited goods, emissions to seawater, and
emissions to agricultural and industrial soil) were small for the three scenarios examined.
The percentages of emissions to sea water were 0.09–0.18%. Therefore, these flows are not
shown in the figures.
Figures 10 and 11 present the values of material and energy resources for the three
Polymers 2021, 13, x FOR PEER REVIEWexamined scenarios in the production stage. Figures 12 and 13 show the values of emissions
14 of 20
Polymers 2021, 13, x FOR PEER REVIEW 14 of 20
to freshwater and air for the three examined scenarios.
Figure10.
Figure Valuesofofmaterial
10.Values materialresources
resources for
for polypropylene
polypropylene and mixed-plastic
mixed-plastic products
productsfor
forthe
thedifferent
differentscenarios
scenarios(functional
(func-
Figure 10. Values of material resources for polypropylene and mixed-plastic products for the different scenarios (func-
tional
unit:unit:
28 kg28product).
kg product).
tional unit: 28 kg product).
Figure 11. Values of energy resources for polypropylene and mixed-plastic products for the different scenarios (functional
Figure 11. Values of energy resources for polypropylene and mixed-plastic products for the different scenarios (functional
Figure
unit: Values of energy resources for polypropylene and mixed-plastic products for the different scenarios (functional
11.product).
28 kg
unit: 28 kg product).
unit: 28 kg product).Polymers 2021, 13, 777 15 of 20
Polymers 2021, 13, x FOR PEER REVIEW 15 of 20
Figure 12. Values of emissions to fresh water for polypropylene and mixed-plastic products for the different scenarios
(functional unit: 28 kg product).
The highest resources and emissions to freshwater for both examined products were
observed in Scenario 3. The highest emissions to air for the plastic products were observed
in Scenario 2. The applied looping method in Scenario 1 reduced the material resources
by 4.4–4.6% and reduced the energy resources used by 6%. The looping method reduced
the emissions to fresh water by 4.1–4.2%. In relation to Figure 13, we can determine that
Figure 12. Values of emissions to fresh water for polypropylene and mixed-plastic products for the different scenarios
12. Valuesunit:
Figure(functional of emissions the
to largest change
fresh water forwas observed inand
polypropylene the air emissions. The
mixed-plastic looping
products formethod whenscenarios
the different used in
28 kg product).
(functional unit: 28 kg product). the production stage can reduce the emission to air values by 6.6% over the life cycle of
the tested products.
The highest resources and emissions to freshwater for both examined products were
observed in Scenario 3. The highest emissions to air for the plastic products were observed
in Scenario 2. The applied looping method in Scenario 1 reduced the material resources
by 4.4–4.6% and reduced the energy resources used by 6%. The looping method reduced
the emissions to fresh water by 4.1–4.2%. In relation to Figure 13, we can determine that
the largest change was observed in the air emissions. The looping method when used in
the production stage can reduce the emission to air values by 6.6% over the life cycle of
the tested products.
Figure 13. Values of emissions to air for polypropylene and mixed-plastic mix products for the different scenarios (func-
Figure 13. Values of emissions to air for polypropylene and mixed-plastic mix products for the different scenarios (functional
tional unit: 28 kg product).
unit: 28 kg product).
The highest resources and emissions to freshwater for both examined products were
observed in Scenario 3. The highest emissions to air for the plastic products were observed
in Scenario 2. The applied looping method in Scenario 1 reduced the material resources by
4.4–4.6% and reduced the energy resources used by 6%. The looping method reduced the
Figure 13. Values of emissions to air for polypropylene and mixed-plastic mix products for the different scenarios (func-
emissions to fresh water by 4.1–4.2%. In relation to Figure 13, we can determine that the
tional unit: 28 kg product).
largest change was observed in the air emissions. The looping method when used in the
production stage can reduce the emission to air values by 6.6% over the life cycle of the
tested products.
The use of pure polypropylene granules causes 6–7% higher environmental loads in
terms of material resources and freshwater emissions for all three scenarios. The use ofPolymers 2021, 13, 777 16 of 20
mixed-plastic granules causes 4% higher environmental loads in terms of energy resources
and freshwater emissions for all three scenarios. The use of mixed granules causes 13%
higher environmental loads in terms of air emissions for all scenarios.
4. Conclusions
This research study examined the manufacturing life cycle of a polypropylene product
and a mixed-plastic product, from the extraction of raw material to the injection-molding
and plastic scrap treatment processes, and attempted to determine its impact on the
environment. The life cycle assessment included a scenario analysis in the manufacturing
phase. Regarding the different scenarios, two parameters (plastic waste and cooling
water) and two products (pure polypropylene and PP-PE-PET mixed plastic product) were
examined to identify which scenario is more optimal. In the first scenario, the injection-
molding process was determined with plastic scrap and process water looping. In this case,
plastic scrap was recycled and 50% of the water from the cooling process was managed as
wastewater in a wastewater treatment plant. The second and third scenarios determined
the injection-molding process without scrap and water looping. In the second scenario,
plastic scrap went through incineration and wastewater was treated. In the third scenario,
plastic waste was deposited, and wastewater went through wastewater treatment. Thus,
the applied life cycle model was completed with wastewater treatments, plastic waste
landfilling, and waste incineration.
By quantifying the environmental impact categories of all scenarios, the CML analysis
method was applied by the GaBi 9.5 think step software. The normalization and weighting
methods were the same for all scenarios. Material and energy input-output flow from
injection-molding had a significant impact on the life cycle of the product. The functional
unit was defined as the distribution of 28 kg of polypropylene and plastic mix product
output for all stages. The lowest environmental effects of the products were recorded in
Scenario 1. In this scenario, I performed the recycling of materials (cooling water and
plastic loss) using the looping method.
According to the research results of the life cycle assessment, the looping method in
Scenario 1 reduced the values of examined impact categories by 6–7%. Examining the three
scenarios in parallel, it can be concluded that the largest value differences were found in
POCP (20–21%), AP (17–23%), GWP (14–15%), and EP (14–25%). The value of all the impact
categories was higher for the mixed-plastic product, except marine aquatic ecotoxicity. The
values of MAETP were lower for the mixed product in Scenarios 2 and 3. If we compare
Scenarios 2 and 3 for the manufacturing phase of the pure polypropylene product, it can
be said that the value of marine aquatic ecotoxicity (MAETP) was 6.1% and the value of
acidification (AP) was 1.44% higher in the case of plastic waste landfilling. Comparing
Scenarios 2 and 3 for the manufacturing phase of the mixed-plastic product, the value of
MAETP was 6.42% and the value of AP was 1.34% higher in the case of landfilling. For the
other analyzed impact categories, we obtained similar values for the pure polypropylene
and the mixed product during disposal and incineration.
The highest resources and emissions to fresh water for the plastic products were ob-
served in Scenario 3. The highest emissions to air were observed in Scenario 2. The applied
looping method reduced the material resources by 4.4–4.6% and the energy resources by
6%. The looping method reduced the emissions to fresh water by 4.1–4.2%. It could reduce
the emission to air values by 6.6% over the life cycle of the examined plastic products. In
summary, it can be stated that the largest change was observed in air emissions, and the use
of plastic mix granules caused 4% higher environmental loads in terms of energy resources
and freshwater emissions. At the same time, the use of mix granules caused 13% higher
environmental loads in terms of air emissions for all the scenarios.
From research to policymaking, the major challenge is to find the aspects that have the
greatest effect on environmental impacts, thereby fostering eco-innovation [53]. For emerg-
ing technologies and products, identifying environmental hotspots and informing decision
makers is a crucial starting point for sustainable product and process development [53,54].You can also read