A renewable pathway for decar-bonizing the electricity sector in Croatia and Slovenia
←
→
Page content transcription
If your browser does not render page correctly, please read the page content below
Report

    A renewable pathway for decar-
    bonizing the electricity sector
    in Croatia and Slovenia
    - Just Transition for an
    early coal and nuclear exit

      Authors:
      Gustav Resch, Lukas Liebmann, Jasper Geipel
      – Technische Universität Wien (TU Wien),
      Energy Economics Group

    June 2021

    Client:
…   GLOBAL 2000 - Friends of the Earth Austria

    Lead partner:
    Technische Universität Wien (TU Wien),
    Energy Economics Group
    Gusshausstraße 25-29 / 370-3, A-1040 Vienna, Austria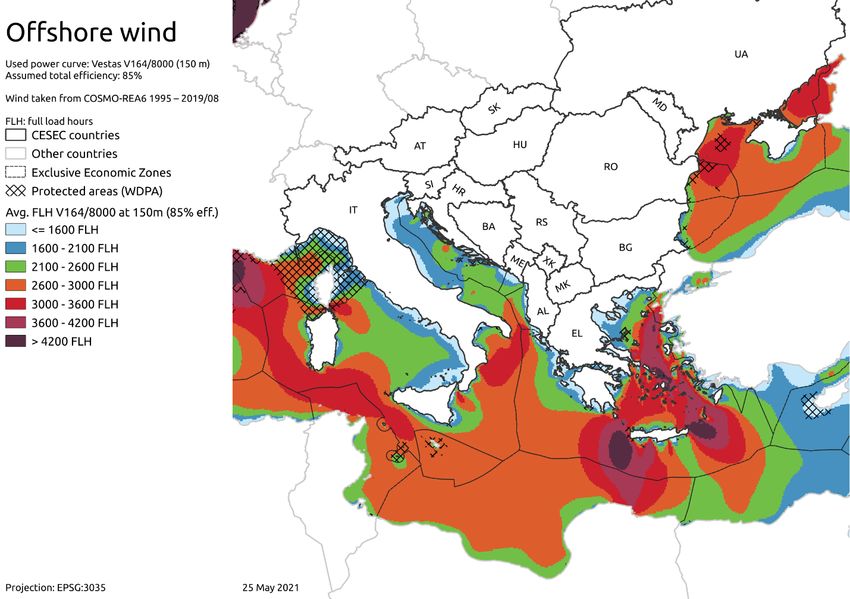
A renewable pathway for decarbonizing the electricity sector in Croatia and Slovenia
– Just Transition for an early coal and nuclear exit

      The study
      A renewable pathway for decarbonizing the electricity sector in Croatia and Slovenia
      – Just Transition for an early coal and nuclear exit

         Duration:               April 2021 – June 2021

         Client:                 GLOBAL 2000 - Friends of the Earth Austria

       This report sheds light on an alternative pathway for a just transition of the electricity
       sector of both countries, relying on a transition towards renewable energy forms as al-
       ternative to coal and nuclear. The aim of this report is to illustrate and describe how
       this alternative pathway may look like.
       We inform on the sector transition, indicating technology trends of the so-called “Just
       Transition” scenario in comparison to a reference path where nuclear and coal main-
       tain their dominance. The report also discusses how the electricity sector transition
       may affect the achievement of energy and climate commitments and informs on in-
       vestment and cost impacts.

       Authors:
       Gustav Resch, Lukas Liebmann, Jasper Geipel
       – Technische Universität Wien (TU Wien), Energy Economics Group

                                                          Contact details:
                                                          Gustav Resch
                                                          TU Wien, Institute of Energy Systems and Electrical Drives,
                                                          Energy Economics Group (EEG)
                                                          Address: Gusshausstrasse 25/370-3,
                                                          A-1040 Vienna, Austria
                                                          Phone: +43 1 58801 370354
                                                          Fax: +43 1 58801 370397
                                                          Email: resch@eeg.tuwien.ac.at
                                                          Web: www.eeg.tuwien.ac.at

Acknowledgement:                                           Legal Notice:
The authors and the whole project consortium grate-        The sole responsibility for the content of this publication lies
fully acknowledge the financial and intellectual sup-      with the authors. It does not necessarily reflect the opinion
port of this work provided by Global 2000 / Friends of     of the client.
the Earth.                                                 All rights reserved; no part of this publication may be trans-
                                                           lated, reproduced, stored in a retrieval system, or transmit-
                                                           ted in any form or by any means, electronic, mechanical,
                                                           photocopying, recording or otherwise, without the written
                                                           permission of the publisher.
                                                           Many of the designations used by manufacturers and sellers
                                                           to distinguish their products are claimed as trademarks. The
                                                           quotation of those designations in whatever way does not
                                                           imply the conclusion that the use of those designations is le-
                                                           gal without the content of the owner of the trademark.
A renewable pathway for decarbonizing the electricity sector in Croatia and Slovenia
– Just Transition for an early coal and nuclear exit

Table of contents
1      Introduction ..................................................................................................................................... 4
    1.1    Structure of this report................................................................................................................................................ 4

2      Approach and key assumptions ....................................................................................................... 5
    2.1    The applied modelling system ..................................................................................................................................... 5
    2.2    Assessed scenarios and key assumptions .................................................................................................................... 6

3      Status quo of the electricity sector in Croatia and Slovenia ........................................................... 8

4      Renewable Energy Sources – a closer look at available potentials in Croatia and Slovenia ........... 9

5 Just Transition: a renewable pathway for decarbonising the Croatian and Slovenian electricity
sector ..................................................................................................................................................... 12
    5.1    Recap on 2030 RES targets ........................................................................................................................................ 12
    5.2    The future uptake of renewables in the electricity sector ........................................................................................ 14
       5.2.1            Spotlight on Croatia and Slovenia: Changing the electricity mix ..................................................................................... 14
    5.3    Power System Analysis: Feasibility check for 2030 ................................................................................................... 19
    5.4    RES-related costs and expenditures: Investment needs and support expenditures ................................................ 23

6      Summary of key findings ................................................................................................................ 25

7      References ..................................................................................................................................... 28

                                                                                   Page 3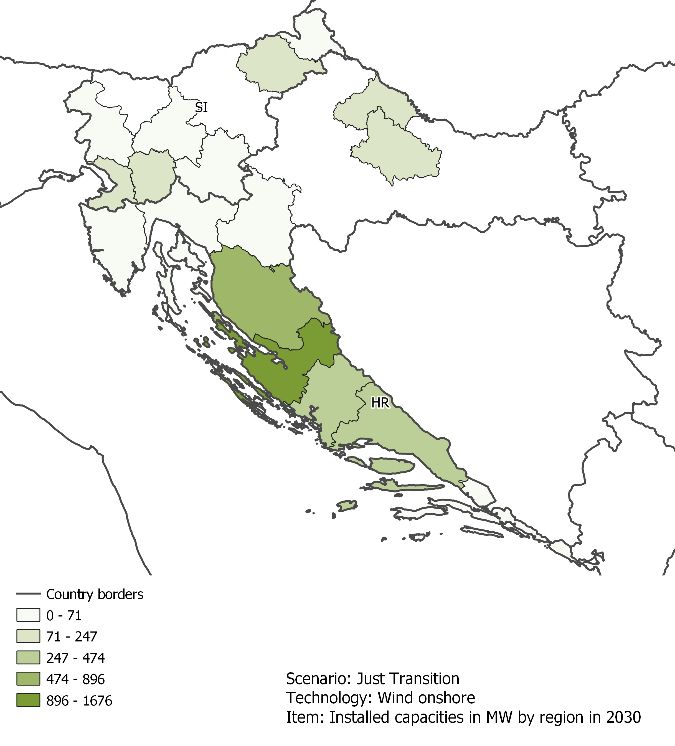
A renewable pathway for decarbonizing the electricity sector in Croatia and Slovenia
– Just Transition for an early coal and nuclear exit

1          Introduction
In light of the ambitious targets of the Paris Agreement and highly ambitious long-term decarbonisation goals
set by the European Green Deal, a critical question for decision-makers is how to sustain a coal and lignite phase-
out that is as swift as possible while also ensuring supply of affordable electricity, and a just transition in regions
dependent on coal. Within Slovenia and Croatia electricity generation from nuclear power is often seen as a
carbon-free alternative – but concerns on a safe and reliable operation of the nuclear power plant built at Krško
question this generation asset and also the plans for a newly built second nuclear unit at the Krško site which
may imply considerable cost (cf. Hinkley Point C, etc.).

This brief report sheds light on an alternative pathway for a just transition of the electricity sector of both coun-
tries, relying on a transition towards renewable energy forms as alternative to coal and nuclear. The aim of this
report is to illustrate and describe how this alternative pathway may look like. We inform on the sector transition,
indicating technology trends of the so-called “Just Transition” scenario in comparison to a reference path where
nuclear and coal maintain their dominance. The report also discusses how the electricity sector transition may
affect the achievement of energy and climate commitments and informs on investment and cost impacts.

1.1        Structure of this report
The structure of this brief report is as follows: Subsequently within chapter 2 we describe the approach taken
and the key assumptions for the underlying analysis and modelling. Then chapter 3 is dedicated to inform on
historic trends and the status quo of electricity demand and supply within Croatia and Slovenia, indicating the
role of renewables as well as of coal and nuclear power for meeting the power needs in both countries. Chapter
4 introduces the available renewable energy sources within the region that may play a key role in the electricity
sector in future, indicating the resource potentials at technology level. Next to that, chapter 5 describes the
derived “Just Transition” pathway for a sector transition towards renewables. The description starts with a brief
recap on energy and climate targets for 2030 that Member States (MS) of the European Union (EU) need to
respect whereas all subsequent subsections are dedicated to introduce the transition scenario derived for both
countries in further detail. That involves to analyse the anticipated change in the technology mix by assessing
generation and capacity trends. Key results from the complementary power system analysis done for 2030 are
also presented, serving as feasibility check that the electricity market can cope with rapid RES expansion. A closer
look at impacts on CO2 emissions related to electricity supply and on cost impacts conclude the assessment. The
report concludes with a summary of key findings and recommendations on the way forward, cf. chapter 6.

                                                       Page 4
A renewable pathway for decarbonizing the electricity sector in Croatia and Slovenia
– Just Transition for an early coal and nuclear exit

2         Approach and key assumptions

2.1       The applied modelling system
This analysis builds on modelling works undertaken by the use of TU Wien’s Green-X model, a specialised energy
system model with a sound incorporation of various RES policy approaches, closely linked to the complementary
power system model Balmorel. A brief characterisation of both models is given in Box 1 below.

More precisely, Green-X delivers a first picture of future RES developments under distinct energy policy trends
and cost assumptions, indicating details on technology trends (investments, installed capacities and generation)
and the geographical distribution of RES deployment as well as related costs (generation cost) and expenditures
(capital, operation and support expenditures). For assessing the interplay between RES and the future electricity
market, Green-X was complemented by its power-system companion, i.e. the Balmorel model. Thanks to a higher
intertemporal resolution than in the RES investment model Green-X, Balmorel enables a deeper analysis of the
electricity market integration of renewables, shedding light on the interplay between supply, demand and stor-
age in the electricity sector.
Box 1:Brief characterisation of the applied modelling system (Green-X in combination with Balmorel)

          Green-X is an energy system model, developed by TU Wien, that offers a detailed representation of the poten-
          tials and the related technologies of various renewable energy sources (RES) in Europe and in neighbouring
          countries, including all EU Member States and all Contracting Parties of the Energy Community. It aims at indi-
          cating consequences of RES policy choices in a real-world energy policy context. The model simulates technol-
          ogy-specific RES deployment by country on a yearly basis, in the time span up to 2050, taking into account the
          impact of dedicated support schemes as well as economic and non-economic framework conditions (e.g. regu-
          latory and societal constraints). Moreover, the model allows for an appropriate representation of financing con-
          ditions and of the related impact on investor’s risk. This, in turn, allows conducting in-depth analyses of future
          RES deployment and corresponding costs, expenditures and benefits arising from the preconditioned policy
          choices on country, sector and technology level.

          Balmorel (the BALtic Model for Regional Electricity Liberalisation) is an open-source partial equilibrium model,
          analysing the electricity and combined heat and power sector on various geographic levels. The analysis of fur-
          ther sectors via sector coupling (e.g. e-mobility, individual heating) is also possible via model add-ons. The model
          was originally developed by DTU and is now used and further developed by a wide range of institutions within
          Europe and worldwide, including TU Wien who is conducting also recent extensions in the course of this project.
          Balmorel is a deterministic bottom-up energy system model that is able to co-optimize energy dispatch and
          investments via linear (and for some applications mixed-integer) programming. For this, equations on electricity
          and district heat balance, capacity and energy constraints, production of dispatchable and non-dispatchable
          units, operational constraints, storage operation, transmission constraints, emission caps, and several more are
          considered. As a result, the model delivers energy conversion characteristics, fuel consumption, electricity ex-
          ports and imports, emissions, investments in plants and transmission lines, prices on traded energy, and total
          system costs.

Figure 1 gives an overview on the interplay of both types of models. All models are operated with the same set
of general input parameters, however in different spatial and temporal resolution. Green-X delivers a first picture
of renewables deployment and related costs, expenditures and benefits by country on a yearly basis (2010 to
2030 and beyond). The output of Green-X in terms of country- and technology-specific RES capacities and gen-
eration in the electricity sector for selected years serves as input for the power-system analysis done with Bal-
morel. Subsequently, the applied power system model analyses the interplay between supply, demand, and stor-
age in the electricity sector on an hourly basis for the given years. The output of the power system model is then
fed back into the RES investment model Green-X. In particular, the feedback comprises the amount of RES that
can be integrated into the grids, the electricity prices, and corresponding market revenues (i.e. market values of

                                                          Page 5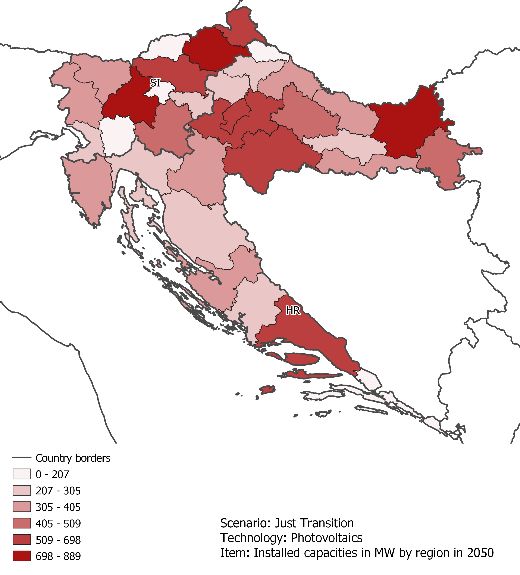
A renewable pathway for decarbonizing the electricity sector in Croatia and Slovenia
– Just Transition for an early coal and nuclear exit

the electricity produced by variable and dispatchable RES-E) of all assessed RES-E technologies for each assessed
country.

Figure 1:        Model coupling between Green-X (energy policy analysis) and Balmorel (power system analysis) for
                 an assessment of RES developments in the electricity sector. (Source: own development)

                               RES capacities and
                              RES cost (investment,
                                    support)

        Green-X                                          Balmorel

                               Electricity prices,
                              RES market values,
                               RES curtailment
 RES investment model,
                                                      Electricity system model,
  detailed energy policy
                                                        Power plant dispatch
     representation

2.2              Assessed scenarios and key assumptions
The modelling undertaken in the course of this assessment serves to conduct a feasibility check of an alternative
pathway for a just transition of the electricity sector in Croatia and Slovenia, indicating the perspectives for an
early coal and nuclear exit in both countries. Since national electricity markets across Europe are closely inter-
linked, the whole analysis is undertaken at a European scale, by analysing the electricity sector transformation
towards 2030 and beyond (2050) as well as the interplay of supply, demand and storage within the electricity
sector of all EU Member States.

Two scenarios are in focus:

    •       On the one hand, modelling allows for identifying the needs arising from the European Green Deal for
            a stronger increase of RES overall in accordance with a strengthening of the climate ambition for 2030
            and a full decarbonisation of the electricity sector (and the overall economy) by 2050. In our brief anal-
            ysis undertaken within the course of this study we focus on assessing the contribution of RES electricity
            to that (Just Transition scenario). That scenario relies specifically for both target countries (Croatia and
            Slovenia) on a transition towards renewable energy forms as alternative to coal and nuclear which are
            assumed to be phased-out in the mid of this decade from the Croatian and Slovenian electricity sector.
    •       As reference we derived a second scenario where the planned RES uptake within the electricity sector
            of all EU Member States, including Croatia and Slovenia, was set in accordance with current national
            planning as postulated in National Energy and Climate Plans (NECPs) (Reference scenario), cf. (EC,
            2020a).

Generally, a least-cost approach is followed for allocating RES investments post 2020 cost-effectively across
technologies (and partly also geographically across the whole EU): The model-based selection of RES technolo-
gies in the period post 2020 follows within all assessed scenarios a least-cost approach, meaning that all addi-
tionally required future RES technology options are ranked in a merit-order, and it is left to the economic viability
which options are chosen for meeting the presumed 2030 RES target. In other words, a least-cost approach is
used to determine investments in RES technologies post 2020 across the EU. This allows for a full reflection of
competition across technologies and to a limited extent also across countries from a European perspective. For

                                                         Page 6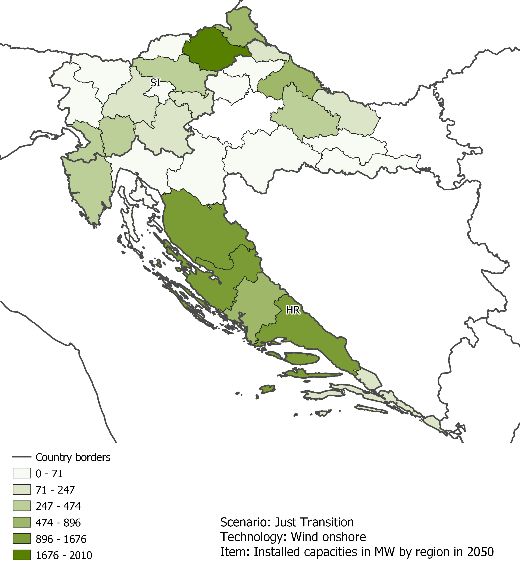
A renewable pathway for decarbonizing the electricity sector in Croatia and Slovenia
– Just Transition for an early coal and nuclear exit

the reference scenario we deviate from this general concept specifically for Slovenia and Croatia: here technol-
ogy-specific RES use in the electricity was stronger aligned to the RES use stated in their NECPs.

Key assumptions on future energy price and carbon price trends were set in accordance with recent European
modelling activities published by the European Commission, specifically the Climate Target Plan of the European
Commission and the MIXED scenario published therein (EC, 2020b and EC, 2020c). That implies for example a
carbon price of 44 €/tCO2 by 2030 under both scenario.

The future development of electricity consumption was set in accordance with NECPs for the reference scenario
whereas in the Just Transition scenario in the long-term (i.e. by 2050) an around 50% higher electricity demand
(compared to reference) was presumed, driven by increases in sector coupling in accordance with decarbonisa-
tion needs.

                                                    Page 7
A renewable pathway for decarbonizing the electricity sector in Croatia and Slovenia
– Just Transition for an early coal and nuclear exit

3          Status quo of the electricity sector
           in Croatia and Slovenia
This chapter is dedicated to provide a brief overview on historic trends and on the status quo of electricity de-
mand and supply within Croatia and Slovenia, indicating the role of renewables as well as of coal and nuclear
power for meeting the power needs in both countries.

In this context, Table 1 provides a concise overview on historic trends in electricity consumption and fuel-specific
supply in Croatia (left) and Slovenia (right).

As applicable from this table, renewables have already been in 2005 the largest contributor to meet domestic
electricity demand in Croatia, accounting for a demand share of 41% by that point in time according to actual
generation, or of 35% if normalised (hydro) production is taken into consideration. The normalised RES share has
been steadily growing since then, achieving around 50% in 2019. Hydropower dominates renewable power sup-
ply but recent growth is caused by a rapid increase of wind onshore and to a smaller extent by the increase in
bioenergy use. The share of fossil fuels has declined in turn, i.e. from 34% in 2005 to 23% in 2019, and also the
underlying fossil fuel mix changed significantly: Croatia has managed to phase-out the use of oil and petroleum
products and also coal use, accounted under solid fossil fuels in Table 1, has declined since then from 13% (2005)
to 9% (2019) when measuring the coal share in relation to domestic gross electricity demand. As of today (2019),
natural gas dominates fossil fuel supply in the Croatian electricity sector, achieving as demand share of 14% in
2019.

Table 1:      Historic trends in electricity consumption and supply (by fuel) in Croatia and Slovenia
              (Source: Eurostat, 2021a and Eurostat, 2021b)
Historic trends in electricity                   Croatia                                  Slovenia
demand and supply in TWh
                                     2005      2010        2015     2019      2005      2010      2015      2019
Gross electricity demand             17.5      18.8      18.0      18.8       14.8      14.1      14.8      15.6
RES generation (normalised)            6.1       7.0       8.2       9.4        4.2       4.6       4.8       5.1
RES share (in % of consumption)     35.2%     37.5%     45.4%     49.8%      28.7%     32.2%     32.7%     32.6%
Gross electricity generation         13.2       14.9       11.4     12.8      15.1       16.4      15.1      16.1
Net import                            4.3        3.9        6.6      6.0      -0.3       -2.3      -0.3      -0.5
RES generation (actual)               7.2        9.4        7.7      8.5       3.6        4.9       4.6       5.2
Solid fossil fuels                    2.3        2.4        2.3      1.6       5.3        5.3       4.4       4.5
of which lignite                      0.0        0.0        0.0      0.0       4.8        4.8       4.0       4.2
Natural gas                           1.8        2.6        1.2      2.6       0.3        0.5       0.4       0.5
Oil and petroleum products            1.9        0.6        0.2      0.0       0.0        0.0       0.0       0.0
Nuclear                               0.0        0.0        0.0      0.0       5.9        5.7       5.6       5.8

A slower transformation of the electricity sector has taken place in Slovenia. Similar to Croatia, also in Slovenia
an increase of the use of renewables is applicable, but the uptake from 29% (2005) to 33% (2019) when compar-
ing normalised RES generation with domestic electricity demand is less pronounced than in Croatia. Renewable
supply is dominated by hydropower where also throughout the last decade a strong increase has been achieved.
On second place follows photovoltaics (PV), and on third bioenergy.

Electricity supply in Slovenia is currently dominated by nuclear power, contributing 37% in 2019 to meet domes-
tic demand, followed by renewables as discussed above. The share of solid fossil fuels (lignite and coal) has been
slowly declining in the period 2005 to 2019, i.e. from 36% in 2005 to 29% in 2019 when comparing supply with
demand. Thus, as applicable from Table 1, as of today (2019) lignite and to a minor extent coal still play an im-
portant role in Slovenian power supply.

                                                       Page 8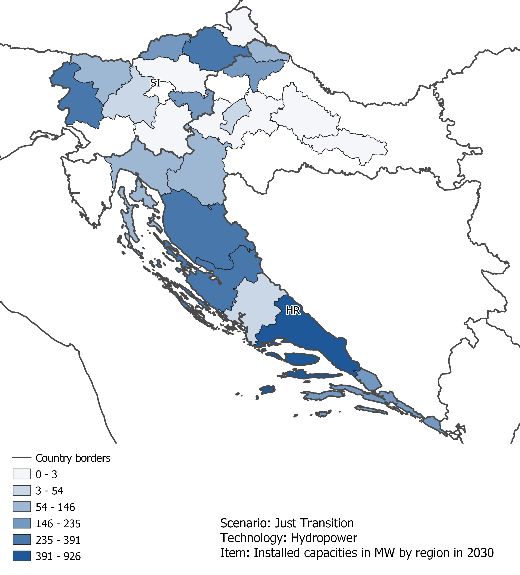
A renewable pathway for decarbonizing the electricity sector in Croatia and Slovenia
– Just Transition for an early coal and nuclear exit
4 Renewable Energy Sources – a closer look at
available potentials in Croatia and Slovenia
This section provides a concise overview on the potentials of renewable energy sources applicable in both coun-
tries in focus. In this context, Table 2 provides a concise overview on domestic potentials for electricity genera-
tion from RES in Croatia (left) and Slovenia (right). This table combines information gained from an intense liter-
ature review performed in an ongoing EU study (cf. Resch et al. (2021)) with the outcomes of an own GIS-based
analysis of the available resources across European countries. The latter has been conducted for wind energy
and solar electricity (photovoltaics) using meteorological data and land use datasets at a high geographical and
temporal resolution. For both on- and offshore as well as for PV land use restrictions were incorporated into the
analysis in order to identify cost-effective generation sites that could be exploited in future years. The incorpo-
ration of restrictions implied for example to exclude environmental protection areas and to consider distance
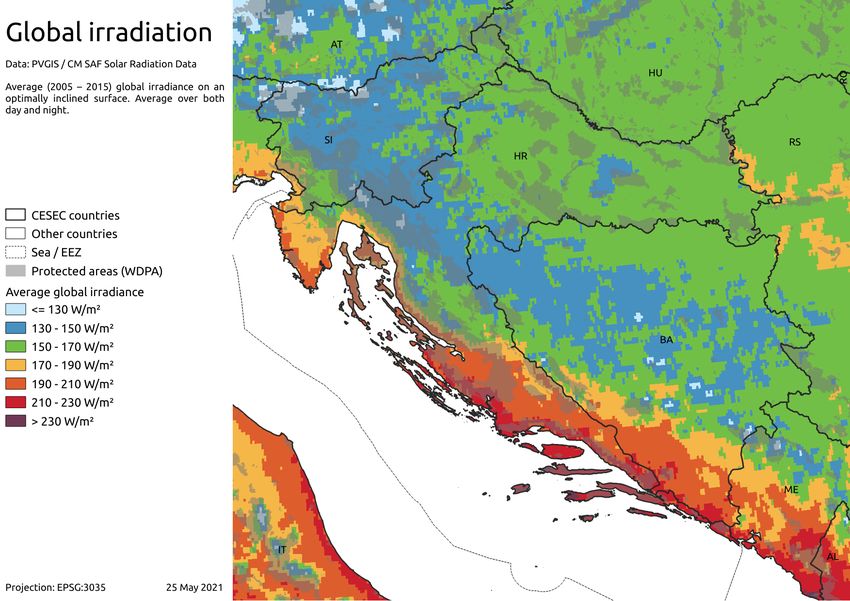
rules to the built environment in the case of onshore wind. Complementary to Table 2, a graphical illustration of
the outcomes of the GIS-based assessment is provided by Figure 2 for solar PV, showing a map for global solar
irradiation, and by Figure 3 for onshore wind, indicating site conditions for those areas where wind energy can
be used under the incorporated land use restrictions. Figure 4 complements the above with a map for offshore
wind use in the whole of Southern and Eastern Europe.
Table 2: Domestic potentials for electricity generation from RES in Croatia and Slovenia
(Source: Eurostat (2019a) and own assessment, based on DLR (2006), Heaps (2009), IRENA (2017)
and Neubarth (2018))
Croatia Slovenia
Potentials for Literature survey on Literature survey on
electricity generation technical/economic
Historic Own GIS- Historic technical/economic Own GIS-
from RES (in GWh) use potentials based as- use potentials based as-
(2019) Min Max sessment (2019) Min Max sessment
Bioenergy 970 340 5,743 246 84 1,420
Geothermal 0 450 0 540
Hydropower 6,897 8,919 12,000 4,528 5,148 9,000
Photovoltaics 83 4,355 4,356 22,997 303 447 1,459 6,582
Wind onshore 1403 2,600 29,153 54,837 6 300 2,273 10,275
Wind offshore 0 n.a. n.a. ca. 900 0 n.a. n.a. n.a.
As outlined in chapter 2, historically hydropower has been the dominant renewable energy source in the elec-
tricity sector of both Croatia and Slovenia but here the future uptake appears limited considering available po-
tentials (cf. Table 2) and environmental concerns. In contrast to hydropower, significant future potentials are
applicable for PV and wind onshore. Here the outcomes of our own GIS based analysis point out that available
domestic resources would allow for meeting and exceeding current electricity needs of both Croatia and Slove-
nia. Summing up the identified technical potentials of both countries together corresponds to an annual gener-
ation volume that is almost three times as high a current electricity demand. Due to the country size and the
topographical location potentials for both PV and wind onshore are however significantly higher in Croatia than
in Slovenia. As shown in Table 2, apart from solar and wind also bioenergy offers techno-economic potentials at
a relevant magnitude that may help to balance the weather-dependent variable electricity supply from hydro,
wind and PV.
Page 9
A renewable pathway for decarbonizing the electricity sector in Croatia and Slovenia
– Just Transition for an early coal and nuclear exit

Figure 2:    Map of solar (global) irradiation in Croatia and Slovenia, indicating site conditions for photovoltaics
             (Source: own assessment)

Figure 3:    Wind map of Croatia and Slovenia, indicating site conditions (full load hours) for wind onshore
             (Source: own assessment)

                                                     Page 10
A renewable pathway for decarbonizing the electricity sector in Croatia and Slovenia
– Just Transition for an early coal and nuclear exit
Figure 4: Wind map of sea areas in Southern Europe, indicating site conditions (full load hours) for wind off-
shore (Source: own assessment)
Page 11A renewable pathway for decarbonizing the electricity sector in Croatia and Slovenia
– Just Transition for an early coal and nuclear exit
5 Just Transition: a renewable pathway for decar-
bonising the Croatian and Slovenian electricity
sector
This chapter sheds light on the outcomes of our brief model-based assessment for a decarbonization of the Cro-
atian and Slovenian electricity sector. As outlined in detail in chapter 2, two complementary models were used
to assess energy policy needs and impacts (Green-X) and to conduct a techno-economic feasibility check from a
power system point of view (Balmorel). The modelling undertaken served to derive an alternative pathway for a
just transition of the electricity sector in Croatia and Slovenia via an enhanced use of renewable energy sources
(Just Transition scenario), indicating the perspectives for an early coal and nuclear exit in both countries. A Ref-
erence scenario that builds on current energy and climate planning within Croatia and Slovenia, where coal and
nuclear maintain their dominance, helps to contrast the outcomes of the derived Just Transition scenario. Since
national electricity markets across Europe are closely interlinked, the whole analysis was undertaken at a Euro-
pean scale, by analysing the electricity sector transformation towards 2030 and beyond (2050) as well as the
interplay of supply, demand and storage within the electricity sector of all EU Member States.
Below we start with a brief recap on 2030 RES targets for the whole EU and its Member States. Next to that the
uptake of renewables in the electricity sector is discussed, putting Croatia and Slovenia into the spotlight. In
subsequence, key aspects of an enhanced RES market integration are then illustrated, assessing the interplay
between supply, demand and storage in the electricity market at a high temporal resolution.
5.1 Recap on 2030 RES targets
The role of RES in National Energy and Climate Plans
Figure 5: 2020 RES targets vs. 2030 RES shares by EU MS according to NECPs (Target Scenario)
(Source: NECPs and own analysis)
2030 RES shares by MS: NECP ambitions vs 2020 RED targets
2020 RED targets NECP ambitions 2030
80%
75%
65,0%
70%
65%
55,0%
54,0%
60%
50,0%
55%
47,0%
49%
46,0%
45,0%
50%
42,0%
42,0%
40%
45%
36,4%
38%
35,0%
34,1%
33,6%
33,0%
40%
34%
30,7%
30,7%
30,0%
31%
30%
27,1%
35%
27,0%
27,0%
25,0%
23,0%
23,0%
25%
25%
30%
22,0%
24%
21,0%
23%
23%
19,2%
17,5%
20%
20%
20%
25%
18%
18%
17%
16%
16%
15%
20%
11,5%
14%
14%
13%
13%
13%
13%
11%
10%
15%
10%
5%
0%
Throughout the last years, EU MSs have agreed upon 2030 energy and climate targets. In the field of renewables
the current framework implies at EU level an increase of the RES share from 20% by 2020, as set by the original
RED (EU, 2009), to (at least) 32% by 2030, in accordance with the recast of the RED (EU, 2018a). In order to
facilitate this energy transition, EU MSs had to provide National Energy and Climate Plans (NECPs) by the end of
Page 12A renewable pathway for decarbonizing the electricity sector in Croatia and Slovenia
– Just Transition for an early coal and nuclear exit
2019, indicating how to contribute to the overall 2030 EU energy and climate targets. Thus, MSs have to increase
their RES shares (well) above their 2020 RES targets in order to contribute to the overall EU RES target of (at
least) 32% by 2030, and, as applicable from Figure 5, they are aware of that: Summing up the nationally planned
RES shares (and where reported demand projections) for 2030 leads to an EU RES share of approx. 33.6%. The
RES ambition however differs to a large extent across MSs: at the lower end, MSs like Malta, Slovenia, Belgium
and Slovakia plan for increasing their RES share until 2030 less than 6 percentage points compared to their 2020
RES target, which is less than half of the RES share increase imposed at EU level during the same period in time.
At the upper end, Denmark, Lithuania, Spain and Ireland aim for increasing their RES share until 2030 by more
than 18 percentage points which is well above the EU RES share increase (12 percentage points) agreed upon.
The necessary increase of the RES ambition in accordance with the European
Green Deal
The EU Green Deal and the corresponding increase in the 2030 climate ambition (approximately 55% instead of
40% GHG reduction) raises the need for a stronger uptake of renewables. Within the underlying model-based
analysis the assumption was taken that the EU 2030 RES target would consequently be increased from (at least)
32% to (at least) 40%. Subsequently, a fair effort sharing across MSs was calculated, expressing national contri-
butions for the EU RES target in accordance with an approach for doing so as described in the EU Governance
Directive (EU, 2018b) 1, cf. Figure 6. Except for Spain where national planning shows a higher RES ambition, this
implies in general a strong increase of the RES ambition in the forthcoming decade. Following that approach
would imply highest increases of the 2030 RES share (above 10 percentage points) for Slovenia, Malta, Belgium,
Austria, Slovenia, Latvia, Hungary, Sweden and Slovakia, whereas a comparatively small increase (below 3 per-
centage points) would result for Greece, Denmark and Croatia.
Figure 6: 2030 RES shares by EU MS according to NECP planning (Reference Scenario) vs Green Deal needs
(Just Transition scenario)
(Source: NECPs and own analysis)
2030 RES shares by MS: NECP ambitions vs Green Deal needs
NECP ambitions 2030 Green Deal
75,9%
80%
75%
70% 65,0%
61,2%
59,7%
58,4%
65%
57,7%
55,0%
54,0%
60%
52,8%
52,7%
51,0%
50,0%
48,7%
55%
47,0%
46,0%
45,0%
50%
42,0%
42,0%
42,0%
41,5%
40,0%
39,3%
38,9%
38,5%
45%
37,4%
37,2%
36,4%
35,1%
35,0%
34,1%
33,7%
33,6%
33,0%
40%
32,7%
31,6%
31,0%
31,0%
30,8%
30,7%
30,7%
30,7%
30,6%
30,0%
28,9%
35%
27,1%
27,0%
27,0%
25,0%
24,7%
23,0%
23,0%
30%
22,0%
21,0%
19,2%
25%
17,5%
20%
11,5%
15%
10%
5%
0%
1 The question arose how to distribute the increased overall RES effort at EU level across individual MSs. Annex II of the EU
Governance Directive (EU, 2018b) introduces for that purpose a methodology for establishing benchmarks concerning the
national contributions for the RES share in gross final energy consumption in the 2030 context at EU level. This approach
follows an integrated concept that takes into account the differences in economic development, the potential for cost-effec-
tive RES deployment and the interconnection level in the European Network of Transmission System Operators for Electricity
(ENTSO-E) across the EU and its MSs, respectively.
Page 13A renewable pathway for decarbonizing the electricity sector in Croatia and Slovenia
– Just Transition for an early coal and nuclear exit
5.2 The future uptake of renewables in the electricity sector
This section sheds light on the future RES uptake proclaimed for the electricity sector in Croatia, Slovenia and the
remainder of the European Union. Here modelling provides a sound basis for that since derived pathways of RES
deployment provide, on the one hand, insights on the planned RES uptake within the electricity sector in accord-
ance with NECP planning (Reference scenario). On the other hand, modelling also allows for identifying the needs
arising from the Green Deal for a stronger increase of RES overall, and on the contribution of RES electricity to
that (Just Transition scenario). For Croatia and Slovenia that goes hand in hand with the presumed phase-out of
coal and nuclear during this decade.
A closer look at the EU level
Before digging into details for the countries in focus within this study, a closer look is taken at the RES uptake in
the EU electricity market.
Key results derived from this analysis are:
• At EU level we see a moderate RES uptake in the electricity sector if NECP planning is considered
(57% RES-E share 2030 according to the Reference scenario), and
• a strong increase of RES deployment in the electricity sector if the Green Deal perspective is followed
(ca. 66% by 2030 in accordance with the Just Transition scenario);
• New RES installations within this decade (up to 2030) will by 2030 have to provide slightly less than half
of total electricity generation from RES (i.e. 46% of total) under NECP planning. The required contribu-
tion of new installations has to increase to 55% of the total RES-E volumes considering Green Deal needs.
5.2.1 Spotlight on Croatia and Slovenia: Changing the electricity mix
Within Croatia and Slovenia renewables are already at present a key contributor to meet the demand for elec-
tricity. According to latest statistical data available (Eurostat, 2021a), RES achieved a share of ca. 50% in gross
electricity demand by 2019 in Croatia, and the RES demand share in Slovenia was 33% (2019). Historically, the
RES share was steadily growing over the past decade, with differences across both countries, cf. chapter 3. This
growth needs to be accelerated in future years, given the policy commitments taken and the needs arising from
a transformation of the energy sector in order to combat climate change while phasing out coal and nuclear.
Electricity generation and corresponding
RES share in gross electricity demand
As a starting point for our analysis of the future uptake of renewables in the Croatian and Slovenian electricity
sector, Figure 7 shows the development of the country-specific RES shares in gross electricity demand in the
period up to 2050 according to derived scenarios (Just Transition and Reference). Apart from depicting our own
modelling results Figure 7 also offers a comparison to NECP planning, indicating the targeted RES-E share for
2030; as well as to other modelling works in this topical context, indicating 2030 RES shares according to a recent
study published by the International Renewable Energy Agency (IRENA) on “Renewable Energy Prospects for
CESEC” (IRENA, 2020). As applicable from Figure 7, according to NECPs (Reference scenario) a steady growth of
RES is planned in future years in Croatia and Slovenia. That would allow Croatia to increase its RES share from
50% (2019) to 64% by 2030, and, assuming that the underlying policy ambition remains constant in the period
post 2030, to ca. 83% by 2050. National planning (Reference scenario) indicates for Slovenia a moderate increase
of the RES share from 33% (2019) to 43% by 2030, and a RES share of 55% by 2050 (assuming the RES policy
ambition is maintained post 2030). A more proactive approach is followed in the Just Transition scenario,
Page 14A renewable pathway for decarbonizing the electricity sector in Croatia and Slovenia
– Just Transition for an early coal and nuclear exit
indicating decarbonisation needs in accordance with the European Green Deal. Under this pathway the RES share
in the electricity sector would grow more rapidly within both countries, reaching 84% in Croatia and 53% in Slo-
venia already by 2030, respectively. In the long-term (2050) RES would generate more than domestically needed
in Croatia at an annual balance (i.e. a RES share of 106% by 2050) which, in turn, helps Slovenia to fill the gap
needed for a carbon-free power supply by that point in time. For Slovenia modelling shows that a RES share of
ca. 81% in 2050 appears feasible and makes economically sense, considering RES cooperation with neighbouring
countries as fruitful alternative to meet domestic power needs. Finally, it can be stated that our modelled 2030
RES shares match well with the outcomes of the IRENA study (IRENA, 2020) and reflect for the Reference scenar-
ios national planning, cf. Figure 7.
Figure 7: Development of the share of electricity generation from RES in gross electricity demand up to 2050
in Croatia (left) and Slovenia (right) according to assessed scenarios (Just Transition and Reference)
(Source: Green-X modelling)
RES Share in Gross Electricity Demand in Croatia RES Share in Gross Electricity Demand in Slovenia
110% 110%
Historic trend Historic trend
100% 100%
90% 90%
84% Reference Reference
80% scenario 80% scenario
70% 70%
Just Transition Just Transition
64% scenario scenario
60% 60%
53%
50% 50% IRENA REMap 50% IRENA REMap
43%
40% 40%
30% IRENA 30% 33% IRENA
Reference Reference
20% 20%
10% NECP target 10% NECP target
0% 0%
2010
2015
2020
2025
2030
2035
2040
2045
2050
2010
2015
2020
2025
2030
2035
2040
2045
Details on the underlying technology mix in RES-based electricity generation are applicable from Figure 8. This 2050
graph illustrates the development of electricity generation from RES in Croatia (left) and Slovenia (right) for the
Reference (top) and for the Just Transition (bottom) scenario. According to modelling, within all scenarios the
dominance of hydropower in electricity supply is expected to diminish. Solar electricity (from PV systems) and
wind power (onshore wind) will become the major contributor to future electricity supply. Of interest, as appli-
cable from the results of the Reference scenario, wind energy gains currently comparatively little policy attention
under current planning, specifically in Slovenia – i.e. here the current policy emphasis is on solar PV. Modelling
results of the Just Transition scenario however make clear that wind energy could contribute significantly to the
decarbonisation objective and may become the dominant power source in future (2050) within both Croatia and
Slovenia. Apart from wind energy also bioenergy may deserve more policy attention, contributing to balance
variable RES generation from hydro, wind and PV systems.
Page 15A renewable pathway for decarbonizing the electricity sector in Croatia and Slovenia
– Just Transition for an early coal and nuclear exit
Figure 8: Development of electricity generation from RES up to 2050 in Croatia (left) and Slovenia (right) ac-
cording to assessed scenarios (Just Transition (bottom) and Reference (top))
(Source: Green-X modelling)
Development of electricity generation from RES Development of electricity generation from RES
(in TWh) in Croatia Scenario: Reference (in TWh) in Slovenia Scenario: Reference
35
Hydropower Photovoltaics Wind energy Other RES Hydropower Photovoltaics Wind energy Other RES
20
30
25
15
20
10
15
10
5
5
0 0
2020 2030 2040 2050 2020 2030 2040 2050
Development of electricity generation from RES Development of electricity generation from RES
(in TWh) in Croatia Scenario: Just Transition (in TWh) in Slovenia Scenario: Just Transition
35
Hydropower Photovoltaics Wind energy Other RES Hydropower Photovoltaics Wind energy Other RES
20
30
25
15
20
10
15
10
5
5
0 0
2020 2030 2040 2050 2020 2030 2040 2050
Installed capacities
This section complements the above by taking a closer look at capacity trends in the modelled RES transition
within Croatia and Slovenia. As a starting point, Figure 9 provides a comparison of the differences in cumulative
installed RES capacities for all assessed scenarios within both countries by 2030 (left) and by 2050 (right). Next
to that, insights on the anticipated changes in the country-specific technology mix of installed RES capacities at
present (2020) and in future (2030, 2050) are shown in Figure 10 for all EU MSs, exemplified here for the Just
Transition scenario.
Key results derived from these depictions are:
• As discussed above, the comparatively strong RES ambition is confirmed by the capacity trends: The
cumulative installed RES capacity in Croatia (Slovenia) has to increase by a factor of six (eight) compared
to today (2020).
• The changes in power technology mix across the whole EU can be branded as “solar revolution”: Both
decentral and central PV systems are expected to become the largest contributor to power supply in
Page 16A renewable pathway for decarbonizing the electricity sector in Croatia and Slovenia
– Just Transition for an early coal and nuclear exit
capacity terms in almost all countries, including Croatia and Slovenia – the contribution to power supply
in energy terms is however smaller, cf. Figure 8.
Figure 9: Installed cumulative RES capacities in Croatia and Slovenia by 2030 (left) and by 2050 (right)
according to assessed scenarios (Just Transition and Reference)
(Source: Green-X modelling)
Installed RES-electricity capacities (in GW) by 2030 Installed RES-electricity capacities (in GW) by 2050
Reference Just Transition Reference Just Transition
25 20 18.3
20
15 12.8
11.5
15
10
7.3
10 7.8
5.5
3.2 4.0 5
5
0 0
HR SI HR SI
Figure 10: Country-specific technology mix of installed RES capacities at present (2020) and in future (2030,
2050) of all EU MSs, exemplified for the Just Transition scenario
(Source: Green-X modelling)
Technology mix of installed RES capacities (in % of total RES) by 2020
Biomass total Geothermal electricity Hydro (excl. pure pump storage) Central PV Decentral PV Wind onshore Wind offshore
100%
90%
80%
70%
60%
50%
40%
30%
20%
10%
0%
HR
LV
LT
LU
BE
BG
EE
EL
HU
PL
PT
RO
ES
EU
CY
CZ
IE
IT
DK
DE
MT
AT
FI
FR
NL
SK
SI
SE
Technology mix of installed RES capacities (in % of total RES) by 2030 Scenario: Just Transition
Biomass total Geothermal electricity Hydro (excl. pure pump storage) Central PV Decentral PV Wind onshore Wind offshore
100%
90%
80%
70%
60%
50%
40%
30%
20%
10%
0%
LV
LT
LU
BE
BG
HR
EE
EL
HU
PL
PT
RO
ES
EU
CY
CZ
IE
IT
DK
DE
MT
AT
FI
FR
NL
SK
SI
SE
Technology mix of installed RES capacities (in % of total RES) by 2050 Scenario: Just Transition
Biomass total Geothermal electricity Hydro (excl. pure pump storage) Central PV Decentral PV Wind onshore Wind offshore
100%
90%
80%
70%
60%
50%
40%
30%
20%
10%
0%
LV
LT
LU
BE
BG
HR
EE
EL
HU
PL
PT
RO
ES
EU
CY
CZ
IE
IT
DK
DE
MT
AT
FI
FR
NL
SK
SI
SE
Page 17A renewable pathway for decarbonizing the electricity sector in Croatia and Slovenia
– Just Transition for an early coal and nuclear exit
Mapping of RES installations
This section aims to inform on the details in the geographical distribution of the anticipated RES uptake in Croatia
and Slovenia in future years which may, in turn, help to identify promising sites as well as infrastructural prereq-
uisites. For doing so, we have undertaken a detailed geographical mapping of the previously discussed modelling
results on the future uptake of renewables in both countries. This mapping exercise was performed for all key
RES technologies from a current and forward-looking perspective, comprising hydropower, photovoltaics and
wind energy. The graphs below, Figure 11 to Figure 13, illustrate the development over time (2020 to 2050) for
all key RES technologies identified, exemplified for the Just Transition scenario.
Figure 11: Mapping of current (2020) (left) and future (2030 (middle), 2050 (right)) hydropower installations in
Croatia and Slovenia according to modelling (Just Transition scenario)
(Source: own assessment)
Figure 12: Mapping of current (2020) (left) and future (2030 (middle), 2050 (right)) photovoltaic installations in
Croatia and Slovenia according to modelling (Just Transition scenario)
(Source: own assessment)
Page 18A renewable pathway for decarbonizing the electricity sector in Croatia and Slovenia
– Just Transition for an early coal and nuclear exit
Figure 13: Mapping of current (2020) (left) and future (2030 (middle), 2050 (right)) wind onshore installations
in Croatia and Slovenia according to modelling (Just Transition scenario)
(Source: own assessment)
5.3 Power System Analysis: Feasibility check for 2030
Complementary to the above, a power system analysis has been undertaken for 2030 at European scale, serving
as feasibility check that the electricity market in Croatia and Slovenia as well as in the remainder of the EU can
cope with the anticipated rapid RES expansion as presumed in the Just Transition scenario. As outlined in chapter
2 of this report, the power system analysis was done by use of the open-source model Balmorel, offering a sound
representation of the European power system, clustered into country nodes that are interlinked via transmission
lines in accordance with ENTSO-E planning (i.e. TYNDP 2018), at a high temporal resolution 2. Modelling indicates
the power plant dispatch in order to achieve a match between demand and supply, including storage and other
flexibility options to a limited extent.
The analysis proves that the European electricity system can cope well with the anticipated strong RES uptake in
the period up to 2030. Below we take a closer look at the resulting generation mix for representative weeks and
at a yearly balance. The latter served to also identify CO2 emissions that stem from fossil electricity generation
as reported subsequently.
Hourly power plant dispatch in Croatia and Slovenia for representative weeks
Figure 14 and Figure 15 illustrate the hourly power plant dispatch in the regional market of both Croatia and
Slovenia during a typical summer week (Figure 14) as well as during a typical winter week (Figure 15) of the year
2030 for both assessed scenarios. The strong uptake of renewables in the Just Transition scenario translates into
significantly higher generation volumes in comparison to the Reference scenario. PV systems contribute to cover
a high share of total demand during the summer period whereas wind power contributes slightly more during
the winter period. Weather-dependent fluctuations in electricity supply from all forms of variable RES are ob-
servable but the power system can cope well with these. Since coal and nuclear remain in the power plant fleet
in the Reference scenario their contribution to electricity supply is also applicable in the Reference scenario.
2 The modelling was done at an hourly basis for the whole year 2030.
Page 19A renewable pathway for decarbonizing the electricity sector in Croatia and Slovenia
– Just Transition for an early coal and nuclear exit
Figure 14: Hourly generation mix in Croatia and Slovenia for a typical summer week in 2030 according to the
Reference (top) and the Just Transition (bottom) scenario. (Source: Balmorel modelling)
Technology-breakdown of electricity generation in a typical summer week
in Croatia & Slovenia (in MW) - Scenario: Reference
6000
5000
4000
3000
2000
1000
0
1 5 9 13 17 21 25 29 33 37 41 45 49 53 57 61 65 69 73 77 81 85 89 93 97 101105109113117121125129133137141145149153157161165
Nuclear Coal Waste Natural gas Bioenergy Hydro Wind PV
Technology-breakdown of electricity generation in a typical summer week
in Croatia & Slovenia (in MW) - Scenario: Just Transition
6000
5000
4000
3000
2000
1000
0
1 5 9 13 17 21 25 29 33 37 41 45 49 53 57 61 65 69 73 77 81 85 89 93 97 101105109113117121125129133137141145149153157161165
Nuclear Coal Waste Natural gas Bioenergy Hydro Wind PV
Page 20A renewable pathway for decarbonizing the electricity sector in Croatia and Slovenia
– Just Transition for an early coal and nuclear exit
Figure 15: Hourly generation mix in Croatia and Slovenia for a typical winter week in 2030 according to the Ref-
erence (top) and the Just Transition (bottom) scenario. (Source: Balmorel modelling)
Technology-breakdown of electricity generation in a typical winter week
in Croatia & Slovenia (in MW) - Scenario: Reference
6000
5000
4000
3000
2000
1000
0
1 5 9 13 17 21 25 29 33 37 41 45 49 53 57 61 65 69 73 77 81 85 89 93 97 101105109113117121125129133137141145149153157161165
Nuclear Coal Waste Natural gas Bioenergy Hydro Wind PV
Technology-breakdown of electricity generation in a typical winter week
in Croatia & Slovenia (in MW) - Scenario: Just Transition
6000
5000
4000
3000
2000
1000
0
1 5 9 13 17 21 25 29 33 37 41 45 49 53 57 61 65 69 73 77 81 85 89 93 97 101105109113117121125129133137141145149153157161165
Nuclear Coal Waste Natural gas Bioenergy Hydro Wind PV
Changing the technology mix: Technology breakdown
of electricity supply in Croatia and Slovenia at a yearly balance by 2030
Below we provide a technology breakdown of electricity supply in 2030 at a yearly balance for both Croatia and
Slovenia in accordance with the assessed scenarios, cf. Table 3 (Reference scenario) and Table 4 (Just Transition
scenario). As applicable also from the annual supply balance, the anticipated strong uptake of RES in both coun-
tries nicely compensates the supply gap arising from the early phase-out of coal and nuclear as presumed in the
Just Transition scenario. The import ratio at regional level (i.e. Croatia and Slovenia as one region) increases
slightly from 10% (in comparison to demand) in the Reference scenario to 14% in the Just Transition scenario.
Natural gas does not contribute to compensate the gap at a yearly level but helps in providing flexible power
when needed at a system level.
Page 21A renewable pathway for decarbonizing the electricity sector in Croatia and Slovenia
– Just Transition for an early coal and nuclear exit
Table 3: Technology breakdown of yearly electricity generation (and comparison to demand) in Croatia and
Slovenia by 2030 according to the Reference scenario.
(Source: Balmorel modelling)
Yearly electricity
Total Demand
generation in
Hydropower
Total Supply
Natural gas
2030 according
Bioenergy
to the Reference
Nuclear
Lignite
Waste
Wind
scenario
Coal
PV
(in TWh)
Croatia 0.0 0.0 1.4 5.1 0.1 0.8 7.3 3.1 1.9 19.8 20.5
Slovenia 5.9 0.0 0.0 0.4 0.2 0.6 4.7 0.2 1.8 13.8 16.9
Total 5.9 0.0 1.4 5.5 0.3 1.4 11.9 3.3 3.8 33.6 37.3
Table 4: Technology breakdown of yearly electricity generation (and comparison to demand) in Croatia and
Slovenia by 2030 according to the Just Transition scenario.
(Source: Balmorel modelling)
Yearly electricity
generation in
Total Demand
2030 according
Hydropower
Total Supply
Natural gas
to the Just Tran-
sition Bioenergy
Nuclear
Lignite
Waste
Wind
scenario
Coal
PV
(in TWh)
Croatia 0.0 0.0 0.0 5.2 0.1 1.2 7.3 5.7 2.8 22.2 20.5
Slovenia 0.0 0.0 0.0 0.3 0.2 1.0 4.7 1.2 2.1 9.3 16.9
Total 0.0 0.0 0.0 5.4 0.2 2.2 11.9 6.8 4.9 31.5 37.3
Impact on CO 2 emissions
The presumed early exit of coal has a positive impact on the GHG balance of the electricity sector in the focus
region. Both in Croatia and Slovenia CO2 emissions related to domestic electricity supply in 2030 decline signifi-
cantly. At regional level (i.e. Croatia and Slovenia as one region) this implies a decline by 42% under the Just
Transition scenario in comparison to the reference, cf. Table 5.
Table 5: Yearly CO2 emissions related to domestic electricity supply in Croatia and Slovenia by 2030
according to assessed scenarios.
(Source: Balmorel modelling)
Yearly CO2 emissions re-
lated to domestic electric-
ity supply by 2030 Regional
(in Mt CO2) Croatia Slovenia total
Reference scenario 3.3 0.5 3.8
Just Transition scenario 2.0 0.2 2.2
Page 22A renewable pathway for decarbonizing the electricity sector in Croatia and Slovenia
– Just Transition for an early coal and nuclear exit
5.4 RES-related costs and expenditures:
Investment needs and support expenditures
Investment needs
Strong investments in renewables are required to let the illustrated vision of a nuclear and coal-free power supply
in Croatia and Slovenia become a reality. This is getting apparent when comparing the necessary yearly invest-
ments in RES technologies as shown in Table 6.
Table 6: Average yearly investment needs for RES installations in the Croatian (left) and Slovenian (right)
electricity sector in the period up to 2050 according to assessed scenarios.
(Source: Green-X modelling)
Average yearly invest-
ment needs for RES
Croatia Slovenia
installations (in Mio. €) 2021-2030 2031-2040 2041-2050 2021-2030 2031-2040 2041-2050
Reference scenario 235 256 329 129 127 180
Just Transition scenario 495 605 553 230 519 291
Figure 16: Technology breakdown of total RES investments in the period up to 2050 in Croatia (left) and Slove-
nia (right) according to the Just Transition scenario.
(Source: Green-X modelling)
Share of total RES investments in the Share of total RES investments in the
period 2021 to 2050 in Croatia period 2021 to 2050 in Slovenia
(in % of total) (in % of total)
6% 1% 10%
0%
29% 30%
65% 60%
Other RES Hydropower Wind PV Other RES Hydropower Wind PV
Impact on consumer cost
The strong uptake of renewables comes at cost – but the overall cost increase remains moderate as applicable
from Table 7. At first glance, RES-related support expenditures appear to increase tremendously in this decade
when comparing the results for the Just Transition scenario with the reference. But this increase is caused by the
decline of electricity prices on the wholesale market as a consequence of the proactive phase-out of fossil elec-
tricity supply in Slovenia and Croatia as well as across the whole European continent. Variable renewables like
hydropower, wind and solar PV have low operating cost which, in turn, leads to a drop of wholesale prices. In
consequence, higher dedicated support is required for certain RES technologies to compensate the financing
gap. The overall cost to consumer is however modest as applicable in the lower part of Table 7: Cost to consumer
increase by ca.12% in Croatia and by 14% in Slovenia when comparing Just Transition with Reference.
Page 23A renewable pathway for decarbonizing the electricity sector in Croatia and Slovenia
– Just Transition for an early coal and nuclear exit
Table 7: Average yearly support expenditures for electricity generation from RES (top) and yearly balance of
cost impacts to consumer (by 2030 - bottom) in Croatia (left) and Slovenia (right) in the period up to
2030 according to assessed scenarios.
(Source: Green-X modelling)
Average yearly support
expenditures for RES
Croatia Slovenia
(in Mio. €) 2021-2030 2021-2030
Reference scenario 103 12
Just Transition scenario 262 87
Focus on 2030: Yearly bal-
ance of cost impacts to Wholesale RES Support Cost to Wholesale RES Support Cost to
consumer (in €/MWh) price expenditures Consumer price expenditures Consumer
Reference scenario 60.9 6.3 67.2 60.8 1.3 62.1
Just Transition scenario 55.8 19.3 75.1 56.3 14.3 70.6
Figure 17: Technology breakdown of total RES support expenditures in the period up to 2030 in Croatia (left)
and Slovenia (right) according to the Just Transition scenario.
(Source: Green-X modelling)
Share of total RES support Share of total RES support
expenditures in the period 2021 to expenditures in the period 2021 to
2030 in Croatia (in % of total) 2030 in Slovenia (in % of total)
18% 19% 3%
37%
50%
60%
12% 1%
Other RES Hydropower Wind PV Other RES Hydropower Wind PV
Page 24A renewable pathway for decarbonizing the electricity sector in Croatia and Slovenia
– Just Transition for an early coal and nuclear exit
6 Summary of key findings
In light of the ambitious targets of the Paris Agreement and highly ambitious long-term decarbonisation goals
set by the European Green Deal, a critical question for decision-makers is how to sustain a coal and lignite phase-
out that is as swift as possible while also ensuring supply of affordable electricity, and a just transition in regions
dependent on coal. Within Slovenia and Croatia electricity generation from nuclear power is often seen as a
carbon-free alternative – but concerns on a safe and reliable operation of the nuclear power plant built at Krško
question this generation asset and also the plans for a second nuclear unit at the Krško site.
This report sheds light on an alternative pathway for a just transition of the electricity sector of Croatia and
Slovenia, relying on a transition towards renewable energy forms as alternative to coal and nuclear. The aim
of this report is to illustrate and describe how this alternative pathway may look like. We thereby inform on the
sector transition, indicating technology trends of the so-called “Just Transition” scenario in comparison to a ref-
erence path where nuclear and coal maintain their dominance.
Key findings from the analyses performed in the course of this study are:
► A closer look at available potentials in Croatia and Slovenia reveals that domestic RES potentials may suf-
fice well to compensate the supply gap arising from an early coal and nuclear exit.
Building on an intense literature review performed in an ongoing EU study (cf. Resch et al. (2021)) and an
own GIS-based analysis, we conclude that significant future potentials are applicable for PV and wind on-
shore. Here the outcomes of our own GIS based analysis point out that available domestic resources would
allow for meeting and exceeding current electricity needs of both Croatia and Slovenia. Summing up the
identified technical potentials of both countries together corresponds to an annual generation volume that
is almost three times as high a current electricity demand. Due to the country size and the topographical
location potentials for both PV and wind onshore are however significantly higher in Croatia than in Slovenia.
Apart from solar and wind also bioenergy offers techno-economic potentials at a relevant magnitude that
may help to balance the weather-dependent variable electricity supply from hydropower, wind and PV. In
contrast to the above, future potentials for hydropower – currently the dominant renewable energy source
– appear limited, considering available potentials as well as environmental concerns.
► Recap on 2030 RES targets: the European Green Deals calls for a stronger uptake of renewables in the
period up to 2030 across the whole continent.
The European Green Deal and the corresponding increase in the 2030 climate ambition (approximately 55%
instead of 40% GHG reduction at EU level) raises the need for a stronger uptake of renewables, from about
32-34% (in accordance with current Member State planning) to (at least) 40%. This may imply also for Croatia
and Slovenia to revise their current energy planning as postulated in National Energy and Climate Plans at
the end of 2019. Our derived “Just Transition” pathway may help well in that update process, offering a
carbon-free reliable alternative to both coal and nuclear in electricity supply.
► Spotlight on Croatia and Slovenia: Changing the electricity mix.
Within Croatia and Slovenia renewables are already at present a key contributor to meet the demand for
electricity. According to latest statistical data available (Eurostat, 2021a), RES achieved a share of ca. 50% in
gross electricity demand by 2019 in Croatia, and the RES demand share in Slovenia was 33% (2019), respec-
tively. Historically, the RES share was steadily growing over the past decade, with differences across both
countries since a significantly stronger growth could be achieved in Croatia in comparison to Slovenia. This
growth needs to be accelerated in future years, given the policy commitments taken and the needs arising
from a transformation of the energy sector in order to combat climate change while phasing out coal and
nuclear:
• According to the derived Just Transition pathway the RES share in the electricity sector would grow
more rapidly within both countries compared to current national planning, reaching 84% in Croatia
Page 25You can also read