Assessment of the Wind Energy Potential along the Romanian Coastal Zone - MDPI
←
→
Page content transcription
If your browser does not render page correctly, please read the page content below
inventions
Article
Assessment of the Wind Energy Potential along the Romanian
Coastal Zone
Alina Girleanu *, Florin Onea                  and Eugen Rusu

                                          Department of Mechanical Engineering, Faculty of Engineering, “Dunarea de Jos” University of Galati,
                                          47 Domneasca Street, 800008 Galati, Romania; florin.onea@ugal.ro (F.O.); eugen.rusu@ugal.ro (E.R.)
                                          * Correspondence: alina.girleanu@ugal.ro

                                          Abstract: The present work aims to provide a comprehensive picture of the wind energy potential
                                          that characterizes the Romanian coastal environment using in situ measurements and reanalysis
                                          of wind data (ERA5) that cover a 42–year time interval (1979–2020). A total of 16 reference points
                                          (both land and offshore) equally distributed along the Romanian sector are used to evaluate the local
                                          wind energy potential, targeting in this way several sites where a renewable wind project could be
                                          established. Compared to the in situ measurements (land points), the ERA5 dataset underestimates
                                          the wind speed by at least 11.57%, this value increasing as we approach the coastline. From the
                                          analysis of the spatial maps, it is likely that the wind speed steadily increases from onshore to
                                          offshore, with a sharp variation near the coastline being reported. Furthermore, the assessment
                                          of some state-of-the-art offshore wind turbines was conducted using 12 systems defined by rated
                                          capacity ranging from 2 to 10 MW. Some scenarios were proposed to identify sustainable offshore
                                          wind projects to be implemented in the Romanian coastal zone based on these results.

                                Keywords: Romania; coastal area; wind energy; measurements; IEC classes; wind turbines


Citation: Girleanu, A.; Onea, F.;
Rusu, E. Assessment of the Wind
Energy Potential along the Romanian       1. Introduction
Coastal Zone. Inventions 2021, 6, 41.
                                               At the core of the energy transition towards renewables and planning for a post–
https://doi.org/10.3390/
                                          COVID–19 economic rehabilitation, offshore wind resource is considered a possible pillar in
inventions6020041
                                          reaching net–zero emissions of greenhouse gases by the end of 2050, a policy required by the
                                          European Green Deal. At the European level, offshore wind projects are already considered
Academic Editor: Pierluigi Siano
                                          a competitive sector. According to [1], the European Union (EU) complete decarbonisation
                                          will require 450 GW of offshore wind capacity by 2050, representing 18 times more than
Received: 21 May 2021
Accepted: 3 June 2021
                                          the currently installed offshore wind capacity—25 GW and 5402 grid-connected wind
Published: 4 June 2021
                                          turbines across 12 countries. The reason why offshore wind is more desirable than solar
                                          and even onshore wind power is its higher full-load and operating hours, its stability and its
Publisher’s Note: MDPI stays neutral
                                          greater predictability. Moreover, offshore wind represents nowadays a very cost-effective
with regard to jurisdictional claims in
                                          alternative for power generation, taking into consideration the fact that the Levelized
published maps and institutional affil-   Cost of Electricity (LCOE) decreased from an average of 0.13 USD/kWh in 2018 to an
iations.                                  average between 0.05–0.09 USD/kWh by 2030 and 0.03–0.07 USD/kWh by 2050 [2], falling
                                          in the low range of costs for fossil fuels and becoming more affordable than nuclear
                                          power. The increased economies of scale, together with the competitiveness of supply
                                          chains and further technological advances, will reduce the cost of harvesting wind energy.
Copyright: © 2021 by the authors.
                                          Nevertheless, for the time being, investing in onshore wind projects seems to be more
Licensee MDPI, Basel, Switzerland.
                                          economically viable, even though offshore designs generate more electricity [3].
This article is an open access article
                                               There is a growing interest in developing wind projects in different coastal areas
distributed under the terms and           defined by resourceful wind energy [4–6]. Given the recent enhancements intended to
conditions of the Creative Commons        reach the decarbonisation process, Romania must tap into its existing offshore wind power
Attribution (CC BY) license (https://     potential in the Black Sea. Currently, even though Romania is one of the leading countries in
creativecommons.org/licenses/by/          the south-eastern part of Europe in terms of onshore wind development, having an installed
4.0/).                                    capacity of 3 GW, according to the National Energy and Climate Plan (NECP) 2021–2030 [7],

Inventions 2021, 6, 41. https://doi.org/10.3390/inventions6020041                                        https://www.mdpi.com/journal/inventions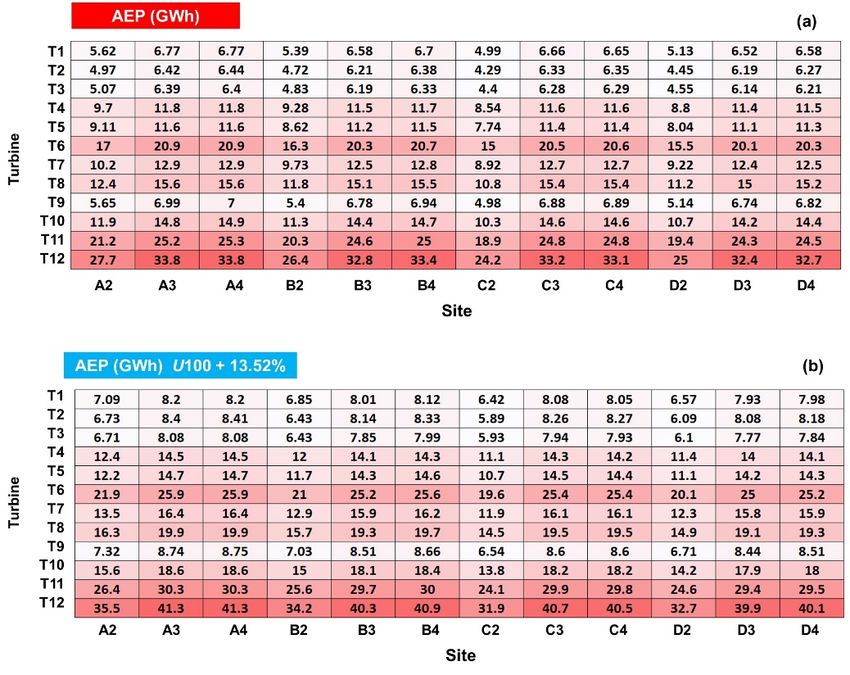
Inventions 2021, 6, 41                                                                                            2 of 17

                         there is inadequate support for the advancement of offshore capacities in the Black Sea.
                         For example, almost 80% of the existing wind turbines in Romania are concentrated in the
                         Dobrogea region, located near the sea. The most significant operational onshore wind farm
                         in Europe is also established in Dobrogea, namely the Fantanele–Cogealac wind project,
                         having an installed capacity of 600 MW [8].
                               Most of the latest published research regarding the Black Sea describes the wind
                         conditions only from a meteorological point of view [9–11], probably due to the fact
                         that the Black Sea coastal zone is considered less attractive than other enclosed or semi-
                         enclosed seas, such as the Mediterranean or Baltic Sea [4–6]. Moreover, the performances of
                         some commercial, state-of-the-art wind turbines were assessed by Onea and Rusu [12–14],
                         considering several reference sites distributed along the Black Sea shoreline, at a water
                         depth that, however, does not exceed 50 m. Additionally, several offshore sites that appear
                         to be suitable for implementing a wind project in the Turkish coastal region were proposed
                         in [15], while Raileanu et al. [16] assessed the performances of two wind turbines that
                         operate offshore—Siemens SWT-3.6-120 and Senvion-6.2M-126.
                               Even though the topic of research appears similar to the one discussed in Onea and
                         Rusu [3], the present study is characterized by significant differences. Firstly, the wind
                         dataset and the number of values per day differ since ERA5 replaced the ERA–Interim
                         database used in [3] with 24 values per day. Moreover, in [3], the assessment of the
                         turbines’ performances was carried out by adjusting the wind data values from 10 m to an
                         operational hub height of 80 m, while in this case 12 turbines were evaluated by considering
                         the ERA5 values directly reported at the height of 100 m above sea level. The selected
                         wind turbines’ rated capacity varies from 2 to 10 MW, including the existing operational
                         systems and the brand-new generation of turbines expected to be implemented shortly.
                         At the same time, it is essential to mention that in [17] the maximum rated power was
                         5 MW. Since the literature review concentrating on the Black Sea coastal area is considerably
                         restrained, the purpose of this work is to identify the best performances of various wind
                         turbines that might become operational in the Romanian coastal environment. From this
                         perspective, this study will focus on the differences between the onshore and offshore
                         wind power potential, which site is the most suitable for developing a renewable wind
                         project and what type of wind turbine will be most appropriate to operate within the target
                         area. This study can be considered an opportunity since there is a significantly growing
                         interest both from investors and the Romanian authorities for developing offshore wind
                         projects in this specific environment. In this context, the present work is defined by some
                         elements of novelty, as follows: (a) The differences between the Romanian onshore and
                         offshore wind resources are assessed by also including in-situ measurements for two sites
                         located near the shoreline; (b) a long-term overview of the wind resources is provided
                         (42 years), compared to only 20 years that were previously considered for this target area;
                         (c) an extensive portfolio of turbines (12 different systems) is considered for evaluation to
                         identify their expected performances.

                         2. Materials and Methods
                         2.1. Target Area
                              The Black Sea wind climate is mainly influenced by the action of polar, continental and
                         marine-tropical air masses, from which the most noticeable impact is that of the polar air
                         masses, especially during the wintertime, when shallow temperatures and extreme storms
                         might occur. Notably, it is considered that the western side of the Black Sea is defined
                         by more abundant wind resources, with 8 m/s representing the mean wind speed value
                         recorded during the winter season [13]. Figure 1 reveals the differences in water depth
                         across Romania’s Exclusive Economic Zone (EEZ). The EEZ is characterized by an area of
                         more than 22 thousand km2 and the territorial surface of the water of 4084 km2 , associated
                         with 5.30% of the entire Black Sea shoreline [3]. The thick black line indicates the boundaries
                         of the Romanian EEZ. As shown in Figure 1, a meaningful part of Romania’s EEZ is a deep-
                         water area >50 m, which is more suitable for floating platforms than fixed systems. A closer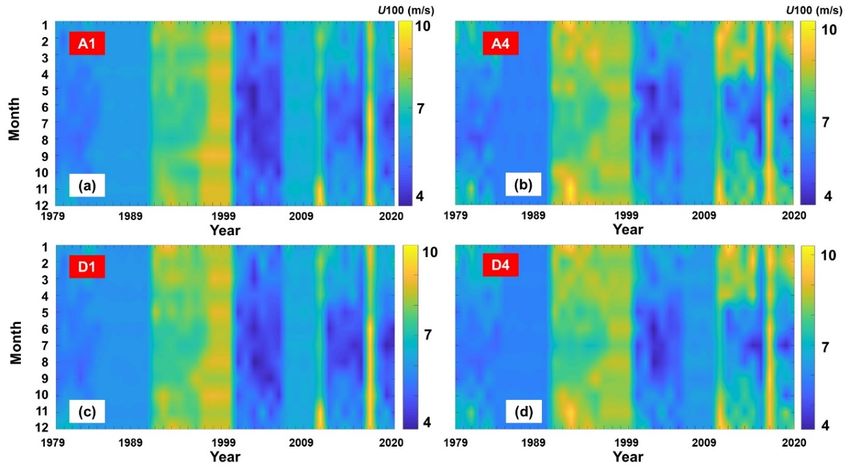
Inventions 2021, 6, 41 3 of 17
look at the European offshore market [18] points out that, in 2019, the average distance
to shore for developing projects was close to 60 km, which is just within the Romanian
transition area from shallow to deep water [19]. Nevertheless, wind farms located more
than 50 km from shore ought to be connected to the grid through high voltage direct
current connections to reduce electrical losses significantly; such connections, though,
demand more significant upfront investment costs [20]. Further details regarding the
target area are presented in Figure 1, where 16 reference sites were defined for assessment.
The sites considered for the study are equally distributed along the Romanian coastline
and are located both onshore and offshore. Furthermore, the points located offshore were
defined in water depths of 50–89 m, and the maximum distance from the shore of 118 km
corresponds to Site B4. A more comprehensive picture of the selected points is outlined
in Table 1. Considering these points, we are likely to achieve a general view of the wind
Inventions 2021, 6, x FOR PEER REVIEW
power potential and the expected performances of a particular wind turbine that can 4 ofbe
18
further extended to a more thorough investigation.
Figure 1.
Figure 1. The Romanian
Romanian coastal
coastal area,
area, including
including the
the Exclusive
Exclusive Economic
EconomicZoneZone(EEZ)
(EEZ)boundaries
boundariesand
and
the reference
the referencesites
sitesconsidered.
considered. Map
Map processed
processedfrom
fromGoogle
GoogleEarth,
Earth,2021.
2021.
2.2. Wind
Table 1. TheDataset
main characteristics of the sites considered onshore and offshore of the Romanian coastal
environment.
Several Data obtained
previous from Google
publications Earthhave
[21,22] 2021. focused on assessing Romania’s wind off-
shore resources. Against this background, the current study highlights several elements
Long Lat Distance to Shore Height/Depth
of ID
novelty, Location
including an analysis
(◦ )
of a new(◦wind
)
database—ERA5—which
(km)
is(m)
the latest
product of the European Centre for Medium-Range Weather Forecasts (ECMWF) [23].
A1 Land 28.899 45.084 60 68
ERA5 is a replacement for the ERA–Interim database reanalysis that stopped being dis-
A2 Shoreline 29.635 44.952 0 0
played
A3 in 2019 [24] and comprises
Offshore 30.247 vast amounts
44.837 of historical 49observations into−global
50 es-
timates
A4 using state-of-the-art
Offshore modelling and
30.839 data assimilation
44.716 100systems. Moreover,
−81 wind
speed
B1 valuesLandare reported 28.309
at a hub height44.800
of 100 m (U100),57 obtained directly185
from the
B2 data Shoreline
ERA5 29.015 to underline
system. It is essential 44.683 0
that since the wind speed values0at 100 m
B3 directly
were Offshore 29.680 data processing
provided, no further 44.569 was needed, 55 such as the use−of
61 a loga-
B4 Offshore 30.478 44.438 118 −84
rithmic law to adjust the wind speed from a 10 m height above the sea level, where the
C1 Land 27.960 44.471 60 11
velocity
C2 is much lower due 28.693
Shoreline to boundary layer mean velocity distribution.
44.351 0 Additionally,
0 in
situ
C3measurements
Offshore were considered
29.377 for two existing
44.250 wind projects
56 located onshore
−51 near
theC4Dobrogea region (Mihai–Viteazu
Offshore 30.114 and Istria
44.122 sites), considering
115 the time interval
−89 from
D1
October 2006Land
and April 2009,27.942 44.081
which was used for comparison60against ERA5 data. 145
D2 Shoreline 28.675 43.976 0 0
D3 Offshore
2.3. Wind Turbines 29.179 43.916 43 −51
D4 Offshore 29.755 43.841 90 −83
Since there is yet no ongoing wind energy project in the Black Sea basin to emphasize
the performances of a wind energy conversion system in the target area, some already
operational wind turbines were considered for analysis. The main characteristics of these
systems are presented in Table 2, systems that are currently considered for implementa-
tion in some European offshore wind projects. The average rated power is close to 8.20
MW, and more than 30% of the projects developed last year included larger systems.
However, turbine orders placed online already reveal a trend towards the next generation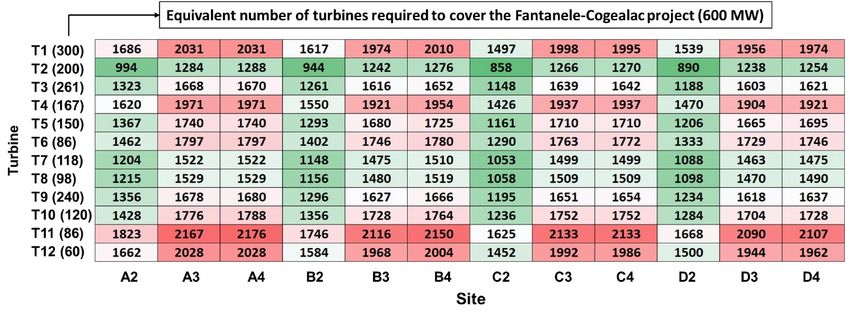
Inventions 2021, 6, 41                                                                                                              4 of 17

                                    2.2. Wind Dataset
                                           Several previous publications [21,22] have focused on assessing Romania’s wind off-
                                    shore resources. Against this background, the current study highlights several elements of
                                    novelty, including an analysis of a new wind database—ERA5—which is the latest product
                                    of the European Centre for Medium-Range Weather Forecasts (ECMWF) [23]. ERA5 is
                                    a replacement for the ERA–Interim database reanalysis that stopped being displayed in
                                    2019 [24] and comprises vast amounts of historical observations into global estimates using
                                    state-of-the-art modelling and data assimilation systems. Moreover, wind speed values are
                                    reported at a hub height of 100 m (U100), obtained directly from the ERA5 data system.
                                    It is essential to underline that since the wind speed values at 100 m were directly provided,
                                    no further data processing was needed, such as the use of a logarithmic law to adjust
                                    the wind speed from a 10 m height above the sea level, where the velocity is much lower
                                    due to boundary layer mean velocity distribution. Additionally, in situ measurements
                                    were considered for two existing wind projects located onshore near the Dobrogea region
                                    (Mihai–Viteazu and Istria sites), considering the time interval from October 2006 and April
                                    2009, which was used for comparison against ERA5 data.

                                    2.3. Wind Turbines
                                          Since there is yet no ongoing wind energy project in the Black Sea basin to emphasize
                                    the performances of a wind energy conversion system in the target area, some already
                                    operational wind turbines were considered for analysis. The main characteristics of these
                                    systems are presented in Table 2, systems that are currently considered for implementation
                                    in some European offshore wind projects. The average rated power is close to 8.20 MW,
                                    and more than 30% of the projects developed last year included larger systems. However,
                                    turbine orders placed online already reveal a trend towards the next generation in terms of
                                    size, with turbines ranging from 10 to 13 MW for upcoming projects starting with 2022 [25].
                                    The size of new wind farms is estimated at 788 MW, while the distance to the shore and the
                                    water depth has increased to 52 km and 44 m, respectively [25]. The 12 selected turbines
                                    embrace a full spectrum of rated capacity, starting from 2 MW and ending with the AMSC
                                    wt10000dd SeaTitan—a production of American Superconductor, a manufacturer from the
                                    US—having the highest-rated power—10 MW. It is essential to mention that, although
                                    these systems can operate at different heights above sea level, their performances were
                                    evaluated at 100 m since, at this level, there is a higher wind potential. Figure 2 reveals the
                                    power curve of each system, identifiable throughout the cut-in, rated speed and cut-out
                                    thresholds, all operating at a hub height of 100 m.

                   Table 2. Technical details of the wind turbines considered in this work. Data processed from [26,27].

                                                 Power        Cut–in Speed        Rated Speed      Cut–out Speed           Hub Height
     ID                  Turbine
                                                 (MW)             (m/s)              (m/s)             (m/s)                  (m)
    T1                 V100–2.0                   2.00             3.00                12                 22                  100
    T2                 V100–3.0                   3.00             4.00                15                 25                  100
    T3                SWT–2.3–93                  2.30             4.00                13                 25                  100
    T4                SWT–3.6–120                 3.60             3.50                12                 25                  100
    T5                SWT–4.0–130                 4.00             5.00                12                 25                  100
    T6                SWT–7.0–154                 7.00             3.00                13                 25                  100
    T7                REpower5M                  5.075             3.50                14                 25                  100
    T8                REpower6M                   6.15             3.50                14                 25                  100
    T9              Nordex N90/2500               2.50             3.00               13.50               25                  100
    T10             AREVA M5000–116               5.00             4.00               12.50               25                  100
    T11             Samsung S7.0–171              7.00             3.00               11.50               25                  100
                    AMSC wt10000dd
    T12                                          10.00             4.00               11.50               25                  100
                        SeaTitan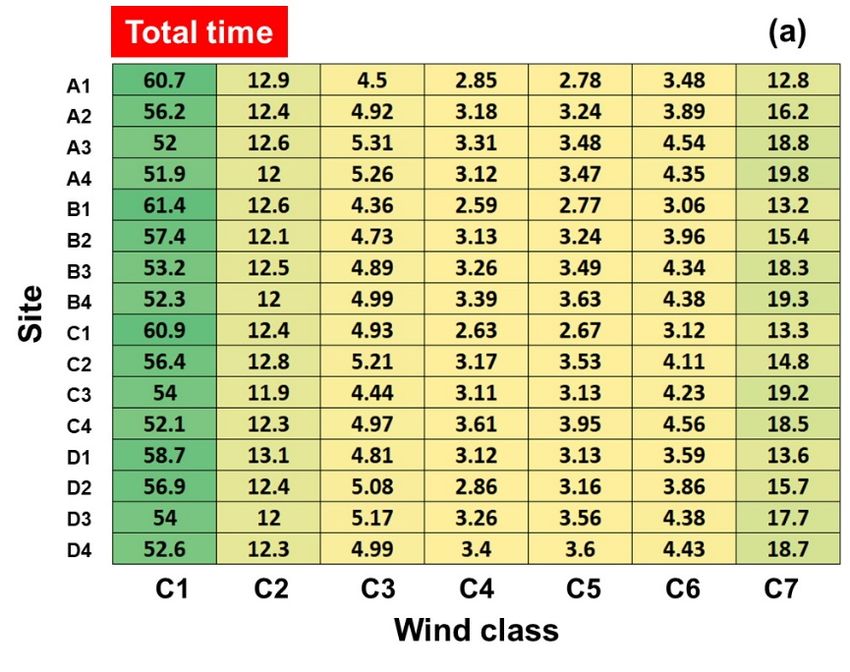
T6 SWT–7.0–154 7.00 3.00 13 25 100
T7 REpower5M 5.075 3.50 14 25 100
T8 REpower6M 6.15 3.50 14 25 100
T9 Nordex N90/2500 2.50 3.00 13.50 25 100
T10 2021, 6,AREVA
Inventions 41 M5000–116 5.00 4.00 12.50 25 100 5 of 17
T11 Samsung S7.0–171 7.00 3.00 11.50 25 100
T12 AMSC wt10000dd SeaTitan 10.00 4.00 11.50 25 100
Figure 2. Representation of the wind turbine power curves considered for this study.
study.
The Annual
The Annual Electricity
Electricity Production
Production (AEP)
(AEP) of
of any
any wind
wind turbine
turbine can
can be
be expressed
expressed as
as
follows [28]:
follows [28]: Z cut−out
AEP = T × f (u) P(u)du (1)
= × cut−in ( ) ( ) (1)
where AEP is displayed in MWh, T represents the average number of operational hours per
year, f (u)
where AEPtheisWeibull
displayedprobability
in MWh,density
T represents theP(u)
function, the power
average number curve of a wind turbine
of operational hours
(also represented
per year, f(u) the in Figure probability
Weibull 2 for each ofdensity
the 12 systems),
function,and P(u)the
thecut-out
powerand cut-in
curve of aspeeds
wind
are wind turbine technical terms.
turbine (also represented in Figure 2 for each of the 12 systems), and the cut-out and cut-
The Weibull
in speeds are wind probability density terms.
turbine technical function can be denoted as follows [29]:
The Weibull probability density function can be denoted as follows [29]:
k u k −1
uk
f (u) = exp − (2)
( )=c c
−
c (2)
where u represents the wind speed (expressed in m/s), k the shape parameter, and c the
where u represents the wind speed (expressed in m/s), k the shape parameter, and c the
scale parameter (expressed in m/s).
scale parameter (expressed in m/s).
One method, which can be used to estimate the reliability of a particular energy system
One method, which can be used to estimate the reliability of a particular energy sys-
converter, is to assess its capacity factor (Cf ), which can be defined as follows [30]:
tem converter, is to assess its capacity factor (Cf), which can be defined as follows [30]:
P
C f = = turbine ×× 100 (3)
(3)
Prated
where Pturbin e represents the electric power expected to be generated by each turbine and
Prated represents the rated power of each generator.
3. Results
3.1. Analysis of the Wind Resources
ERA5 wind data is the principal data source used in this work; therefore, it is essential
to understand and take into consideration the differences between alternative data sources,
in this case, the in situ measurements. Based on the comparisons against some in situ
measurements for two existing wind projects located onshore near the Dobrogea region,
considering the time interval from October 2006 to April 2009, it appears that the ECMWF
wind data underestimates the wind conditions, as illustrated in Figure 3. For the Mihai–
Viteazu wind project, located at 39.70 m height, in the vicinity of reference sites B1 and B2
(see Figure 1), the ERA5 data undervalues the wind speed by at least 11.57%. Regarding
the Istria site, located at a height of 42.60 m and closer to the coastline, the percentage is
even higher, namely 13.52%.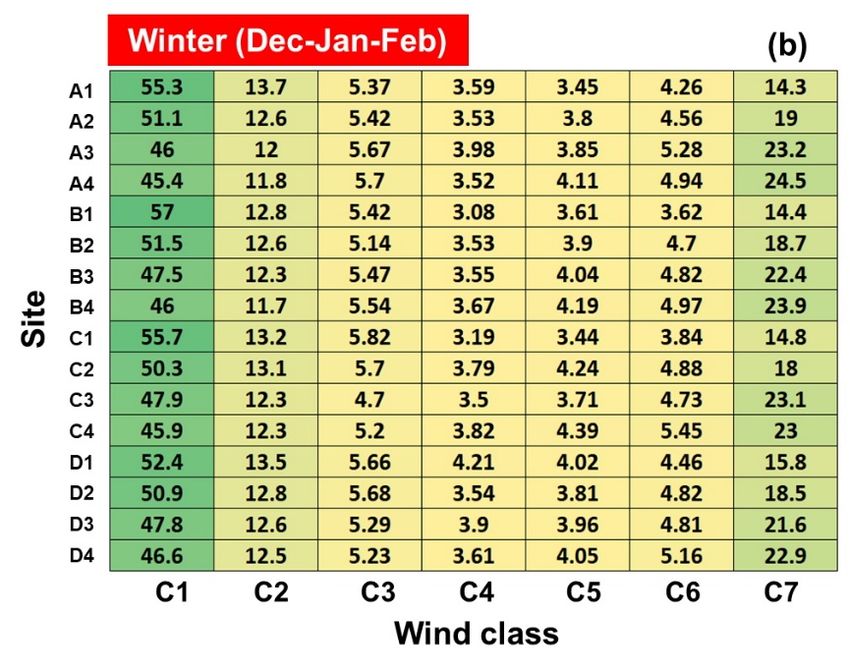
situ measurements for two existing wind projects located onshore near the Dobrogea re-
gion, considering the time interval from October 2006 to April 2009, it appears that the
ECMWF wind data underestimates the wind conditions, as illustrated in Figure 3. For the
Mihai–Viteazu wind project, located at 39.70 m height, in the vicinity of reference sites B1
Inventions 2021, 6, 41 and B2 (see Figure 1), the ERA5 data undervalues the wind speed by at least 11.57%. 6 ofRe-
17
garding the Istria site, located at a height of 42.60 m and closer to the coastline, the per-
centage is even higher, namely 13.52%.
Figure 3.3. Wind
Figure Windspeed
speedcomparison
comparisonbetween
betweenERA5
ERA5and andin insitu
situmeasurements,
measurements,considering
consideringthethetime
time
interval
interval October
October 2006
2006 to
to April
April 2009.
2009. Results
Results for:
for: (a)
(a) Mihai-Viteazu
Mihai-Viteazu site,site, at
at 39.7
39.7 m
mheight;
height; (b)
(b)Istria
Istria
site,at
site, at 42.6
42.6 m
m height.
height. The
The in
in situ
situ values
values were
wereadapted
adaptedfromfrom[30].
[30]. The
Thepercentage
percentagevalues
valuesindicate
indicatethethe
average differences (in %) between ERA5 and in situ data, in this case ERA5 underestimating
average differences (in %) between ERA5 and in situ data, in this case ERA5 underestimating the the
windspeed.
wind speed.
Figure 44 and
Figure and Table
Table 33show
show the
the Weibull
Weibullprobability
probabilitydistribution
distribution and
and characteristics,
characteristics,
including the specific parameters (k and c), considering all 16 reference sites. Itsites.
including the specific parameters (k and c), considering all 16 reference It is im-
is important
portant to mention that there is no significant variation between the sites,
to mention that there is no significant variation between the sites, although the points although the
points determine
determine a relatively
a relatively extended extended
area. Thearea. Theare
results results
built are
upon built
the upon
ERA5the ERA5
values values
(January
1979 to December 2020) and provide insight into the distribution of the wind resources by
intervals and each site’s energy potential. All sites have wind conditions in the range of
6–20 m/s that will significantly increase the power production of an offshore wind turbine.
The most moderate performances are expected for B2 and D2 sites, with wind speed peaks
of approximately 4–5 m/s, while sites A3, A4, B4, and C3 exhibit the highest performances.
Another noteworthy aspect is that none of the sites indicates wind conditions higher than
25 m/s, representing the cut-out threshold for most operational wind generators.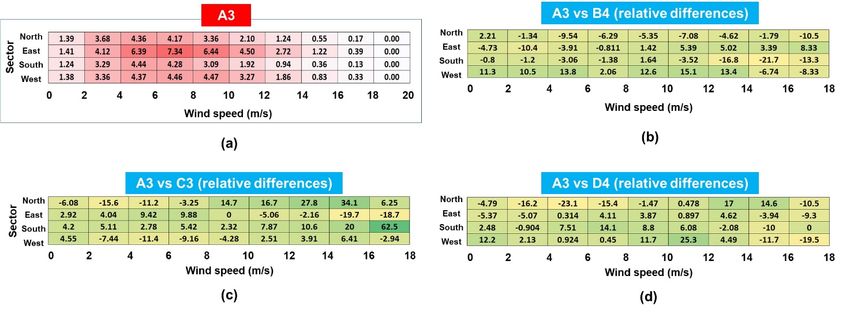
resources by intervals and each site’s energy potential. All sites have wind conditions in
the range of 6–20 m/s that will significantly increase the power production of an offshore
wind turbine. The most moderate performances are expected for B2 and D2 sites, with
wind speed peaks of approximately 4–5 m/s, while sites A3, A4, B4, and C3 exhibit the
Inventions 2021, 6, 41 highest performances. Another noteworthy aspect is that none of the sites indicates 7wind
of 17
conditions higher than 25 m/s, representing the cut-out threshold for most operational
wind generators.
Figure 4. The Weibull distributions corresponding
corresponding to
to the
the ERA5
ERA5 values
values (January
(January 1979
1979 to
to December
December 2020).
2020).
3. Weibull characteristics
Tablecorresponding
Table 3. Weibull characteristics to locationscorresponding
considered. Theto results
locations
areconsidered. The
reported for theresults
U100 are reported for
parameter
the U100
for the time interval from January parameter
1979 for the time
until December 2020.interval from January 1979 until December 2020.
Site A1 A2Site A3
A1 A2 A4 A3 B1 A4 B2
B1 B2 B3 B3 B4B4
k (m/s) 7.04 7.49
k (m/s) 7.81
7.04 7.497.92 7.81 7.067.92 7.38
7.06 7.387.75 7.75 7.87
7.87
c 2.03 2.08c 2.10
2.03 2.082.09 2.10 2.022.09 2.06
2.02 2.062.10 2.10 2.10
2.10
Site C1 C2Site C3
C1 C2 C4 C3 D1 C4 D2
D1 D2 D3 D3 D4D4
k (m/s) 7.12 7.38
k (m/s) 7.82
7.12 7.387.82 7.82 7.207.82 7.46
7.20 7.467.70 7.70 7.80
7.80
c 2.01 2.10c 2.04
2.01 2.102.11 2.04 2.082.11 2.06
2.08 2.062.10 2.10 2.11
2.11
Figure 5 provides the first representation of the wind energy distribution over the
Figure 5 provides the first representation of the wind energy distribution over the
Romanian coastal zone, including the land. The results show that the wind speed in-
Romanian coastal zone, including the land. The results show that the wind speed increases
creases
from from
land land
to the to the shoreline
shoreline and furtherandtofurther to theregion.
the offshore offshore region. Moreover,
Moreover, Figure 5
Figure 5 illustrates
illustrates the full-time and wintertime (December–January–February)
the full-time and wintertime (December–January–February) distribution of the U100 distribution of pa-
the
U100 parameter by wind classes (C1–C7), the higher classes (C4–C7) considered
rameter by wind classes (C1–C7), the higher classes (C4–C7) considered more attractive for more at-
tractive for developing
developing futureprojects
future renewable renewable[27].projects [27]. The organization
The organization of wind
of wind capacities bycapacities
classes is
by classes is highlighted in Table 4, providing a clearer understanding of the
highlighted in Table 4, providing a clearer understanding of the classification. The results classification.
The results
provided inprovided in Figure
Figure 5 are based 5upon
are based
the ERA5uponvalues
the ERA5
fromvalues
Januaryfrom January
1979 1979 until
until December
December 2020. Regardless of the time interval analyzed, it can be noticed
2020. Regardless of the time interval analyzed, it can be noticed that C1 is the prevailing that C1 is the
prevailing wind class present, with values of wind speed smaller than
wind class present, with values of wind speed smaller than 6.10 m/s [31] and distribution 6.10 m/s [31] and
distribution
of of 50–60%,
50–60%, followed followed
closely by theclosely
C7 wind by class
the C7 wind class (characteristic
(characteristic of wind speedsofhigher
wind
speeds
than higher
9.70 m/s than
[31]) 9.70
withm/s [31]) with aofdistribution
a distribution 12–20% (total of 12–20%
time) and (total time)(wintertime),
14–24% and 14–24%
(wintertime), As
respectively. respectively.
expected, theAs expected,
winter seasonthe winter
is highly season
proneis to
highly
moreprone
wind to morevalues
speed wind
speed values close to C6 and C7 wind classes and less of C1 compared
close to C6 and C7 wind classes and less of C1 compared to the total time distribution. to the total time
distribution.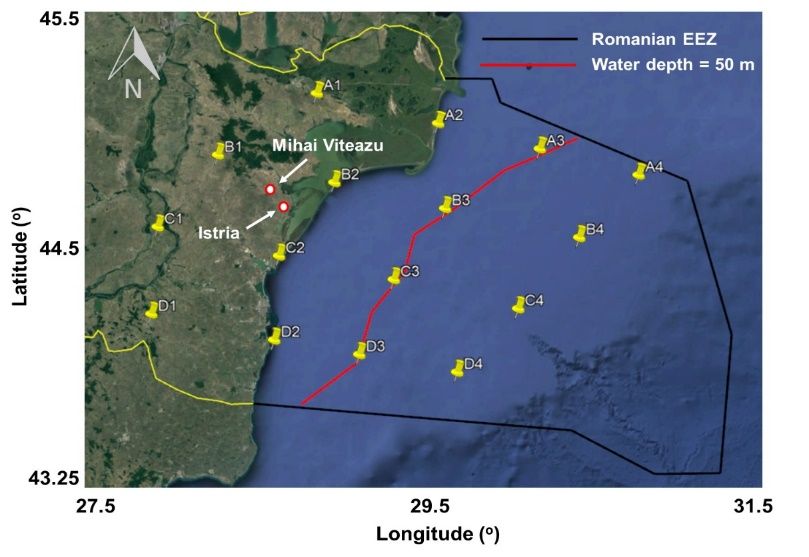
C1 (poor)                                      9.7

                                  Figure 5.5. Distribution
                                  Figure      Distribution of   theU100
                                                            of the  U100parameter
                                                                           parameterbybywind
                                                                                         windclasses
                                                                                               classes(January 1979
                                                                                                        (January    to to
                                                                                                                 1979  December 2020),
                                                                                                                          December 2020),
                                  where: (a)  Total time values;  (b) winter values.
                                  where: (a) Total time values; (b) winter values.

                                  Table 4. Wind classification at 100 m, processed from Oh et al. [31].
                                      Figure 6 presents the spatial distribution of the monthly and annual mean wind
                                  speed values (U100 parameter) based on the ERA5
                                                                                100 mdata reported
                                                                                      Reference    for 1979–2020, the refer-
                                                                                                Height
                                           Wind Class
                                  ence sites A1, A4, D1, and D4, respectively. These2 four maps highlight that the wind
                                                                 Power Density (W/m )            Wind Speed (m/s)
                                  speeds slightly increase as we approach the offshore area, although there are no
                                             C1 (poor)                            9.7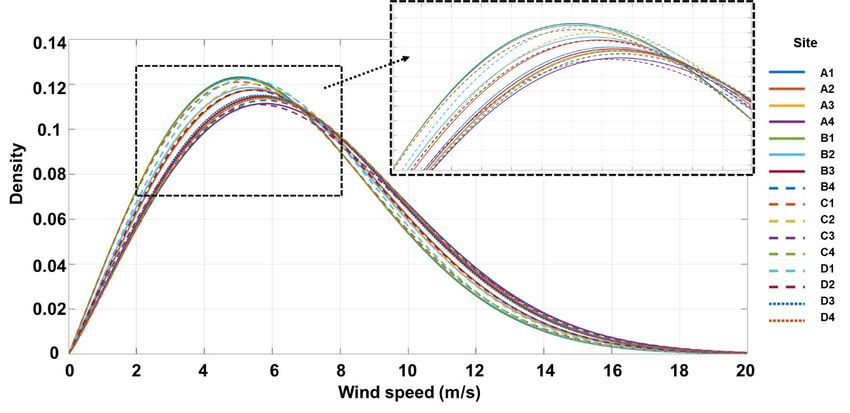
Inventions 2021, 6, 41 9 of 17
Inventions 2021, 6, x FOR PEER REVIEW Figure 6 presents the spatial distribution of the monthly and annual mean wind speed 9 of 18
values (U100 parameter) based on the ERA5 data reported for 1979–2020, the reference sites
A1, A4, D1, and D4, respectively. These four maps highlight that the wind speeds slightly
increase as we approach the offshore area, although there are no significant differences.
significant differences. From the analysis of the parameter U100, it can be noticed that the
From the analysis of the parameter U100, it can be noticed that the wind speed values
wind speed values corresponding to the offshore sites are steadier and more resourceful,
corresponding to the offshore sites are steadier and more resourceful, especially during the
especially during
winter season the winter season (December–January–February),
(December–January–February), where there are constant where
values ofthere
9–10are con-
m/s,
stant values of 9–10 m/s, suggesting that during the most energetic season (winter),
suggesting that during the most energetic season (winter), a wind project located offshore a wind
project located
will obtain theoffshore will obtain The
best performances. the best performances.
average wind speed The average
value wind parameter
is a relevant speed value
is in
a relevant parameter
this context in this context
since it indicates since
what type of it indicates
wind turbinewhat type
is most of wind
suitable forturbine is most
the analyzed
suitable
coastalfor the analyzed coastal climate.
climate.
Figure
Figure 6. Monthly
6. Monthly andannual
and annualdistribution
distribution of theU100
ofthe U100(average values)
(average reported
values) between
reported January
between 1979 and
January December
1979 2020;
and December
(a) site A1; (b) site A4; (c) site D1; (d) site D4.
2020; (a) site A1; (b) site A4; (c) site D1; (d) site D4.
Anothercritical
Another criticalparameter
parameter is is the
the wind
wind direction,
direction,represented
representedininFigure
Figure 7 for sites
7 for A3,
sites A3,
B4, C3, D4, considering the 42-year time interval from January 1979 to December 2020,
B4, C3, D4, considering the 42-year time interval from January 1979 to December 2020,
distributed by wind speeds. Each site has a different energy pattern, indicating for A3 a
distributed by wind speeds. Each site has a different energy pattern, indicating for A3 a
significant contribution coming from the offshore area from the north-eastern sector (7.34%)
significant contribution coming from the offshore area from the north-eastern sector
with wind speeds in the range 6–8 m/s. Compared to A3, the B4 site appears to have
(7.34%)
a higherwith wind
share speeds
of wind in the from
resource rangethe6–8 m/s. Compared
southern sector, andtoD4
A3,from
the the
B4 site appears
western one, to
have a higher share of wind resource from the southern sector, and D4 from
especially wind speeds between 10–12 m/s. It seems that, stepping further into the offshore the western
one, especially
zone, the windwind
fields speeds between
are oriented to the10–12 m/s. direction.
southwest It seems that, stepping
Moreover, further
the wind into the
direction
offshore zone,
represents an the windviewpoint
essential fields are oforiented to the
the design of southwest
a wind farm, direction. Moreover,
considering that the the wind
energy
direction
produced represents an essential
is significantly viewpoint
influenced of theeffect’.
by the ‘wake designAccording
of a windto farm,
[32],considering
it is estimated that
the energy
that produced
the total is significantly
losses could reach 10–25% influenced by the
for offshore ‘wake effect’. According to [32], it
projects.
is estimated that the total losses could reach 10–25% for offshore projects.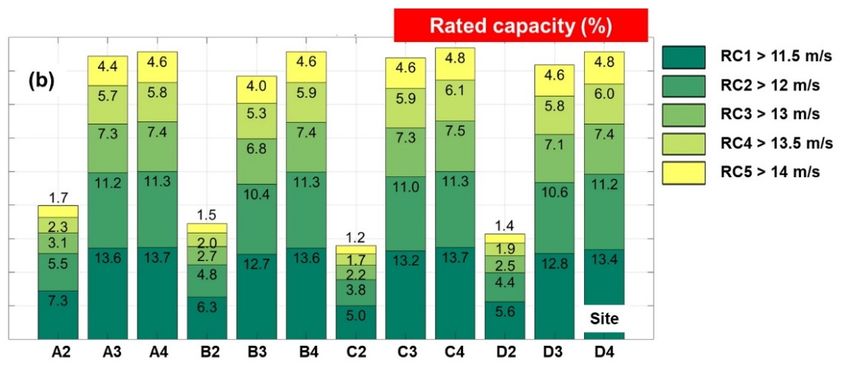
Inventions 2021, 6, 41 10 of 17
Inventions 2021, 6, x FOR PEER REVIEW 10 of 18
Figure7.7.Distribution
Figure Distributionofofthe
thewind
windconditions
conditions(U100)
(U100)by bywind
windspeed
speedandanddirections,
directions,considering
consideringthe
the42-year
42-yeartime
timeinterval
interval
from
fromJanuary
January1979
1979totoDecember
December2020.
2020.Results
Resultsfor:
for:(a)
(a)A3-joint
A3-jointdistribution;
distribution;(b–d)
(b–d)differences
differences(in
(in%)
%)reported
reportedbetween
betweenA3 A3
andthe
and thesites
sitesB4,
B4,C3,
C3,and
andD4,D4,respectively.
respectively.AApositive
positivevalue
valueindicates
indicatesthat,
that,for
forA3,
A3,compared
comparedto tothe
theother
othersites,
sites,aahigher
higher
sharecorresponds.
share corresponds.
3.2.Evaluation
3.2. Evaluationofofthe theWind
WindTurbine
TurbinePerformances
Performances
The first
The firstparameter
parameteranalyzed
analyzed isisthe theoperating
operatingcapacity
capacity(in (in%),
%),which
whichindicates
indicatesthe the
percentage
percentage of theof the total time during which the specific system will perform
time during which the specific system will perform at its total at its total ca-
pacity. This
capacity. Thisparameter
parameteris iscomputed
computedbased basedupon uponthe thecut-in
cut-inspeed—the
speed—theinitialinitialpoint
pointat
which
at which thethewind
wind turbine
turbine generates
generates electricity;
electricity; andand
thethe cut-out
cut-outspeed, which,
speed, for for
which, most mostsig-
significant offshorewind
nificant offshore windturbines,
turbines,isisset
settoto2525m/s,
m/s,except
exceptfor forthe
theV100–2.0
V100–2.0(T1),(T1),which
whichhas hasa
acut-out
cut-outspeed
speedofof22 22m/s
m/s(see(seeTable
Table2).2).When
Whena asystem
systemreaches
reachesthe thecut-out
cut-outspeed,
speed,it itisisset
setto
to shutdown
shut downtotoprevent
preventirreversible
irreversibledamage.
damage. FigureFigure 8a8a illustrates that the the most
mostsatisfying
satisfying
performances
performanceswere wereobtained
obtainedininthe thenorth-eastern
north-easternpart partofofthe
thetarget
targetarea,
area,atatreference
referencepoints
points
A3
A3 and A4, with a maximum value of 88.30% for the system Samsung S7.0-171,which
and A4, with a maximum value of 88.30% for the system Samsung S7.0-171, whichhas has
aacut-in
cut-inspeed
speedof of33m.m.AsAsthethecut-in
cut-inspeed
speedincreases
increasesfromfrom33toto4 4m/s, m/s,aaslight
slightdecrease
decreaseinin
operating
operating capacity
capacity isis visible (80.10% for
visible (80.10% for A3A3 and
and80.30%
80.30%for forA4).
A4).TheTheleast
leastattractive
attractive site,
site, in
in thiscase,
this case,isisrepresented
representedby byC2,
C2,regardless
regardless of of the
the cut-in
cut-in speed
speed (77.10%
(77.10% whenwhen thethecut-in
cut-in
speed
speedisis44m/s).
m/s).
Secondly,
Secondly,the therated
ratedcapacity
capacity(in (in%) %)highlights
highlightsthe themaximum
maximumperformance
performanceof ofeacheach
system, for which only the wind conditions located between the
system, for which only the wind conditions located between the rated speed and cut-out rated speed and cut-out
values
valueswere
wereassessed.
assessed.In InFigure
Figure8b,8b,the
theevolution
evolutionof ofthis
thisparameter,
parameter,whichwhichdoesdoesnotnotexceed
exceed
13.70%,
13.70%,isisnoticeable.
noticeable.TheThesystems
systemsSamsung
SamsungS7.0-171 S7.0-171(T11)
(T11)and andAMSC
AMSCwt1000dd
wt1000ddSeaTitan
SeaTitan
present
presentthe thebest
bestperformances
performances(their (theirrated
ratedcapacity
capacityisis>11.50
>11.50m/s)m/s)forforthe
thereference
referencepoints
points
A4
A4 and C4 (13.70%), and A3 and B4 (13.60%). The values gradually decreasefor
and C4 (13.70%), and A3 and B4 (13.60%). The values gradually decrease forB2 B2andand
D2,
D2,the
therated
ratedcapacity
capacitybeing
beingin inthe
therange
range5.60–6.30%,
5.60–6.30%,the thelowest
lowestvalue
valuebeing
beingreported
reportedfor for
C2
C2(5%).
(5%).
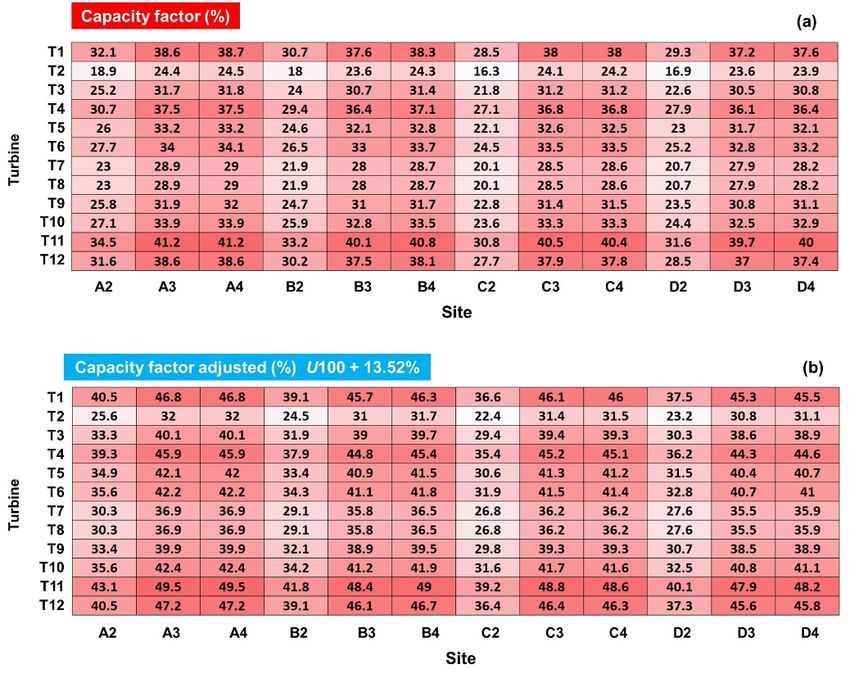
The capacity factor (Cf ), which is used to determine the efficiency of a particular
generator, is presented in Figure 9a, based on the values corresponding to the 20-year time
interval 2000–2019. Closer to shore, near the reference sites A2, B2, C2, and D2, a single
turbine’s capacity factor is in the extent of 16.30% (T2) and 34.50% (T11) and can reach
up to 41.20% (T11) close to the 50 m contour line, near the A3 site. However, there is a
slight improvement regarding the percentage (not even 1%) as the distance from the shore
increases. For example, the Cf increases from 40.10% near reference site B3 to 40.80% near
B4 for the system T11 and from 37.50% to 38.10% for T12, respectively. Nevertheless,
given the fact that it has been considered that the wind measurements used for these
calculations underestimate the wind power potential by 13.52%, Figure 9b illustrates the
results by considering an adjustment of the U100 time series (each value) by 13.52%. Thus,
a maximum value of 48.40% is registered for turbine T11 operating in B3 and 46.10% for
T12. Regarding A3, where the highest values of Cf are located, the adjusted results report aInventions 2021, 6, 41 11 of 17
49.50%
Inventions 2021, 6, x FOR PEER REVIEW for T11 and 47.20% for T12. On the other hand, C2 and D2 sites represent the 11less
of 18
attractive solutions for a wind project, regardless of the type of generator chosen.
Figure8.8.Performances
Figure Performancesofofthe
theselected
selectedwind
windturbines,
turbines,for
forthe
thetime
timeinterval
intervalfrom
fromJanuary
January2000
2000toto
December2019.
December 2019.Results
Resultsindicated
indicatedfor:
for:(a)
(a)Operating
Operatingcapacity;
capacity;(b) (b)rated
ratedcapacity.
capacity.The
TheOCOCand
andRCRC
selection are based on the most frequent cut-in and rated speed values indicated
selection are based on the most frequent cut-in and rated speed values indicated by the current by the current
offshore wind turbines (see Table 2).
offshore wind turbines (see Table 2).
Theestimation
The capacity factor (CfAEP
of the ), which is usedin
is shown to Figure
determine
10, the
the efficiency of a particulartogen-
values corresponding a
erator,
single is presented
wind in Figure
turbine. The analysis 9a,ofbased on the
the total timevalues corresponding
data reveals to the 20-year
that, generally, time
high rated-
interval
power 2000–2019.
turbines, suchCloser to shore, wt10000dd
as T12-AMSC near the reference
SeaTitan,sites A2,
will B2,exceed
not C2, and an D2, a single
output of
33.80 GWh/year for the two sites that stand out regarding the wind energy potential—A3up
turbine’s capacity factor is in the extent of 16.30% (T2) and 34.50% (T11) and can reach
to 41.20%
and A4—based(T11)onclose
thetoECMWF
the 50 mdata contour line, near
considered forthe
theA3 site. However,
interval 2000–2019. there is a slight
However,
improvement regarding the percentage (not even 1%) as the
when considering an adjustment of 13.52% of the U100 time series, the AEP index distance from the shoreforin-
creases.
T12 couldFor example,
reach the CGWh/year
up to 41.30 f increases from 40.10%
for both sitesnear reference site
as highlighted B3 to 40.80%
in Figure 10b (A3nearis
B4 for the
situated at asystem
distanceT11ofand
49 kmfrom 37.50%
from shoretoand
38.10%
A4 atfor T12,
100 respectively.
km). The secondNevertheless,
best performancegiven
theattributed
was fact that itto
has been
T11, considered
indicating that
sites A3,the
A4,wind measurements
B4, and C4 with theused for these
following calculations
results: 25.20,
underestimate
25.30, 25, and 24.80theGWh/year,
wind power potential by
respectively. 13.52%, Figure
Nevertheless, upon9banillustrates
adjustment theofresults
13.52%, by
considering an adjustment of the U100
T11 could reach a substantial 30.30 GWh/year value. time series (each value) by 13.52%. Thus, a maxi-
mum value of 48.40% is registered for turbine T11 operating in B3 and 46.10% for T12.
Regarding A3, where the highest values of Cf are located, the adjusted results report a
49.50% for T11 and 47.20% for T12. On the other hand, C2 and D2 sites represent the less
attractive solutions for a wind project, regardless of the type of generator chosen.Inventions 2021, 6, 41 12 of 17
Inventions 2021, 6, x FOR PEER REVIEW 12 of 18
Figure Capacityfactor
9. Capacity
Figure 9. factorcomputed
computed forfor different
different windwind turbines
turbines andand
sitessites corresponding
corresponding to theto20-year
the 20-year time interval
time interval 2000–
2000–2019. The results
2019. The results are indicated
are indicated in terms
in terms of:C(a)
of: (a) Cf —expected
f —expected values
values basedbased on ERA5
on ERA5 data;
data; (b) (b) adjusted
adjusted Cf considering
Cf by by considering
an
adjustment
an of the
adjustment U100
of the U100time series
time (each
series value)
(each by by
value) 13.52%.
13.52%.
According
The to the
estimation of previous
the AEP is results,
showntwo types of
in Figure 10,wind turbines
the values stand out considering
corresponding to a single
both capacity
wind turbine. factor and theofannual
The analysis electricity
the total time data production, corresponding
reveals that, to the
generally, high shoreline
rated-power
turbines, such as T12-AMSC wt10000dd SeaTitan, will not exceed an output ofresults
and offshore sites that are most suitable for developing wind projects. Based on the 33.80
available for
GWh/year forthe
thetime
twointerval
sites thatfrom
standJanuary 2000 until
out regarding theDecember
wind energy 2019, the top five sites
potential—A3 and
and the twoon
A4—based systems that aredata
the ECMWF the most assuring
considered forregarding the wind
the interval powerHowever,
2000–2019. potential inwhenthe
Romanian coastal
considering zone are of
an adjustment listed in Table
13.52% of the5.U100
As expected, the the
time series, Samsung S7.0-171
AEP index (T11)
for T12 has
could
the highest
reach capacity
up to 41.30 factor for
GWh/year forthe
bothsites located
sites offshore, in
as highlighted namely
FigureA3,10bA4,
(A3B4, C3, and at
is situated C4,
a
with values of the C in the range of 40.40–41.20%. Moreover,
distance of 49 km from shore and A4 at 100 km). The second best performance was at-
f the AMSC wt10000dd
SeaTitan to
tributed (T12)
T11,reported
indicating thesites
highest
A3, AEP,
A4, B4,ranging
and C4 from
with33.10 to 33.80 GWh
the following for sites
results: 25.20,C4 and
25.30,
A3, respectively. All in all, A3 seems to be the most attractive solution
25, and 24.80 GWh/year, respectively. Nevertheless, upon an adjustment of 13.52%, T11 since the other four
sites are
could defined
reach by a higher
a substantial 30.30water depth value.
GWh/year (>50 m). However, the installation of floating
wind turbines might be a viable solution in areas with water depths that do not allow the
implementation of fixed systems.Inventions 2021, 6, 41 13 of 17
Inventions 2021, 6, x FOR PEER REVIEW 13 of 18
Annual Electricity
Figure 10. Annual Electricity Production
Production(in(inGWh)
GWh)expected
expectedtotobebeprovided
providedbybythe
thewind
wind turbines
turbines considered
considered forfor
thethe inter-
interval
val 2000–2019.
2000–2019. Results
Results indicated
indicated in terms
in terms of:AEP—expected
of: (a) (a) AEP—expectedvaluesvalues based
based on ERA5
on ERA5 data;data; (b) adjusted
(b) adjusted AEPAEP by consid-
by considering
ering
an an adjustment
adjustment of the of the time
U100 U100series
time series (each value)
(each value) by 13.52%.
by 13.52%.
TableAccording to the previous
5. Top five capacity factor andresults, two types of
AEP corresponding wind
to the turbines
shoreline andstand out
offshore considering
sites, excluding
both capacity factor and the annual electricity production, corresponding to the shoreline
the points A1, B1, C1, and D1. Results available for the time interval from January 2000 until
and offshore
December sites that are most suitable for developing wind projects. Based on the results
2019.
available for the time interval from January 2000 until December 2019, the top five sites
and the two systems thatA3—T11
Site/Turbine are the mostA4—T11
assuring regarding
B4—T11the wind power potential
C3—T11 C4—T11 in the
Romanian coastal
Capacity factor (%) zone are listed
41.20 in Table 5.
41.20 As expected,
40.80 the Samsung
40.50 S7.0-171 40.40 has
(T11)
the highest capacity factor for the sites located offshore, namely A3, A4, B4, C3, and C4,
Site/Turbine A3—T12 A4—T12 B4—T12 C3—T12 C4—T12
with values of the Cf in the range of 40.40–41.20%. Moreover, the AMSC wt10000dd SeaTi-
AEP (GWh) 33.80 33.80 33.40 33.20 33.10
tan (T12) reported the highest AEP, ranging from 33.10 to 33.80 GWh for sites C4 and A3,
respectively. All in all, A3 seems to be the most attractive solution since the other four
sites Since
are defined
there isbycurrently
a higherno water depth (>50
operational m). However,
offshore the installation
wind project in the BlackofSea floating
zone,
the purpose
wind turbinesof the following
might section
be a viable is to identify
solution in areasthe expected
with waterAEP (in that
depths GWh) doofnot
a wind
allow farm
the
that replicates theofFantanele–Cogealac
implementation fixed systems. project (600 MW capacity) for the 12 reference sites
considered. Thus, Figure 11 presents the equivalent number of necessary wind turbines
Table 5. Top five capacity factor and the
to cover AEPFantanele–Cogealac
corresponding to the shoreline
project andand the
offshore sites, excluding
estimated the points
AEP generated. AsA1, B1,
expected,
C1, and D1. Results available for 60
only thesystem
time interval
AMSCfrom January 2000
wt10000dd untilwill
SeaTitan December
ensure2019.
A3 and A4 sites an AEP of 2028 GWh,
while 86 turbine Samsung S7.0-171 will provide for the same sites 2167 GWh. As assumed,
Site/Turbine A3—T11 A4—T11 B4—T11 C3—T11 C4—T11
the number of turbines significantly increases as the rated power drops. Hence, for system
Capacity factor (%) 41.20 41.20 40.80 40.50 40.40
T1, 300 turbines will be necessary to guarantee 2031 GWh for site A3. By studying the
Site/Turbinecurrent European offshore A3—T12 sector, A4—T12
the tendency for B4—T12
the marineC3—T12
environment C4—T12
is to adopt
AEP (GWh) large-scale wind turbines 33.80for cost-effectiveness
33.80 33.40 33.20
purposes. Consequently, 33.10with
systems
low-rated capacities will no longer be considered an attractive solution.
Since there is currently no operational offshore wind project in the Black Sea zone,
the purpose of the following section is to identify the expected AEP (in GWh) of a windpected, only 60 system AMSC wt10000dd SeaTitan will ensure A3 and A4 sites an AEP of
2028 GWh, while 86 turbine Samsung S7.0-171 will provide for the same sites 2167 GWh.
As assumed, the number of turbines significantly increases as the rated power drops.
Hence, for system T1, 300 turbines will be necessary to guarantee 2031 GWh for site A3.
Inventions 2021, 6, 41 By studying the current European offshore sector, the tendency for the marine environ-
14 of 17
ment is to adopt large-scale wind turbines for cost-effectiveness purposes. Consequently,
systems with low-rated capacities will no longer be considered an attractive solution.
Figure 11.
Figure Expected AEP
11. Expected AEP (in
(in GWh)
GWh) indicated
indicated by
by aa wind
wind farm
farm that
that replicated
replicated the
the Cogealac–Fantanele
Cogealac–Fantanele project
project (600
(600 MW
MW
capacity). Results corresponding to the interval 2000–2019, where, for example, T2 (200) means that from 200 wind
wind turbines
turbines
(V100–3.0) a total of 994 GWh will be generated for the site A2.
4. Discussion
4. Discussion
According to
According to the
the Statistical
Statistical Review
Review of of World
World Energy [33], Romania’s primary energy energy
consumption and coal
consumption coal production
productionhad haddecreased
decreasedfromfrom2.80
2.80EJEJinin1989
1989toto
0.20 EJEJ
0.20 at at
thethe
end of
end
2019
of and
2019 from
and 2.60
from EJ to
2.60 EJ 0.15 EJ, EJ,
to 0.15 respectively. On On
respectively. the the
other hand,
other the electricity
hand, generation
the electricity gener-
from renewable
ation sources—hydroelectricity,
from renewable sources—hydroelectricity, solar, solar,
and wind—reveals
and wind—reveals an ascending trend,
an ascending
with the highest peak of 0.03 EJ recorded in 2017 [33]. Considering
trend, with the highest peak of 0.03 EJ recorded in 2017 [33]. Considering the time interval the time interval
2008–2018, however,
2008–2018, however, the the growth
growth rate
rate in
in wind
wind power
power generation
generation is is more
more than
than 104%
104% [33].
[33].
The foreseeable future of the energy market represents a constant topic
The foreseeable future of the energy market represents a constant topic of debate, espe- of debate, especially
in the in
cially EUthe
countries, which which
EU countries, constantly establish
constantly objectives
establish and performance
objectives criteria that
and performance are
criteria
currently stipulated in the European Green Deal, focusing on the
that are currently stipulated in the European Green Deal, focusing on the near future,near future, 2021–2050.
Generally, the
2021–2050. discussions
Generally, concentrateconcentrate
the discussions on topics such as thesuch
on topics effects of global
as the effects warming,
of global
the strategies for ensuring energy security, and a sustainable
warming, the strategies for ensuring energy security, and a sustainable future future based upon
basednet-zero
upon
greenhouse gas emissions. The most affordable way to support these
net-zero greenhouse gas emissions. The most affordable way to support these policies policies is to identify
is
renewable
to energy sources,
identify renewable energysuch as those
sources, from
such as the marine
those fromenvironment, where it is possible
the marine environment, where
ittoisdevelop
possiblelarge-scale
to developprojects.
large-scaleAs projects.
discussedAsindiscussed
this study,inonethisofstudy,
the most
one ofeconomical
the most
energy sources
economical is offshore
energy sourceswind, wherewind,
is offshore brand-new
wheretechnical
brand-new solutions have
technical already have
solutions been
submitted, such as the emerging floating platforms that can operate in deep water.
already been submitted, such as the emerging floating platforms that can operate in deep
The purpose of this work is to identify the most significant wind conditions in the
water.
Romanian coastal environment so that an offshore wind farm could become operational
The purpose of this work is to identify the most significant wind conditions in the
soon. The outcome of this research study is based on the ERA5 data, and from the assess-
Romanian coastal environment so that an offshore wind farm could become operational
ment of the U100 index, it is noticeable that the wind assets are more attractive offshore
soon. The outcome of this research study is based on the ERA5 data, and from the assess-
than onshore, heedless of the period considered. Given that Fantanele–Cogealac, located
ment of the U100 index, it is noticeable that the wind assets are more attractive offshore
in the Dobrogea region, is the largest onshore wind farm in Europe and represents ap-
than onshore, heedless of the period considered. Given that Fantanele–Cogealac, located
proximately double the largest ever existing European wind farm (600 MW) is more than
in the Dobrogea region, is the largest onshore wind farm in Europe and represents
inspiring for the offshore wind market in Romania [34]. An important aspect that requires
more detailed investigation is that offshore wind development across Europe, onshore
grid access, and infrastructure pose serious challenges [20]. For example, any offshore
wind farm developed in the Romanian waters will have to be connected to the grid in
Dobrogea, where a significant part of the country’s renewable power generation assets
is already situated [20]. According to the NECP [7], some additional GW of renewable
energy—primarily wind power—are expected to be produced in the already congested
Dobrogea region.
In connection with some other related previous studies [3,21,22], this one embodies
one of the first studies that evaluate the Romanian wind potential relying on the new
ECMWF product—ERA 5. Even though it is used to estimate the resourcefulness ofInventions 2021, 6, 41 15 of 17
renewables, due to the relatively low resolution of the global model, it is reasonable to
somehow underestimate the wind speed in some coastal zones (Mihai–Viteazu and Istria
sites for the Black Sea—see Figure 3). Other constraints of the ERA5 datasets in the coastal
areas of the North Sea are further highlighted in Kalverla et al. [35]. It is necessary to
mention that most reanalysis datasets are provided at a standard height of 10 m [36],
which is proper for evaluating the wind conditions from a meteorological point of view.
A significant part of the previous studies evaluated the wind conditions in the Black Sea
coastal zone at a height of 80 m (U80), where older-generation wind turbines used to
operate [17]. The innovative feature of ERA5 is that it provides wind data directly at 100 m,
admitting that this is a reference height for the offshore industry [7,37]; therefore, there is
no need for further adjustments that could discredit the results.
On balance, considering the wind speed and water depth conditions, the study points
out that the most suitable sites for the development of an offshore wind project appear to
be located close to the 50 m contour line, thus bypassing any interference with shipping
routes and port activities [38]. Furthermore, the figures indicated for the capacity factor
of the most attractive offshore wind systems are in line with other values reported at the
European level (around 40%). They could be even higher (almost 50%), acknowledging
the underestimation of 13.52% of the wind speed data reported compared with the in situ
measurements considered for this study (see Figure 3).
5. Conclusions
In the present work, the Romanian coastal zone’s wind energy resources from the
Black Sea region were evaluated by considering some environmental parameters (such
as U100) and some relevant technical features of some state-of-the-art wind turbines
that either operate or are currently implemented within several offshore wind projects.
Based on the ERA5 wind datasets considering the 42-year time interval from January 1979
to December 2020, it was possible to outline the dominant energy patterns of the target
area, thus revealing the most appropriate hot spots for developing renewable wind energy
designs. The results reveal an upward trend concerning relevant wind conditions when
approaching the offshore zone from the land, implying that an offshore project might
become a certainty shortly.
During wintertime, which is the most energetic season, the average wind speed
can frequently reach and overcome 9 m/s, values that are related to the International
Electrotechnical Commission (IEC) classes II and III. The present work reveals that higher
wind resources are characteristic in the northern part of the target area, where the capacity
factor of the Samsung S7.0-171 system frequently registers a value of about 40% and
can reach up to 41.20%, close to the 50 m depth contour line, near the A3 site, which is
situated 49 km from the shore. Considering the proximity of some of the attractive sites
for developing a wind project to the Port of Constanta and its facilities, these sites become
compatible in terms of accessibility for both the development process and operation and
maintenance activities. For example, opposed to fixed offshore turbines, floating platforms
require constructing a different infrastructure for their installation, since elements are
regularly assembled onshore and then towed to the offshore site. Moreover, floating
turbines must be brought back to ports for some critical operations and maintenance
activities. From this perspective, Romania’s Port of Constanta can play a significant role
in developing floating wind turbines in the Black Sea coastal zone. Furthermore, it could
represent an enabling factor for tapping into uncharted territories represented by offshore
fields, thus generating new business opportunities and jobs.
To obtain a comprehensive picture of the wind energy potential, an entire portfolio of
offshore wind turbines had to be assessed to identify the most representative systems for
this geographical region. Thus, another direction of this study was related to the evaluation
of the performances provided by some wind turbines covering a full spectrum of rated
capacities, in the range of 2–10 MW, being in line with other values reported from offshore
wind farms at the European level.You can also read


