Analysis and tools to support energy system transition - RENAC
←
→
Page content transcription
If your browser does not render page correctly, please read the page content below
Analysis and tools to support energy system transition
Knowledge-exchange between US and German power system operators

                                                                                                  Philipp Härtel, Dr. Malte Siefert, Denis Mende
                                 Energy Economy and Grid Operation, Fraunhofer Institute for Wind Energy and Energy System Technology (IWES)

Delegation Trip to Germany
Berlin, September 28, 2017

Härtel, P., Siefert, M., Mende, D., Berlin, September 28, 2017                  1
© Fraunhofer IWES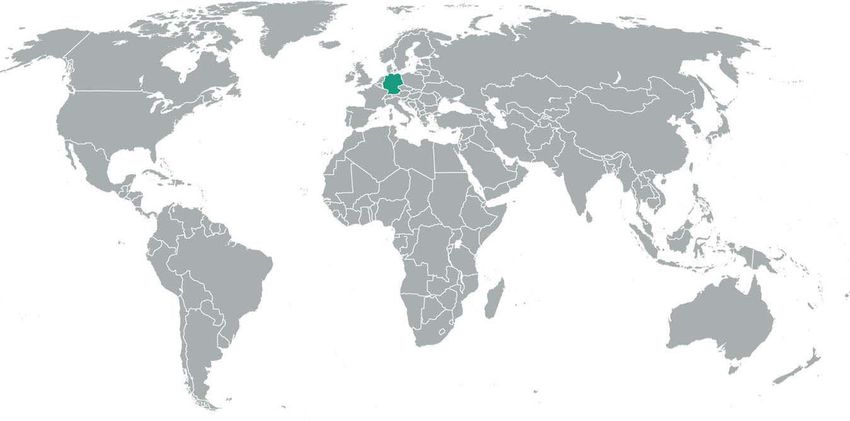
Agenda

    I       What is Fraunhofer-Gesellschaft and Fraunhofer IWES?

    II      Developing Long-Term Scenarios with High Levels of Decarbonisation                            (Philipp Härtel)

   III Current Challenges of the Integration of Large Amounts of Wind and Solar Power                  (Dr. Malte Siefert)

  IV Technical Challenges and Prospects in Power Systems with High Penetration of Renewable Energies      (Denis Mende)

   V Training and Knowledge Transfer at Fraunhofer IWES

Härtel, P., Siefert, M., Mende, D., Berlin, September 28, 2017     2
© Fraunhofer IWES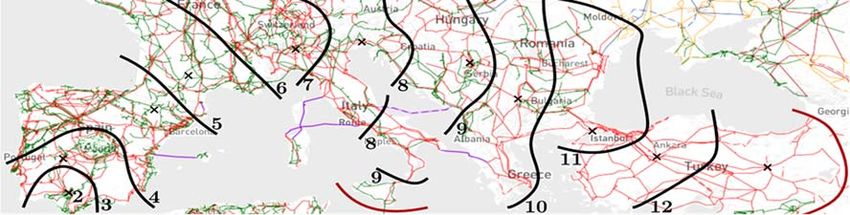
Agenda

    I       What is Fraunhofer-Gesellschaft and Fraunhofer IWES?

    II      Developing Long-Term Scenarios with High Levels of Decarbonisation

   III Current Challenges of the Integration of Large Amounts of Wind and Solar Power

  IV Technical Challenges and Prospects in Power Systems with High Penetration of Renewable Energies

   V Training and Knowledge Transfer at Fraunhofer IWES

Härtel, P., Siefert, M., Mende, D., Berlin, September 28, 2017     3
© Fraunhofer IWES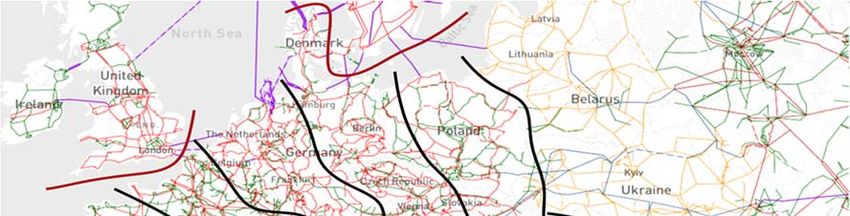
Fraunhofer-Gesellschaft conducts applied research and comprises 66 institutes across Germany
Fraunhofer-Gesellschaft
Itzehoe Rostock
Lübeck
Europe‘s largest applied research organisation
Bremerhaven
Bremen
Undertakes research for direct use
Hannover Berlin
by private and public enterprises, Potsdam
Teltow
Braunschweig
Magdeburg
providing a wide range of Cottbus
Oberhausen Halle
benefits to society Duisburg
Dortmund Kassel Schkopau
Leipzig
Schmallenberg Dresden
St. Augustin Jena
80 research units, including 66 Fraunhofer Institutes Aachen
Euskirchen Chemnitz
Wachtberg Ilmenau
Staff of around 24,500 Darmstadt
Würzburg
Erlangen
St. Ingbert
Kaiserslautern Fürth Nürnberg
Annual research budget of around 2.1 bnEUR SaarbrückenKarlsruhe
Pfinztal
Ettlingen
Stuttgart
Freising
Freiburg München
Holzen Holzkirchen
Efringen-
Kirchen
Härtel, P., Siefert, M., Mende, D., Berlin, September 28, 2017 4
© Fraunhofer IWES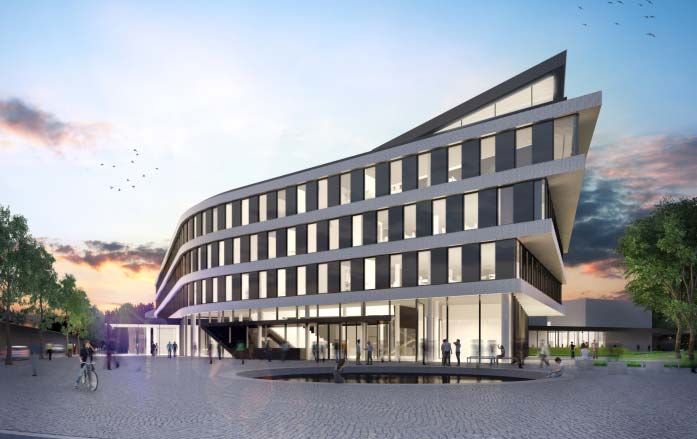
Fraunhofer has several locations and contact possibilities worldwide
Gothenburg
Stockholm
Glasgow
Dublin Nijmegen
Brussels Enschede
Vienna
Hamilton Budapest
Bolzano Graz
London
East Lansing
Plymouth Boston Porto Beijing Seoul
Sendai
San José Storrs
Tokyo
Newark Lavon Ulsan
Osaka
Cairo Jerusalem
Bangalore
Kuala Lumpur
Singapore
Jakarta
Salvador
Campinas São Paulo Pretoria
Subsidiary Stellenbosch
Santiago de Chile
Center
Project Center Auckland
ICON / Strategic cooperation
Representative / Marketing Office
Senior Advisor
Härtel, P., Siefert, M., Mende, D., Berlin, September 28, 2017 5
© Fraunhofer IWES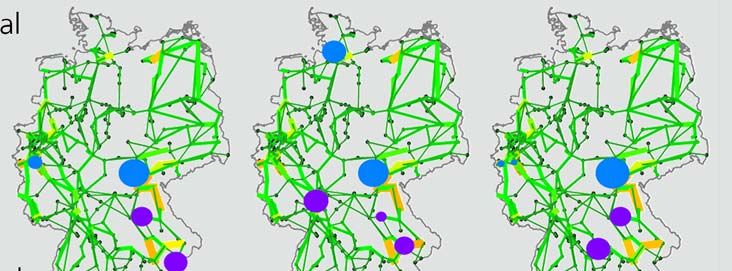
The Energy System Technology branch of Fraunhofer IWES is located in Kassel
Our service portfolio deals with current and future challenges faced by the
energy industry and energy system technology issues.
We explore and develop solutions for sustainably transforming
renewable based energy systems.
Personal: approx. 310
Annual budget: approx. 22 Mio EUR
Director: Prof. Dr. Clemens Hoffmann
www.energiesystemtechnik.iwes.fraunhofer.de
Härtel, P., Siefert, M., Mende, D., Berlin, September 28, 2017 6
© Fraunhofer IWES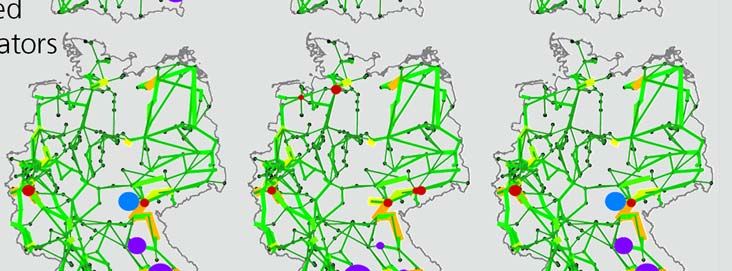
We research and develop solutions in different fields of expertise

                                                                               Device and System Technology
                                   Energy
                                   Informatics                                                Electrical Grids

                                                                                  Energy Process Engineering

                                                                         Energy Economics and System Design

                                                                 Energy Meteorology and Renewable Resources

Härtel, P., Siefert, M., Mende, D., Berlin, September 28, 2017             7
© Fraunhofer IWES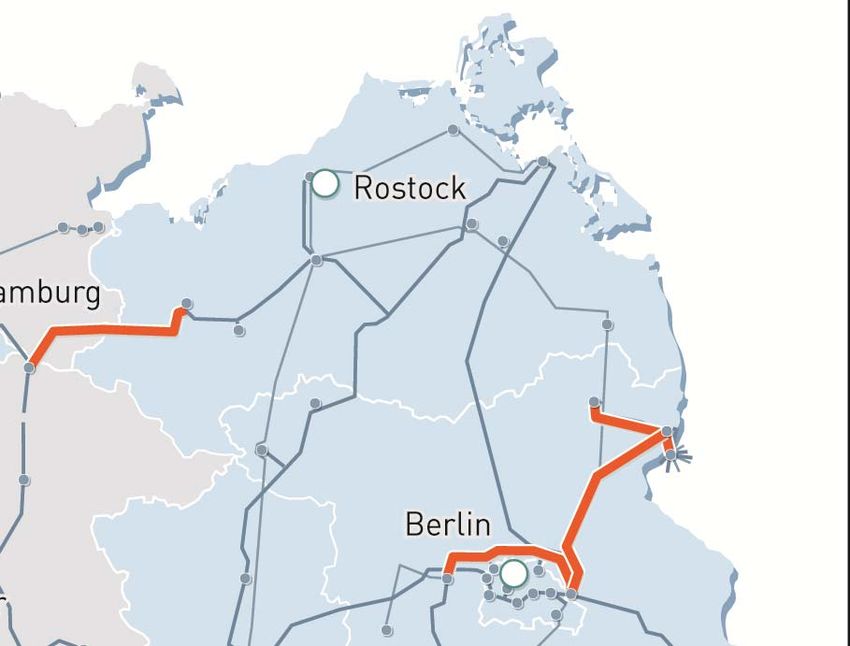
Energy Economics and Energy System Technology are our two business areas
Energy System Technology
Power electronics and devices
Grid planning and operation
Energy Economics
Measurement and test services
Energy meteorological information systems
Decentralised energy management
Consulting and analyses in energy economics
Hardware-in-the-loop systems
Virtual power plants
Systems engineering
LiDAR Wind measurements
Training and knowledge transfer
Härtel, P., Siefert, M., Mende, D., Berlin, September 28, 2017 8
© Fraunhofer IWES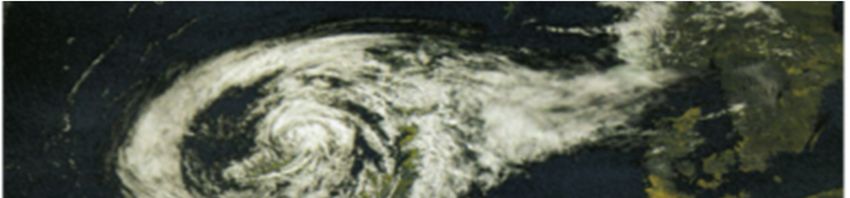
Agenda

    I       What is Fraunhofer-Gesellschaft and Fraunhofer IWES?

    II      Developing Long-Term Scenarios with High Levels of Decarbonisation                         (Philipp Härtel)

   III Current Challenges of the Integration of Large Amounts of Wind and Solar Power

  IV Technical Challenges and Prospects in Power Systems with High Penetration of Renewable Energies

   V Training and Knowledge Transfer at Fraunhofer IWES

Härtel, P., Siefert, M., Mende, D., Berlin, September 28, 2017     9
© Fraunhofer IWES
Energy Economy and System Analysis Group at Fraunhofer IWES mainly answers its research questions
with the SCOPE model family
Research focus SCOPE model family
Dynamic simulation of power markets in Germany and Europe
Scenario development for energy system transformation towards
decarbonisation
Technology evaluations in future energy markets (particularly. at sector
coupling interfaces power – heat und power - mobility)
Grid and storage expansion analyses
Sector-wide dispatch and expansion planning model for analyses of future
energy supply systems
Current projects
Modular and customisable techno-economic fundamental market model
with various configurations
North Seas Offshore Network (NSON-DE), BMWi, 2014 – 2017 e.g. block-specific unit commitment (day-ahead, balancing reserve),
Treibhausgasneutrales Deutschland, UBA, 2016 – 2018 Expansion planning of grids and units (TEP/ GEP)
Klimawirksamkeit Elektromobilität, BMUB, 2016 – 2018 Implemented in MATLAB, solved by IBM ILOG CPLEX on IWES-owned
http://publica.fraunhofer.de/documents/N-439079.html High-Performance Computing Cluster
Wärmewende 2030, AGORA, 2016
http://bit.ly/2kDMHst
Interaktion EE-Strom-Wärme-Verkehr, BMWi, 2012-2015
http://publica.fraunhofer.de/documents/N-356297.html
Härtel, P., Siefert, M., Mende, D., Berlin, September 28, 2017 10
© Fraunhofer IWESLong-term climate targets are very ambitious and decarbonisation challenges the energy sectors –
promising solution via sector coupling technologies based on wind and solar power
Germany
1200
International transport
Historical Target
1000 LULUCF1)
Emissions in Mio. tonnes CO2eq.
800 Energy sector
Complying with COP21 Paris agreement requires emission
-80% vs. 1990 levels
-95% vs. 1990 levels
Challenge
reductions in the range of 80-95% vs. 1990 levels,
600 Domestic transport implying consequences for the energy sector:
Power Heat Transport
Industry heat
400
Building heat
200
Solution
Coupling of energy sectors with key technologies
to use renewable power generation (i.e. wind and solar)
Power sector
as the main primary energy source in the future
0
Non-energy emissions
-200
2010 2011 2012 2013 2014 2050 2050
1) Land use, land-use change and forestry (LULUCF)
Härtel, P., Siefert, M., Mende, D., Berlin, September 28, 2017 11
© Fraunhofer IWESHeat pumps and electric vehicles are key technologies for coupling of energy sectors – they increase
the energy efficiency and substitute fossil fuels
Power Heat Transport
Fossil fuel power plant Gas fired boiler Internal combustion engine
Efficiency 40% Efficiency 85% Efficiency 25-40%
Losses
Losses
Today
Losses
Fuel Fuel Fuel
Heat
Power
Driving power
Wind and solar energy Heat pump Electric powertrain
Efficiency 100% Efficiency 340% Efficiency 80%
Losses
Tomorrow
Losses
External
Renewable environment Renewable
Power
power heat Power Driving power
Heat
Renewable
Power
Härtel, P., Siefert, M., Mende, D., Berlin, September 28, 2017 12
© Fraunhofer IWESOne SCOPE configuration serves the development of cost-optimised target scenarios of future energy
systems with energy and emission targets
Input data Linear Optimization Model (LP)1) Output data
Fuel cost Europe and/ or Germany Optimised power generation mix
Technology cost Objective is to Optimised heat generation mix
minimise investment and
Potentials and restrictions system operation cost Optimised transport mix
Energy demand time series (power, heat, industry, subject to compliance with Energy framework and installed capacities
transport) climate protection targets CO2 emission price(s)
Technology-specific time series (wind, solar, natural full consecutive year, …
inflow, COP, solar thermal, …) hourly resolution (8760h)
historical climate reference years
Markets
Heat markets CO2 markets
Gas markets
Power market (various building types and Mobility demand (national/ international,
(national/ international)
temperatures) sector-specific)
Technology options
Wind, Solar Energy storage Power-to-Gas BEV PHEV/ REEV
Hydro power Cogeneration Cooling process Boiler Electric truck (OHL)
Condensing Plant Power-to-Heat Heat pump Solar thermal Geothermal
1) Static and deterministic Generation Expansion Planning (GEP) model.
Härtel, P., Siefert, M., Mende, D., Berlin, September 28, 2017 13
© Fraunhofer IWESPower sector sees higher volumes as it is expected to supply the heat and transport sector in order to
fulfil climate targets in the overall energy sector (-87.5% carbon emissions vs. 1990 level)
900 Curtailment
Other Net import Germany
Power demand
800 Electric trucks NSON 2050
increases due to CHP (Cogeneration CCGT)
Additional power demand
Target scenario
new consumption BEV/ PHEV/ REEV
from heat and Waste and sewage
700 transport sector Air conditioning Hydro (ROTR, CHS, PHS)
600 Heat pumps (decentralised)
Onshore wind
(strong + low wind turbines)
500 Power-to-Heat
Centralised/ industry heat pumps
400
Renewable energy generation is
the main source of energy
300 Offshore wind with only limited generation from
conventional power plants
Conventional
200
100 Solar PV
(rooftop + utility-scale)
0
Consumption Generation
Härtel, P., Siefert, M., Mende, D., Berlin, September 28, 2017 14
© Fraunhofer IWESEXEMPLARY Exemplary week shows integration of renewable energy production through sector coupling – heat and transport sector introduce flexibility and directly use electricity Härtel, P., Siefert, M., Mende, D., Berlin, September 28, 2017 15 © Fraunhofer IWES
A similar pattern becomes visible for the other market areas in Europe – conventional generation is
reduced to natural gas (mainly CHP) and existing nuclear plants by 2050
      1000
                                                                                                                    Generation/ Import/ Curtailment
       800

       600
                                                                                                                                                      Curtailment
                                                                                                                                                      Net import
                                                                                                                                                      CHP
       400                                                                                                                                            CCGT
                                                                                                                                                      OCGT
                                                                                                                                                      Waste/ Geothermal
       200                                                                                                                                            Hydro
                                                                                                                                                      Onshore wind
                                                                                                                                                      Offshore wind
                                                                                                                                                      Solar PV
           0                                                                                                                                          Conventional
                                                                                                                                                      Power-to-Gas
                                                                                                                                                      Power-to-Heat/ Industry-HP
      -200                                                                                                                                            Heat pumps
                                                                                                                                                      Air conditioning
                                                                                                                                                      BEV, PHEV, REEV
      -400                                                                                                                                            Electric trucks
                                                                                                                                                      Storage losses
                                                                                                                                                      Net export
                                                                                                                                                      Grid losses
      -600

      -800
                                                                                                                       Consumption/ Export/ Losses
    -1000
                    AUT       BEL     CHE CZE           DEU DNK   ESP   FIN   FRA   GBR HUN   IRL   ITA   LUX NLD NOR POL   PRT   SVK SVN SWE

Härtel, P., Siefert, M., Mende, D., Berlin, September 28, 2017                                      16
© Fraunhofer IWES
EXEMPLARY
Long-term scenarios with high levels of decarbonisation bring along challenges for planning tools
which are designed to investigate more specific subjects
0 Multi Market Area Dispatch and Offshore Grid Expansion Model
Onshore market area
Schematic Load coverage of residual load
60 N
Technical restrictions of the hydro-thermal plants
Technical restrictions of other flexibility options (e.g. as battery storage,
1.40 1[-]
flexible CHP, electric mobility)
.40 [- ]
]
0 [-
1.4
Offshore grid region (area)
]
[17
[-]
86
40
Load coverage/ node balance of offshore hubs with wind generation/
11.
1.
curtailment/ storage
1.40
[-]
Investment decision variables in offshore grid infrastructure
1.40 [-]
[5]
8.40
0
9.10 [13]
3.5
[12]
[9]
6.15
4.11 [6
Power exchange between areas
]
Im-/ export between onshore market areas
18.
5]
1.40
06
[5 [26
0 ]
.5 [-]
[-]
38 1.40
3.50 [5
[5]
Im-/ export between onshore market areas and offshore grid region
3.5
2.99 3 [6
]
]
[-]
40
18.
70 1.
[27
]
1.
[-]
52 ]
[30 [-
1.0
1.00
]2
.62
[4]
Omitting sector coupling and its interaction in planning tools
focussing on e.g. offshore grid investments is not an option
Modelling (and solution) challenges are amplified even more
Härtel, P., Siefert, M., Mende, D., Berlin, September 28, 2017 17
© Fraunhofer IWESKey messages regarding long-term energy scenario development in Germany and Europe
Focus used to be on reaching renewable shares in the traditional power sector Challenges for power system planning and operation models
and making use of surplus energy to adequately address future system flexibility
Coupling the traditional power sector with heat / industry / transport sectors from a methodological perspective
is crucial to decarbonise the energy supply system and
comply with climate targets
Limitations and assumptions:
Generation from wind and solar will be the main source of energy Installed capacities are optimised to the absolute minimum
as simulations show its feasibility and LCOE are continuing to go down by the deterministic generation expansion planning model
(particularly conventional generation capacities)
Current alternatives expected to play a complementary role
Biomass, solar thermal, geothermal Presented scenario is to be seen as a lower bound
since e.g. balancing reserve markets are not included
Technology efficiency is still an important issue Flexibility of the new consumers is assumed as a given
although there are good wind and solar potentials across Europe, implying that they see some kind of flexibility signal
but social acceptance imposes limits
High efficiency sector coupling technologies already relevant today European balancing via the electricity market is a vital assumption
such as heat pumps & electric vehicles as it facilitates significant balancing between regions
Low efficiency sector coupling technologies become relevant in the long-term
such as Power-to-Heat & Power-to-Gas
Härtel, P., Siefert, M., Mende, D., Berlin, September 28, 2017 18
© Fraunhofer IWESAgenda
I What is Fraunhofer-Gesellschaft and Fraunhofer IWES?
II Developing Long-Term Scenarios with High Levels of Decarbonisation
III Current Challenges of the Integration of Large Amounts of Wind and Solar Power (Dr. Malte Siefert)
IV Technical Challenges and Prospects in Power Systems with High Penetration of Renewable Energies
V Training and Knowledge Transfer at Fraunhofer IWES
Härtel, P., Siefert, M., Mende, D., Berlin, September 28, 2017 19
© Fraunhofer IWESCURRENT CHALLENGES OF THE INTEGRATION OF LARGE
AMOUNTS OF WIND AND SOLAR POWER
Virtual Power Plant RES Forecast
Malte Siefert
power
time
Härtel, P., Siefert, M., Mende, D., Berlin, September 28, 2017 20
© Fraunhofer IWESIntroduction - German power system
2050
2035 >80%
~55%
2025
~40%
Top-down Optimization Bottom-up
Härtel, P., Siefert, M., Mende, D., Berlin, September 28, 2017 21
© Fraunhofer IWESIntroduction - The Challenges Renewables replaces conventional power production Intermittent character of wind and PV Grid operation more sophisticated Resource planning more sophisticated Security of supply Balancing of supply and demand Grid security Ancillary services from RES reactive power (voltage stability) control reserve (frequency stabilization) Holistic view on energy system Activation of flexibility sector coupling Härtel, P., Siefert, M., Mende, D., Berlin, September 28, 2017 22 © Fraunhofer IWES
VIRTUAL POWER PLANT– RENEWABLE ENERGY PRODUCTION
OF THE FUTURE

Härtel, P., Siefert, M., Mende, D., Berlin, September 28, 2017   23
© Fraunhofer IWES
Introduction – New role portfolio manager (Energy trade)
Feed‐in tariff
380/220 kV
TSO
VPP operator
110 kV
DSO A manages portfolio
Use cases
energy trading (CVPP)
110 kV Portfolio grid support (TVPP)
DSO B
Benefits
Data ownership
Feed‐in tariff
Portfolio optimization
Roles: TSO, DSO, customer, plant operator, RE plant operator, energy trader
Härtel, P., Siefert, M., Mende, D., Berlin, September 28, 2017 24
© Fraunhofer IWESVirtual Power Plant (VPP) - Definition “A virtual power plant is a cluster of dispersed generator units, controllable loads and storages systems, aggregated in order to operate as a unique power plant. The generators can use both fossil and renewable energy source. The heart of a VPP is an energy management system (EMS) which coordinates the power flows coming from the generators, controllable loads and storages. The communication is bidirectional, so that the VPP can not only receive information about the current status of each unit, but it can also send the signals to control the objects.” Source: Virtual Power Plant (VPP), Definition, Concept, Components and Types, Saboori, 2011, IEEE Härtel, P., Siefert, M., Mende, D., Berlin, September 28, 2017 25 © Fraunhofer IWES
Virtual Power Plant (VPP) - Architecture

Härtel, P., Siefert, M., Mende, D., Berlin, September 28, 2017   26
© Fraunhofer IWES
Virtual Power Plant (VPP) – Aggregation level
wind farms
OPC DA Server
Communication interface
Standardization useful and needed
Communication protocols
TCP/IP based
Communication technologies photovoltaic plants
DSL, LTE, GSM, satellite communication OPC DA Server
Communication security
VPN
Web security
closed user groups
point to point connections
Biogas plants
Typical requested data IEC 60870-5-104
CHP
P, Q, storage, weather information, VHP Ready
possible power feed-in
Bidirectional connection, push/pull
Härtel, P., Siefert, M., Mende, D., Berlin, September 28, 2017 27
© Fraunhofer IWESVirtual Power Plant (VPP) – Business logic level
Metering interface to portfolio
Database
External systems
Database
Business logic-kernel
Optimization of business cases Business logic-kernel
Unit commitment
Calculation of schedules Unit commitment
Calculating of operating points
Interfaces to external IT-infrastructure,
Interface to portfolio
Härtel, P., Siefert, M., Mende, D., Berlin, September 28, 2017 28
© Fraunhofer IWESVirtual Power Plant (VPP) – Integration level
Graphical user interfaces
Graphical user interface
Monitoring systems
External IT systems
Customer dependent (In case of utility SAP for
accounting, etc.)
External IT
Forecast systems Redundant
Power feed-in from fluctuating sources,
vpp
Grid operation
load forecasts
price forecasts for different markets
External trading systems
Grid operation Forecast systems
State information
requests for control reserve power
Härtel, P., Siefert, M., Mende, D., Berlin, September 28, 2017 29
© Fraunhofer IWESVirtual Power Plant (VPP) – Relevant research and cooperation projects (examples)
VPP as a substitution of
conventional power plants
(European research – FENIX,)
Control reserve power with wind and PV,
Optimization of revenues
(National funded research – ReWP)
Aggregation of 700 MW renewable energies
Portfolio in Germany
(Cooperation – ARGE-Netz GmbH)
Conceptualization of a Virtual Power Plant
(VPP) in India
(International research/cooperation with ICF)
Härtel, P., Siefert, M., Mende, D., Berlin, September 28, 2017 30
© Fraunhofer IWESFORECAST SYSTEMS FOR THE INTEGRATION OF LARGE
AMOUNTS OF WIND AND SOLAR POWER
Projects:
EWeLiNE (2013-2017)
Gridcast (2017-2021)
Härtel, P., Siefert, M., Mende, D., Berlin, September 28, 2017 31
© Fraunhofer IWESCooperation between weather service and network operators
weather forecast power forecast application of
power forecast
Francis McLloyd
Seite 32
Härtel, P., Siefert, M., Mende, D., Berlin, September 28, 2017
© Fraunhofer IWES
32Improvements along the whole forecast chain
DWD Francis McLloyd
DWD
Weather Post Power Post
assimilation application
forecast processing forecast processing
Seite 33
Härtel, P., Siefert, M., Mende, D., Berlin, September 28, 2017
© Fraunhofer IWES
33Problem description
RES forecast for congestion forecast becomes one of the
most important forecast for TSO in Germany
Operational planning: forecasting the future system
state + actions →
System state parameters: node voltage and branch
current
→ →
Risks can be captured with uncertainty information (risk
for (n-1)-violation) PV
Further Need: operational planning process which is
capable of integrating uncertainties
Härtel, P., Siefert, M., Mende, D., Berlin, September 28, 2017 34
© Fraunhofer IWESMost of the RES plants are connected to DSO-level
TSO TSO
~
DSO DSO
~ ~
PV PV
Härtel, P., Siefert, M., Mende, D., Berlin, September 28, 2017 35
© Fraunhofer IWESThe challenge
1. Estimating the actual RES feed-in
into transformer stations
2. Forecasting the RES feed-in
into transformer stations
3. Estimating the reduced production of RES plants
4. Improved allocation of RES plants to transformer stations
and integration of the grid sate
5. Quantification of the forecast uncertainties
6. Testing the results by functional models
Härtel, P., Siefert, M., Mende, D., Berlin, September 28, 2017 36
© Fraunhofer IWESUncertainty Forecast for Congestion Management
Thermal overload? Overloaded
Overload with
not 30%
probability
recognized
Deterministic forecast: „No“.
Reality: „Yes“.
Ensemble recognize possible overload.
calibrated ensemble
50
45
40
35
Power
30
Leistung
25
20
15
10
5
0
1345 1350 1355 1360 1365 1370 1375 1380 1385 1390 1395
Zeit
Zeit
Härtel, P., Siefert, M., Mende, D., Berlin, September 28, 2017 37
© Fraunhofer IWESOne congestion forecast for each scenario
estimation of critical system states
N=1 N=2 N=3 N=3
Critial state
Critical state
→ → → →
→ → → → → → →
PV PV PV
Härtel, P., Siefert, M., Mende, D., Berlin, September 28, 2017 38
© Fraunhofer IWESFraunhofer is Europe’s largest application-oriented research organization.
Our research results are proven in practice
Forecast Systems Virtual Power Plant
Härtel, P., Siefert, M., Mende, D., Berlin, September 28, 2017 39
© Fraunhofer IWESAgenda I What is Fraunhofer-Gesellschaft and Fraunhofer IWES? II Developing Long-Term Scenarios with High Levels of Decarbonisation III Current Challenges of the Integration of Large Amounts of Wind and Solar Power IV Technical Challenges and Prospects in Power Systems with High Penetration of Renewable Energies (Denis Mende) V Training and Knowledge Transfer at Fraunhofer IWES www.energiesystemtechnik.iwes.fraunhofer.de © Fraunhofer IWES
Renewables in the German power system
Installed capacity Power supply (August 2017)
Installed capacity of renewables sharply increased in recent years
Installed capacity constant respectively slightly decreasing (changing to cold reserve)
Varying share of renewables in power supply due to intermittend primary resources
Source: https://www.energy-charts.de. Accessed September 25, 2017.
Härtel, P., Siefert, M., Mende, D., Berlin, September 28, 2017 41
© Fraunhofer IWESSystem ancillary services – classical provision and new challenges System services classically provided by conventional power plants, but oftentimes not yet required by RES RES need to participate in system services to keep system qualities up Source: dena Ancillary Services Study 2030. https://www.dena.de/en/topics-projects/projects/energy-systems/dena-ancillary-services-study-2030. Accessed September 25, 2017. Härtel, P., Siefert, M., Mende, D., Berlin, September 28, 2017 42 © Fraunhofer IWES
Frequency control in power systems with high penetration of renewables (I/III)
Frequency control ensured by conventional generators
Rotating masses lead to instantaneous frequency support
Primary control ensures new stable operating point due to
increased power output
Further control leads to constant frequency at nominal value
RES decoupled from grid frequency due to inverter-based grid
connection
No direct coupling to frequency
Only over-frequency support (reduction of power)
Under-frequency support would mean active power reserves
Investigations on frequency control and frequency supporting
functionalities become more and more essential
Examples
Demonstration of control reserve with renewables: Project
Combined Power Plants: http://www.kombikraftwerk.de
Challenges in grid modeling (next slide)
Frequency supporting functionalities (inertia & primary control) in
wind turbines (2 slides ahead)
Source: According to https://commons.wikimedia.org/wiki/File:Schema_Einsatz_von_Regelleistung.png. Accessed September 25, 2017. Own drawings.
Härtel, P., Siefert, M., Mende, D., Berlin, September 28, 2017 43
© Fraunhofer IWESFrequency control in power systems with high penetration of renewables (II/III)
Challenges in power system modeling Above Balancing model (one rotating mass, no tie lines)
Example Middle -12
12„balancing“
„balancing“models
modelswith
withtie
tielines
linesand
andenhanced
enhanced
Reduced inertia leads to increased requirements to power modeling (rotor angle, …)
system models 50 % inertial generation
Balancing model vs. enhanced modelling of large power Below -12
12„balancing“
„balancing“models
modelswith
withtie
tielines
linesand
andenhanced
enhanced
systems modeling
modeling(rotor angle, …)
-10
10%%inertial
inertialgeneration
generation
Reduced system inertia calls for enhanced models and new
modeling concepts
Pictures from: Schittek: Augmented block diagram model for investigating primary-control performance at low inertia, Master's thesis, Fraunhofer IWES, 2017. In Progress.
Härtel, P., Siefert, M., Mende, D., Berlin, September 28, 2017 44
© Fraunhofer IWESFrequency control in power systems with high penetration of renewables (III/III)
pmax pref max max
Frequency supporting functionalities of RES f grid
Modelling of wind turbines with frequency supporting functionalities (FSF)
pmeas
pmin min min
Study cases in power system models
1
Example: IEEE 39 bus system, Generator outage, RES w/o FSF (StatGen, DFIGres) 1 s T1
ref pmax pmax
k df s T pdf df RSC
pref
1 s T
pmin p min
1,00
f (pu)
0,98
Gen
0,96 StatGen
DFIGres
0,94
0 20 40 60 80 100 120
750
700
P (MW)
650 Gen
StatGen
DFIGres
600
0 20 40 60 80 100 120
See also: Mende, Hennig, Akbulut, Becker, Hofmann: Dynamic Frequency Support with DFIG Wind Turbines – A System Study‘, IEEE EPEC, Ottawa, 2016. DOI: 10.1109/EPEC.2016.7771694.
Härtel, P., Siefert, M., Mende, D., Berlin, September 28, 2017 45
© Fraunhofer IWESOptimized grid operation in power systems with high penetration of renewables (I/III)
New challenges in grid operation due to increased flexibility of
generation and demand
Volatile RES generation profiles IWES.GridMod
(PowerFactory)
Changing power flow patterns Network Modeling
• Modeling of network
Increased ramping requirements (e.g. as known in the US as • Power flow calculation &
„Duck curve“) further analysis methods
• Visualization
Increased demands on coordination between TSO & DSO due to
changed generation location
wind on HV-level enhanced
Validation Matpower /
Topology data
solar pv on MV- and especially LV-level MPC-
format
Optimization Scenario & sensitivity
Optimization approaches allow facing different challenges • Solving of the optimization generator
problem • Feed-in and load situation
Example:
• Reactive power control., • Neigbouring grid parameter
Implementation of optimization algorithms in flexible modules to with voltage profile, losses, … • Power flow sensitivities
possibility of result validation • Active power distribution • Optimization goals
Network modeling (PowerFactory)
Scenario / Sensitivity generator (MatLab / Matpower) IWES.WCMS / IWES.Scenario /
Optimizationdata
IWES.Redispatch IWES.Sens
Optimization environment (GAMS)
(GAMS) (MatLab)
Härtel, P., Siefert, M., Mende, D., Berlin, September 28, 2017 46
© Fraunhofer IWESOptimized grid operation in power systems with high penetration of renewables (II/III)
Example:
Increased demands on optimization and coordination
between TSO & DSO due to changed generation location
Implementation of optimization tool to coordinate and
enhance TSO-DSO-interface
Optimization on DSO-level to provide flexibility potential
at interface to TSO
Optimization on TSO-level using own and TSO-flexibilities
and giving setpoints to DSO
DSO uses RES flexibilities to provide setpoints and new
flexibility potentials
Study case
Larger DSO area in northern Germany with high share of
RES
(Part of) Northern Germany Transmission Grid
Reactive power provision in given limits using different
approaches
Pictures from: Sala: Optimal Reactive Power Management of Wind Farms for Coordinated TSO-DSO Voltage Control, Master’s thesis, Fraunhofer IWES, 2017. In Progress.
Härtel, P., Siefert, M., Mende, D., Berlin, September 28, 2017 47
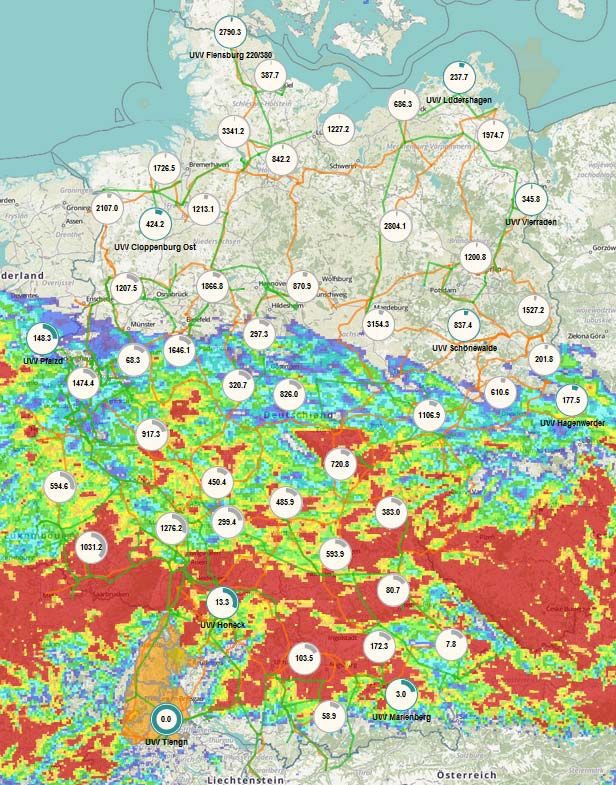
© Fraunhofer IWESOptimized grid operation in power systems with high penetration of renewables (III/III)
European liberalized energy market Conventional
Energy trading doesn‘t take grid restrictions into account
„Trading on a copper plate“
Possibility of large power transmission needs
RES often far away from load centers
RES installation in rural areas with low load
Example: Offshore wind energy Incl. assumed
wind generators
Modular optimization tool to find optimal solution for „re-
dispatching“ power plants
Optimization of costs, powers or multiobbjective goals
including several optimization criteria
Possibility to freely include flexibilities of generation and
load units
Example:
Redispatch according to overloading of lines Comparison
Scenario w/o incorporating wind power plants
Redispatched powers (tech), costs (eco) and combined
optimization using normalization approach (norm)
See also: Akbulut, Mende: Congestion Management Strategy in Combined Future AC/DC System, Fraunhofer IWES, 2017. In: IRP-Wind: Deliverable 81.5 – Congestion Management in combined future AC/DC System.
Härtel, P., Siefert, M., Mende, D., Berlin, September 28, 2017 48
© Fraunhofer IWESRestoration in power systems with high penetration of renewables
Integration of renewable generators in system restoration concepts:
Project Netz:Kraft
Concepts for system restoration
(conventional) black start
Classical restoration units
Opening and enhancing grid island Large (conventional
thermal) blocks
Start of large conventional power plants
Loads
Provision of loads
RES not considered in restoration concepts or are strictly
limited/shut down
Enhanced concepts including RES Concepts for system restoration with RES
Integration of renewable generators in system restoration (conventional) black start
concepts units
Improved planning using forecasts (renewables and load) Large (conventional
thermal) blocks
Increased flexibility and possibilities through frequency
supporting functionalities and reactive power capabilities of Loads
modern renewable generators Renewable
Increasing of robustness of restoration paths generators
See also: https://www.energiesystemtechnik.iwes.fraunhofer.de/de/projekte/suche/laufende/Netzkraft.html. Accessed on September 25, 2017.
Härtel, P., Siefert, M., Mende, D., Berlin, September 28, 2017 49
© Fraunhofer IWESDemonstration of solutions - OpSim
Test- and simulation-environment for grid control and aggregation strategies
Applications ranging from developing prototype controllers to testing operative
control software in the smart grid domain
Features
APIs to connect various simulation tools such as Opal-RT, pandapower,
PYPOWER, MATPOWER or custom scripts in Matlab, Java and Python.
Standard interfaces: VHPready, CIM and IEC 61850.
Scalable environment - runs on desktop PCs and clusters.
Interfaces for hardware-in-the-loop (HIL) tests.
Example
Implementation
of DSO / TSO
operation center
Further Information
www.OpSim.net
See also: www.OpSim.net
Härtel, P., Siefert, M., Mende, D., Berlin, September 28, 2017 50
© Fraunhofer IWESSummary
Transition in electrical energy systems lead to various challenges
Sharp increase in installations as well as in power provision
Varying penetration of renewables & conventional generation
Renewables need to participate in system services such as
frequency control voltage control
system operation system restoration
Frequency control as challenge due to reduced rotating masses
Challenges for modelling
Frequency supporting functionalities and power reserves by RES
Optimization and coordination at the interface of DSO / TSO
Flexible optimization implementations and algorithms
Improved solutions in grid operation and congestion management
Integration of renewable generators in system restoration concepts
Increasing of flexibility and robustness of restoration paths
Using frequency supporting functionalities and reactive power capabilities of RES
Demonstration of system operation strategies and optimization
algorithms
OpSim environment
Härtel, P., Siefert, M., Mende, D., Berlin, September 28, 2017 51
© Fraunhofer IWESAgenda
I What is Fraunhofer-Gesellschaft and Fraunhofer IWES?
II Developing Long-Term Scenarios with High Levels of Decarbonisation
III Current Challenges of the Integration of Large Amounts of Wind and Solar Power
IV Technical Challenges and Prospects in Power Systems with High Penetration of Renewable Energies
V Training and Knowledge Transfer at Fraunhofer IWES
Härtel, P., Siefert, M., Mende, D., Berlin, September 28, 2017 52
© Fraunhofer IWESTraining and Knowledge Transfer at Fraunhofer IWES (I/II)
We offer our "know-how pool" in different
arrangements.
Our target groups include decision-makers, specialists
and executives from business and administration as well
as students.
With our IWES experts and with our broad network of
experts from industry, consulting and universities, we
provide basic and detailed knowledge on the use of
renewable energies.
Characteristics
National as well as international trainings / workshops
Day or week seminars regarding various aspects of renewable energy sources
Online master program and certificate programs Wind Energy Systems
Customer-oriented specific trainings on demand
Härtel, P., Siefert, M., Mende, D., Berlin, September 28, 2017 53
© Fraunhofer IWESTraining and Knowledge Transfer at Fraunhofer IWES (II/II)
Example: Online-training for engineers of TSOs
Wind and Solar Energy Sources Integration in Power Systems
6 Modules
50 lessons
Introduction: Basic Planning considering Long-Term
Market Models and
Concepts of Wind and Wind and Solar PV
System Balancing Planning
Solar PV Energy Power Integration
4 lessons 6 lessons 12 lessons 10 lessons
Homework
Wind and
Operational Analysis Certificate
Solar PV Forecasting
Exam
10 lessons 8 lessons
Härtel, P., Siefert, M., Mende, D., Berlin, September 28, 2017 54
© Fraunhofer IWESThank you very much for your attention!
I What is Fraunhofer-Gesellschaft and Fraunhofer IWES?
II Developing Long-Term Scenarios with High Levels of Decarbonisation (Philipp Härtel)
III Current Challenges of the Integration of Large Amounts of Wind and Solar Power (Dr. Malte Siefert)
IV Technical Challenges and Prospects in Power Systems with High Penetration of Renewable Energies (Denis Mende)
V Training and Knowledge Transfer at Fraunhofer IWES
Härtel, P., Siefert, M., Mende, D., Berlin, September 28, 2017 55
© Fraunhofer IWESThank you very much for your attention!
M.Sc. Philipp Härtel Dr. Malte Siefert Dipl.-Ing. Denis Mende
Energy Economy and Grid Operation Energy Economy and Grid Operation Energy Economy and Grid Operation
Fraunhofer Institute for Wind Energy and Energy Fraunhofer Institute for Wind Energy and Energy Fraunhofer Institute for Wind Energy and Energy
System Technology IWES System Technology IWES System Technology IWES
Königstor 59 | 34119 Kassel Königstor 59 | 34119 Kassel Königstor 59 | 34119 Kassel
Phone +49 561 7294-471 | Fax +49 561 7294-260 Telefon +49 561 7294-457 | Fax +49 561 7294-260 Telefon +49 561 7294-425 | Fax +49 561 7294-260
philipp.haertel@iwes.fraunhofer.de malte.siefert@iwes.fraunhofer.de denis.mende@iwes.fraunhofer.de
Härtel, P., Siefert, M., Mende, D., Berlin, September 28, 2017 56
© Fraunhofer IWESYou can also read