Building a greener web - Patterns and tooling for carbon aware web performance Chris Adams, The Green Web Foundation This talk is online ...
←
→
Page content transcription
If your browser does not render page correctly, please read the page content below

Building a greener
web
Patterns and tooling for carbon aware web performance
Chris Adams, The Green Web Foundation
This talk is online - https://thegreenwebfoundation.org/fosdem
Hello!
I’m Chris. My background:

Loco2 - Low CO2 Travel in Europe by train
A.M.E.E (Avoid Mass Extinction Engine) - CO2 calculation as an API
Icebreaker One - data infrastructure for a net zero future
Spend Network - direct public spending for net zero
Green Web Foundation - make the web green

Hit me up:
chris@thegreenwebfoundation.org
@mrchrisadams
What we’ll cover…

Carbon aware design: what is it, why you might care
Green, Open, Lean, Decentralised (GOLD) - a way to think
about decarbonising digital, with performance in mind.
Next steps - what you can do as a carbon aware technologist
Why carbon aware?

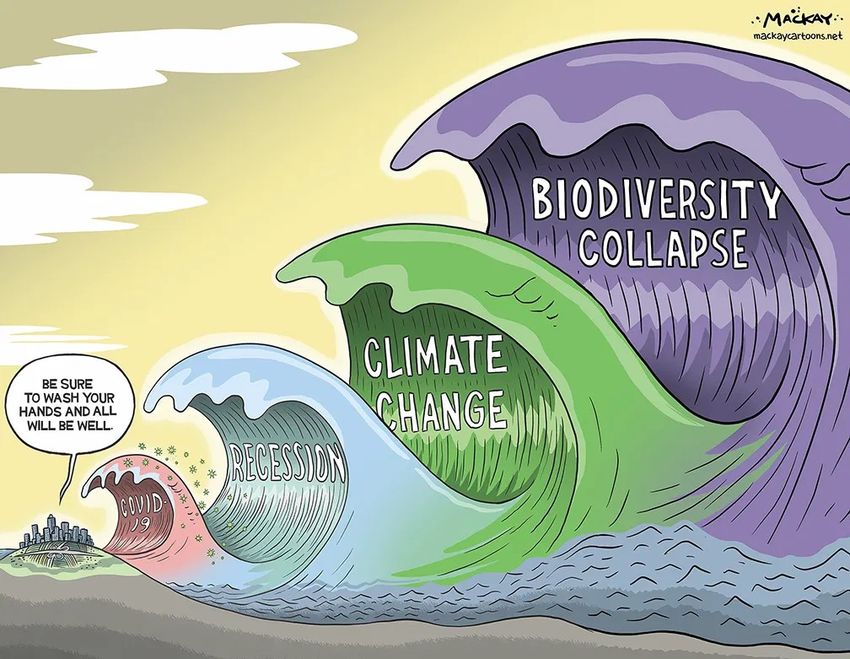
More on the origins of the waves cartoons - (link)
The carbon skyscraper - tracking changes in CO2 in the atmosphere (link)
Rapid.
Far Reaching.
Unprecedented.
   Word for word guidance for policy makers from IPCC on the scale of changes needed (link)
The internet is the
biggest machine in the
world and it mostly runs
on fossil fuels.
Stats for 2019 compared to 2010:
12x as much traffic
7.5x the workloads
~1x the energy usage
Source - IEA, Global data centre energy demand by data centre type, 2010-2022, IEA, Paris (link)

            We might think the carbon footprint has increased. It’s likely that it has reduced over the 10 years (Malmodin 2018)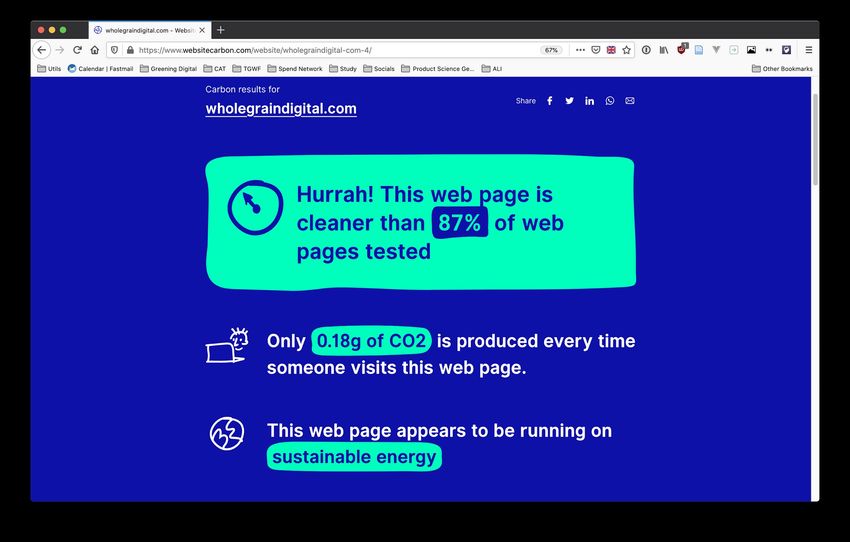
2010                              2019                            2022
                                  194 TWh                           200 TWh                        201 TWh (projected)
 Hyperscale Cloud
                                  10 TWh
 Non-hyperscale                   18 TWh
 Cloud                                                              70 TWh
                                                                                                    93 TWh
 Traditional data
 centres

                                                                    69 TWh
                                 166 TWh                                                            69 TWh

                                                                    61 TWh
                                                                                                    39 TWh

                         Source - IEA, Global data centre energy demand by data centre type, 2010-2022, IEA, Paris (link)

The cost of this efficiency is a less diverse ecosystem (Recalibrating global data center energy-use estimates, Koomey et al)
As gains from hardware alone diminish, there is a greater need to work at the software layer too (link)
We are in a climate crisis
largely because we keep
burning fossil fuels, instead
of finding a path off them
Carbon aware design:
The design of products and services to
minimise the carbon emissions
resulting from their use, over the
lifetime of their existence.
Lessons we can learn from other
         movements
 Inclusive design, and the power of POUR in the accessibility
                         movement.
“ The idea is to create a POUR web
site, so to speak. The pun may be a
bad one, but if it helps developers
memorize the principles, then it has
served its purpose.
Constructing a POUR website (link)Perceivable
Operable
Understandable
Robust
The 4 principles for accessibility WCAG (link)Accessibility and inclusive design as a way to avoid risk (link)
Similar signals from public sector on sustainability as on accessibility (link)
Explicit commitments, and references to supply chain (link)
What POUR look like for a
greener, carbon aware web?
Green
Open
Lean
Distributed
    A way to think about greening digital infrastructure. See also, principles.green (link)
Green as in green energy, and
greener material inputs.
Open For running computers.
And making computers.
Lean
DistributedWebsite carbon - quick figures for the carbon footprint of a website (link)
Website carbon - quick figures for the carbon footprint of a website (link)
Fossil energy versus green, non-fossil energy

        Gas
                           You don’t have control over
                           what others feed into the grid.

        Coal               If you know the mix going into
                           the grid, you can at least
        Wind
                           account for it.

                           This energy comes from the
        Solar
                           wind and sun. No carbon
                           more carbon emissions from
                           burning fuel!
Accounting for fossil fuel energy
Wind Google and Microsoft
Gas do this.
Solar
It’s one of the most
Coal effective ways to
make sure you end up
with a green grid for
Wind everybody.
To say we’re green,
we “top-up” the
power - feeding in
Solar as much green
power as came
from fossil energy.
It’s as if you only
ever used greenAnnual figures vs hourly figures
“An average of ~30 %
per year does not mean
wind turbines are
constantly producing at
30 % capacity every
hour of the year.”
Charts from Bo Tranberg, Entolabs (link)Accounting for fossil fuel energy, on an hour by hour basis
For now, if you’re using the grid, there will still be times where you’re running on fossil fuels.Accounting for fossil fuel energy
Offset just the carbon
Gas emissions
Some companies
do this, too. It’s
Coal much, much
easier than
Wind
understanding
energy markets,
and organisational
change.
Solar
Is this solving the
same problem
though?Green Open open data, open source & transparency. Lean Distributed
Electricity Map takes open data and makes it easy to use via an API
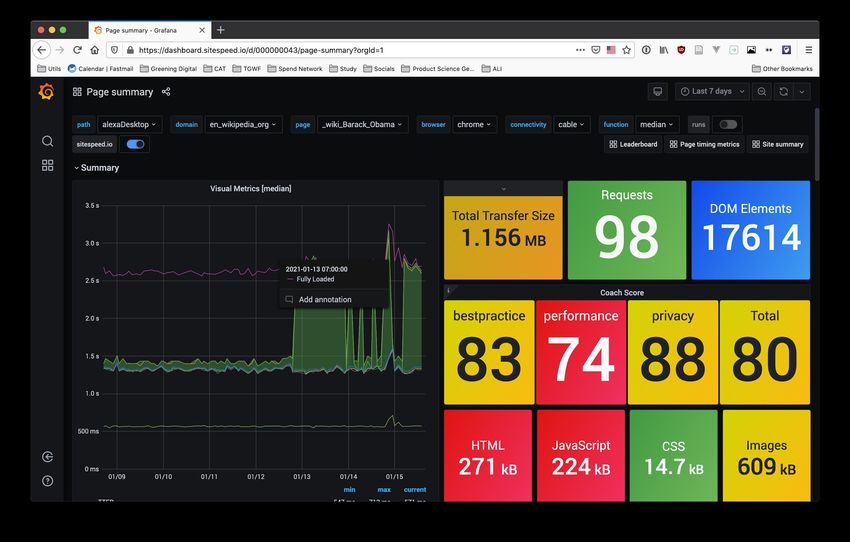
Coach - like lighthouse, but for a web that’s good for more than just google (sitespeed.io)
Building a more sustainable web with sitespeed and the green web foundation (link)
Green
Open
Lean     make the carbon you emit
         count

Distributed
Mozilla’s carbon emissions baseline report (link)
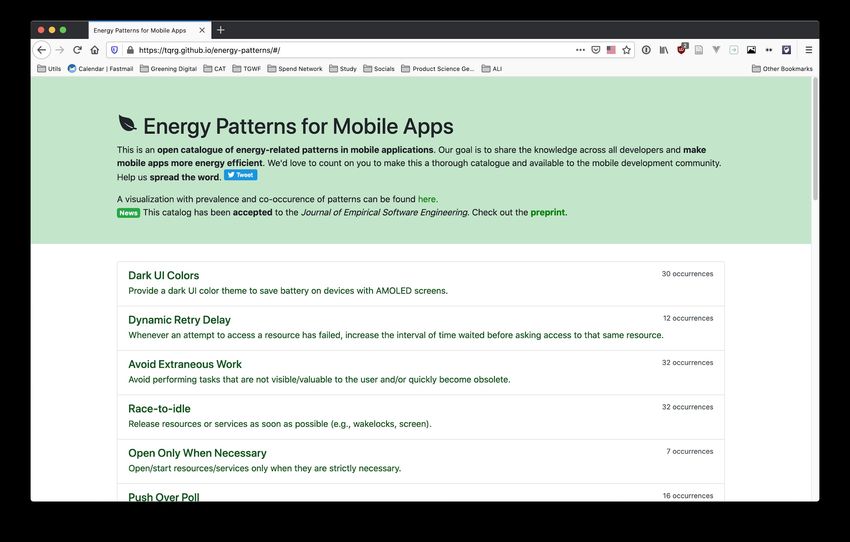
Energy patterns: techniques observed in the wild, from green computing phDs (link)
Tracking web perf stats with sitespeed and grafana
Tracking carbon stats with grafana and sitespeed
Green         move work through time and

Open
              space to avoid carbon
              emissions

Lean
Distributed
The duck curve. When there’s more being generated than can be used, you can be paid to use energy (link)
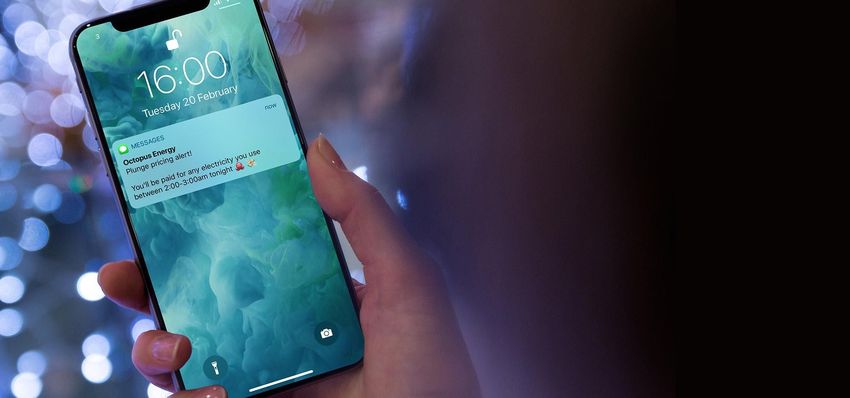
Consumer facing demand pricing with Octopus Energy and their agile tariff (link)
How Google move compute loads through time to when energy is cheap and green (link)
If we can measure carbon,
then we use it as a creative
constraint to work with when
creating designs.

 Branch Magazine - when energy is green, serve the richer experience inside the same carbon budget (link)
Carbon aware progressive
enhancement?

Responsive responsive
design?

Branch Magazine - when energy is more dirty, adjust the design to stay inside the budget and send the key content
Green
Open
Lean
Distributed
    A way to think about greening digital infrastructure. See also, principles.green (link)
Next steps
Becoming carbon aware:

climateaction.tech/letsgreentheweb
Thanks!
climateaction.tech/LetsGreenTheWeb
#LetsGreenTheWeb
@climateActTech

thegreenwebfoundation.org/fosdem
chris@thegreenwebfoundation.org
@mrchrisadams / @greenwebfound
Building a greener
web
Patterns and tooling for carbon aware web performance
Chris Adams, The Green Web Foundation
This talk is online - https://thegreenwebfoundation.org/fosdem

 Hello FOSDEM, welcome to Building a greener web, patterns and tooling for carbon
 aware web performance.

 My name is Chris Adams, and I’m a director of The Green Web Foundation.

 This talk is recorded, so you can always pause me and play again, but the slide deck
 for this talk is also online, along with a transcript, and all the references.
Hello!
I’m Chris. My background:

Loco2 - Low CO2 Travel in Europe by train
A.M.E.E (Avoid Mass Extinction Engine) - CO2 calculation as an API
Icebreaker One - data infrastructure for a net zero future
Spend Network - direct public spending for net zero
Green Web Foundation - make the web green

Hit me up:
chris@thegreenwebfoundation.org
@mrchrisadams

For the last 15+ or so years, I’ve been working a kind of environmentally focussed
tech generalist - doing product management, system administration, design and
development, and mostly for wacky environmental data startups, but one key theme
has been understanding, quantifying and reducing the environmental impact of our
work as digital professionals.

These days most of me time is spent working as one of the directors of the green
web foundation, and if you’d like to work together, my future self should be answering
questions in the chat, but my details are also here.
What we’ll cover…

Carbon aware design: what is it, why you might care
Green, Open, Lean, Decentralised (GOLD) - a way to think
about decarbonising digital, with performance in mind.
Next steps - what you can do as a carbon aware technologist

 During the 30 or so minutes I have, I hope to cover these three topics with you.

 First, I’ll introduce the idea of carbon aware design, and why I think it’s a useful
 concept for an audience of professional technologists to be aware of.

 Next, I want to share with you a mental model I’m working on, to help us think about
 the qualities we would need to see for greener sustainable software.

 Finally, I want to give you some pointers where you can learn more about the subject,
 and find others interested in applying these ideas to build a greener web.
Why carbon aware?

Carbon aware may be a new term to you. If this the cases, chances are you’re in
good company. I only heard it myself last year, but I think it’s a useful one, and I’ll try
explaining why below.
More on the origins of the waves cartoons - (link)

But before i go too deeply into this, I think it’s worth trying to limit the scope of this
talk.

As you might have noticed, we’re in the middle of pandemic, and as this cartoon now
doing the rounds on social suggests, it’s just one of a number of other crisis
unfolding.

The biodiversity collapse happening around is terrifying, and there is more to
sustainability than just carbon.

However I don’t think I can address these well in a talk relating to web performance,
and so I’ll focus on where I think there levers in your work as a professional
technologist.

So, I’m going to focus on carbon.

The source of the cartoon:
https://mackaycartoons.net/2020/03/18/wednesday-march-11-2020/
The carbon skyscraper - tracking changes in CO2 in the atmosphere (link)

Right. Let’s talk about Carbon then.

What I’m showing you here is known as the carbon skyscaper. It’s a useful tool for
understanding the extent to which we’ve changed our ecosystem.

Rather than show the absolute figure of CO2 in the world, it shows how the much the
amount of carbon in the atmosphere has changed over time, and in particular, how
much in the last 100 years it’s shot upwards.

That jump has largely been down to us taking carbon out of the ground in the form of
fossil fuels, and burning it for energy

That energy has been useful - and without it, we wouldn’t have wifi, smartphones, the
internet and so on.

But putting that much carbon into the sky has downsides.

We’re already seeing how many climate-related disasters are happening around us,
and as we put more carbon in the sky they’ll keep getting worse.

So we need to make changes to stop putting carbon in the sky

https://www.climatecentral.org/news/the-carbon-skyscraper?ftag=MSF0951a18
Rapid.
Far Reaching.
Unprecedented.
                Word for word guidance for policy makers from IPCC on the scale of changes needed (link)

The sheer scale of the changes facing are us are daunting, and it’s worth
remembering these words in the reports from the Intergovernmental panel on climate
change, telling us what kinds of changes we need policymakers.

Rapid. Far Reaching. Unprecedented.

When IPCC scientists use words like this, it’s basically the equivalent to them
grabbing us by the ears and yelling in our faces to get our act together, and stop
accelerating towards the iceberg.

The science is literally spelling out how much we need to change our society to avoid
the worst now.

Further links

https://www.ipcc.ch/2018/10/08/summary-for-policymakers-of-ipcc-special-report-on-
global-warming-of-1-5c-approved-by-governments/
https://twitter.com/UN/status/1170820355704799233
The internet is the biggest machine in the world and it mostly runs on fossil fuels. Where does the internet fit into this picture? Most estimates put carbon emissions from the internet, and data centres to be responsible for between 1 and 2% of total global carbon emissions That’s in the same ballpark as aviation, or shipping. Or Canada, or Germany. It’s not small. There are a few reasons for this, but the primarily one s that it mainly runs on fossil fuels right now. Every time we use the net right now, even if we don’t want to, we contribute to climate change. If we didn’t want to to be a driver of climate change, what we would need to do?
Stats for 2019 compared to 2010:
12x as much traffic
7.5x the workloads
~1x the energy usage
Source - IEA, Global data centre energy demand by data centre type, 2010-2022, IEA, Paris (link)

            We might think the carbon footprint has increased. It’s likely that it has reduced over the 10 years (Malmodin 2018)

  Well we can look to where we have had some successes already.

  Moore’s law has been incredibly helpful here - while we’ve seen massive increases of
  usage of compute in the last ten years, we haven’t seen the same growth in total
  energy usage.

  And to be honest, I’d argue that 1-2% of global emissions for all the benefits we’ve
  got so far has been a pretty good deal.

  We get a lot of value from the internet - imagine what this pandemic would be like
  without it!

  https://www.carbonbrief.org/factcheck-what-is-the-carbon-footprint-of-streaming-vide
  o-on-netflix
  https://www.theguardian.com/environment/ng-interactive/2019/oct/25/suvs-second-bi
  ggest-cause-of-emissions-rise-figures-reveal
2010 2019 2022
194 TWh 200 TWh 201 TWh (projected)
Hyperscale Cloud
10 TWh
Non-hyperscale 18 TWh
Cloud 70 TWh
93 TWh
Traditional data
centres
69 TWh
166 TWh 69 TWh
61 TWh
39 TWh
Source - IEA, Global data centre energy demand by data centre type, 2010-2022, IEA, Paris (link)
The cost of this efficiency is a less diverse ecosystem (Recalibrating global data center energy-use estimates, Koomey et al)
It’s worth looking at why we haven’t seen this growth in energy use though.
Most of the gains, have come from ever cheaper, ever more powerful hardware being
able to do more work for the same energy usage, and you can see this most clearly
our transition to the cloud.
Ten years ago, most servers were in traditional style datacentres, but these days,
there is a clear shift to larger, more efficient, hyperscale cloud ones.
Because the larger providers work at a greater scale to smaller datacentres, and are
able to invest more in their design of the hardware, so even if the software running on
them is the same, they’re able to get much more performance per unit if energy used.
Further notes
https://www.iea.org/digital/#section-5-1 - IEA’s earlier report on digitalisation
https://www.carbonbrief.org/factcheck-what-is-the-carbon-footprint-of-streaming-vide
o-on-netflix
- getting the emissions in perspective
https://www.iea.org/reports/data-centres-and-data-transmission-networks - the IEA on
datacentre energy emissions
https://en.wikipedia.org/wiki/List_of_U.S._states_and_territories_by_carbon_dioxide_
emissions
- carbon emissions by state
https://en.wikipedia.org/wiki/List_of_countries_by_carbon_dioxide_emissions -
carbon emissions by countryAs gains from hardware alone diminish, there is a greater need to work at the software layer too (link) However, gains have just come from hardware, as this diagram from the paper “There’s plenty of room at the Top” from in Science magazine, illustrates. Before we might have been able to rely Moore’s law to make everything faster, as on average we manage double the number of transistors onto a chip every 18 months. But in the last 10 or so years, it’s slowed down and we’ve had to rely on changes that the software level to keep providing improvements. A good example of this might be how hyperscale providers have used various flavors of virtualisation to run their datacentres as a higher rates of utilisation. You can see this with adoption of GPUs in machine learning, and in our domain you also see the same thing when browsers began to offload the rendering of pages onto the GPU in the last decade. This has implications for us as developers - if we want increases in efficiency to keep up with our increased use of computing, they’ll increasingly need to come from the software layer, which is where we work. https://helgeklein.com/blog/2014/12/impact-gpu-acceleration-browser-cpu-usage/
We are in a climate crisis
largely because we keep
burning fossil fuels, instead
of finding a path off them

While efficiency is has been a historic lever, it’s not the only one.. It’s helped because
it’s reduced the amount of energy we’ve needed, which has come from fossil fuels.

But another way to emit less carbon from burning fossil fuels, is to just burn fewer
fossil fuels.

It’s 2020, and we have better, safer, greener ways to generate the energy we need
for computing now.

But because so few of us understand the underlying energy systems our industry
relies on, we’re not aware of the opportunities there either.
Carbon aware design:
The design of products and services to
minimise the carbon emissions
resulting from their use, over the
lifetime of their existence.

 This is where carbon aware design comes from it’s a growing, and interesting field;

 The design of products and services to minimise the carbon emissions resulting from
 their use, over the lifetime of their existence.

 So, if we wanted to apply carbon aware practices to the web, what would they look
 like?
Lessons we can learn from other
         movements
    Inclusive design, and the power of POUR in the accessibility
                            movement.

When working with a field new to us, having a way to remember the key ideas and
principles helps us think about problems in a new way.

I think we can look to lessons from the accessibility community here - while there are
extensive specs that we might refer to as the Web Content Authoring Guidelines, or
WCAG.

You’ll often hear the term POUR used by people when talking about accessibility.
“ The idea is to create a POUR web
site, so to speak. The pun may be a
bad one, but if it helps developers
memorize the principles, then it has
served its purpose.
Constructing a POUR website (link)
People use POUR as a way to help remember what’s important.Perceivable
Operable
Understandable
Robust
The 4 principles for accessibility WCAG (link)
Perceivable
As obvious as that statement may sound, you need to be able to perceive content on
a site to access with it. If you can’t perceive a site because you’re blind, then you
need to rely on other senses to perceive it. Perceivable reminds you to design for
more than just one sense.
Operable
By comparison is about being able to interact with the site using more than just a
mouse and keyboard. IF you don’t have strong motor skills, undo features are
particularly important too for example.
Understandable
Usable might be obvious, but we still get it wrong - we can use language that’s
difficult to understand, or we might choose to provide alternate versions which aren’t
so distracting for more neurodiverse users.
Robust
Finally robust might refer to building sites that work in conditions that are less than
the ideal you might have had when building it. If you’ve been stuck waiting for a few
megabytes of javascript to download on the phone when you just need some textual
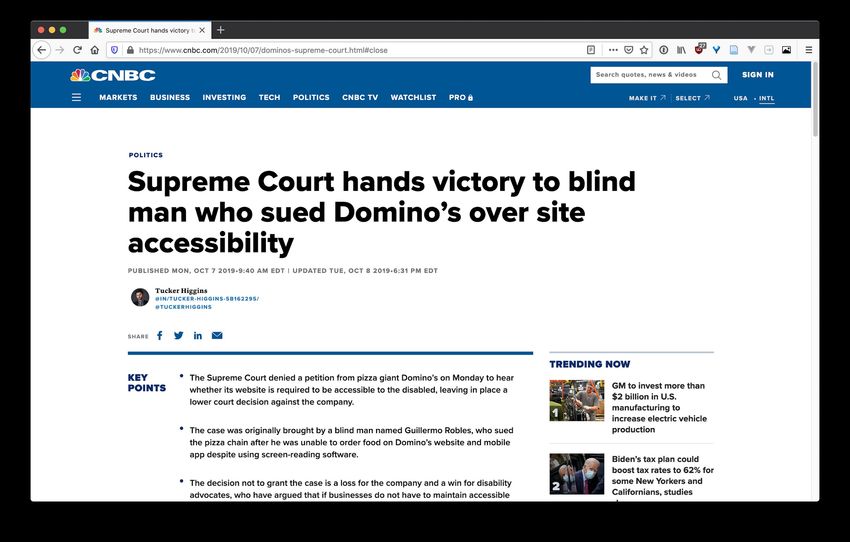
information, you’ll likely appreciate this.Accessibility and inclusive design as a way to avoid risk (link) POUR and the web content accessibility guidelines, have become a norm in the public sector web, you are now seeing the same in the private sector too. You might make an accessible website it because it’s the right thing to do anyway, but it also turns out to be good for risk reduction on your projects. If designing with accessibility in mind, makes it more inclusive, and also means you are less likely to be sued, then it’s a good idea to do so, as Domino Pizza found out the hard way last year.
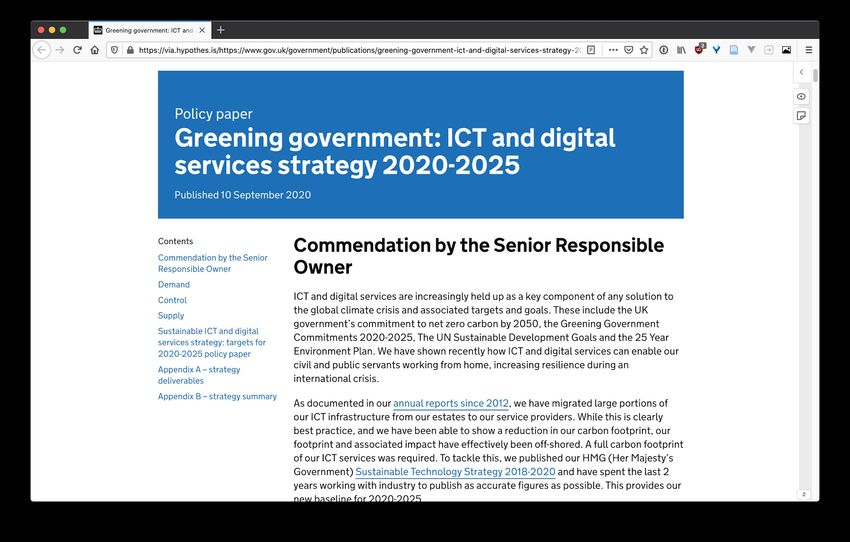
Similar signals from public sector on sustainability as on accessibility (link)

I think you will see a similar thing happen with websites and sustainability, as the
public sector wakes up to the fact that

a) it often has legal obligations to cut emissions, and b) people figure out that the
energy powering our digital world has to come from somewhere, and not knowing
this is a risk.

You can see signs of this in the UK’s government’s own technology strategy already.
Explicit commitments, and references to supply chain (link)

Announced last September, there is increasingly explicit guidance to how public
money needs to be spent, and what people spending it need to look for in suppliers.

So you want to sell to public sector, this is the kind of stuff you‘ll need to be able to
demonstrate more of.

And just like this started in the public sector, I think you’ll see the same thing happen
in private sector too.
What POUR look like for a
greener, carbon aware web?

So, inspired by this, I want share this question with you, and then try answering it in a
way that is hopefully interesting and useful to you. It’s a work in progress, and so I’d
really appreciate your feedback, to make it better.
Green
Open
Lean
Distributed
                A way to think about greening digital infrastructure. See also, principles.green (link)

I think a possible answer to the question I posed is GOLD, standing for Green, Open,
Lean and Distributed.

Let’s look at these in more detail.
Green as in green energy, and
greener material inputs.
Open For running computers.
And making computers.
Lean
Distributed
Green here refers to using the greenest possible inputs for what we do.
It takes energy and carbon to run computers, we should aim to run them on the
greenest energy we can find.
The act of making computers is also resource intensive so we should be working to
minimise the impact there too, but in the time I have with you, I’ll focus primarily here
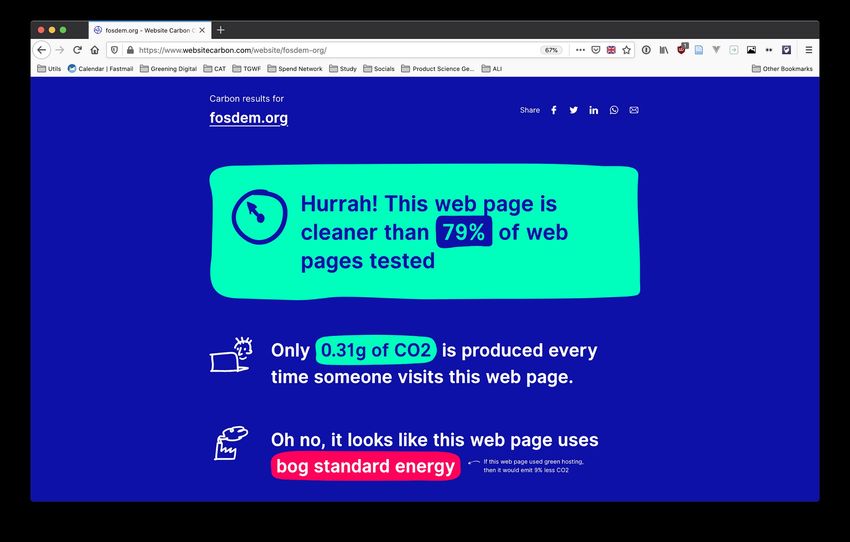
on the first point.Website carbon - quick figures for the carbon footprint of a website (link) We’ve already covered efficiency as a lever for carbon emissions. If you can send less data over the wire, you use less energy, which means lower emissions. Tools like website carbon make this really explicit now.
Website carbon - quick figures for the carbon footprint of a website (link)

But as we know the other way to burn less carbon, is to not use fossil fuels!

My organisation, the green web foundation, provides the data to check if the
providers of the servers are using green power.

Green power is a complex subject, but I’ll do my best to provide a useful summary.
Fossil energy versus green, non-fossil energy

          Gas
                                   You don’t have control over
                                   what others feed into the grid.

          Coal                     If you know the mix going into
                                   the grid, you can at least
          Wind
                                   account for it.

                                   This energy comes from the
          Solar
                                   wind and sun. No carbon
                                   more carbon emissions from
                                   burning fuel!

 As a user of electricity, if you use electricity, you usually will be drawing it from your
 national grid.

 You don’t have direct control over who puts power in, and how that power is
 generated.

 Moreover this grid mix changes at different times of day - because it’s not always
 windy, and solar panels don’t work so well as night.

 If this it the case, how can you the power is green if you’re drawing it from the grid?
Accounting for fossil fuel energy
Wind Google and Microsoft
Gas do this.
Solar
It’s one of the most
Coal effective ways to
make sure you end up
with a green grid for
Wind everybody.
To say we’re green,
we “top-up” the
power - feeding in
Solar as much green
power as came
from fossil energy.
It’s as if you only
ever used green
power
There are lots of ways to do this, but the easiest to understand approach, and the
one I like the most is the one I’ve tried summarising here.
You make sure that whoever you work with to provide energy for your computing puts
at least as much power into the grid with green power, as the power you have used
coming from fossil fuels.
On average you end up with a greener grid for everybody, as the amount of
renewables increases over time on the grid.
This is obviously an over simplification, but if you can keep this idea in your head it
helps. I’ll cover some of the details next.Annual figures vs hourly figures
“An average of ~30 %
per year does not mean
wind turbines are
constantly producing at
30 % capacity every
hour of the year.”
Charts from Bo Tranberg, Entolabs (link)
So far, you might be wondering about how it’s possible to have green power, when it
comes from sources that are variable.
These charts show the increasing levels of resolution for energy from wind in
Denmark.
As the quote from Bo Tranberg says, 30% of power per year does not mean 30% of
power every hour of the year.
But if over a year you look at the power going into the grid from renewable sources
you have paid for, then you can arguably say you’ve been running it on green power.
https://arstechnica.com/science/2020/02/variant-on-photovoltaic-power-could-generat
e-24-hours-a-day/Accounting for fossil fuel energy, on an hour by hour basis
For now, if you’re using the grid, there will still be times where you’re running on fossil fuels.
If this is unsatisfying to you, there’s some really interesting work from larger providers
like Google and Microsoft in this field now.
This picture comes from Google’s new report, 24/7 by 2030, where they set out a
vision for being able to run all their infrastructure on green power, every hour of the
day.
That is, to always match the power they draw from the grid, with carbon-free power
going into the grid.
They do this a few ways but one way is to overprovision renewables, and then store
the energy in huge batteries so when there are fewer renewables on the grid, they
draw power from these batteries instead.
There are other benefits to this approach, which I’ll cover later.
https://blog.google/outreach-initiatives/sustainability/our-third-decade-climate-action-r
ealizing-carbon-free-future/
https://storage.googleapis.com/gweb-sustainability.appspot.com/pdf/24x7-carbon-fre
e-energy-data-centers.pdf
https://devblogs.microsoft.com/sustainable-software/do-you-want-to-be-powered-by-r
enewables-the-answer-is-no/Accounting for fossil fuel energy
Offset just the carbon
Gas emissions
Some companies
do this, too. It’s
Coal much, much
easier than
Wind
understanding
energy markets,
and organisational
change.
Solar
Is this solving the
same problem
though?
Finally, it’s also worth noting that some companies say they run on green power by
just offsetting the carbon emissions from fossil fuel in the grid mix.
While we recognise this at the Green Web Foundation, as some parts of the world
just don’t have the regulatory structure to make any of the stuff I described even
possible personally, I think the other approaches I’ve described solve the problem in
a more direct way, and they are preferrable.Green Open open data, open source & transparency. Lean Distributed We spoke about green as one principle. Another would be open. Because efficiency will increasingly come from us having opportunities for improvement up and down the stack, I think open is necessary. I use open as an approach, as I think it goes beyond open source.
Electricity Map takes open data and makes it easy to use via an API

Open data is one. All around the world, governments expose APIs that list the carbon
intensity of the fuel mix going into the national grids around the world.

But the internet crosses international boundaries, and increasingly we work and
connect internationally.

If you wanted to reduce the carbon footprint of the digital infrastructure you used,
even if a company wasn’t explicitly a green provider, by running it in places where
energy is green you could make a saving in terms of emissions.

In fact in the US, just switching regions in with AWS can more than half the carbon
emissions from your compute, because one region primarily uses hydropower, and
one side historically has used coal.

You can also use maps like this to see when power is green too, in addition to when,
but I’ll come to that later.

This is pretty much what open source project, electricity map is.

It aggregates real time information of how how clean energy is around the world, at
different points in time, based on the energy mix.

Further reading

https://www.electricitymap.org/
https://github.com/tmrowco/electricitymap-contrib/
Coach - like lighthouse, but for a web that’s good for more than just google (sitespeed.io)

You can use google’s lighthouse, but I prefer another tool that I’d like to share with
you, called sitespeed

It’s in use by wikimedia and a bunch of companies, and I recommend trying it out, but
what I want to draw your attention to is how it scores different things.

It seems obvious in retrospect that a huge advertising company might not talk about
privacy when talking about how to build good websites, and just because a project is
open source, doesn’t mean the creator’s interests are the same as your interests.

I’d argue that open is about being prepared to engage with issues from users, and
stakeholders as much as the license itself.

https://twitter.com/doctorow/status/1295167104170070016

https://www.sciencedirect.com/science/article/pii/S0195925517303505
Building a more sustainable web with sitespeed and the green web foundation (link)

The example I’d point you to is some work on sitespeed done last year, to build
carbon calculation into sitespeed itself.

In March last year, a PR I worked on was merged in to make it possible to
understand the carbon burn, from any site.

Open allows participation from places you might not expect!
Green
Open
Lean                                make the carbon you emit
                                    count

Distributed
So we’ve covered green and open, now it’s time to refer the one you’re more familiar
with Lean.

Until we’ve changed how the entire internet is powered, we’ll need to rely on
efficiency in a lot of places, and the make carbon you emit count.
Mozilla’s carbon emissions baseline report (link) In November, Mozilla released their first ever sustainability report, where they tried to quantify the carbon emissions from the digital services they provide. Inside, they did something really interesting, which was to include emissions from end user devices, and data transfer in their calculations. The results were eye opening. More than 98% of their reported emissions came from the energy used by users’ devices. This way of reporting is rare, but totally valid, and gives a new perspective on where the responsibility lies when we build digital services we expect others to use.
Energy patterns: techniques observed in the wild, from green computing phDs (link)

If we wanted to measurably affect the energy used, and therefore the carbon from
usage, then I think the energy patterns resource is worth a look.

In addition to being part of Dr Luis Cruz’s phD thesis on green computing, it’s also a
website cataloguing patterns observed, from querying thousands of repos on github
to find examples in the wild. It’s focussed primarily on mobile, but many of the of the
patterns apply other parts of the stack too.
Tracking web perf stats with sitespeed and grafana

It’s hard to manage things you can’t measure. And it’s easier to manage things if you
can see how they change over time.

There are plenty of hosted services out there now, but the of-the-box dashboards for
grafana from sitespeed gives you some stats you might find useful.

And if they’re good enough for wikipedia, they’re probably good enough to start with
for a lot of us!
Tracking carbon stats with grafana and sitespeed

But what’s really cool, is that since last summer the new default dashboards also
feature carbon figures too!
Green                                       move work through time and

Open
                                            space to avoid carbon
                                            emissions

Lean
Distributed
This sounds fancy, but it really isn’t.

So we’ve covered how energy efficient code can be carbon efficient code, and we
might know intuitively that running infrastructure in a part of the world with loads of
green energy will likely be greener that running it somewhere on loads of fossil fuels.

I’ll focus on the time aspect, as I think it’s the most exciting.
The duck curve. When there’s more being generated than can be used, you can be paid to use energy (link) I’ve mentioned before that that supply and demand is dynamic when it comes to power on the the grid. When it’s sunny and windy, we have an excess of energy, but the grid still needs to be balanced, or bad things happen. When this happens, it’s often cheaper to pay people to use power, than to pay power stations to turn down the power they are feed into the grid, simply because they have so many moving parts. This means energy costs can can go below zero. Here’s a chart from March last year in the UK, showing this phenomenon, sometimes referred to as the “duck curve”, becuase well… it looks a bit like a duck. If you can design for that, it changes the economics of our work, as we can go from being just consumers of power, to active participants in a greener, more responsive grid. http://watt-logic.com/2020/01/10/negative-electricity-prices/ http://large.stanford.edu/courses/2015/ph240/burnett2/
Consumer facing demand pricing with Octopus Energy and their agile tariff (link)

A an aside, if you think this is interesting, this is already something some companies
sell direct to consumers. If you have stuff that uses a decent load of power at home,
you can time it to get paid to use it rather than paying.
How Google move compute loads through time to when energy is cheap and green (link)

Anyway, back to datacentres. Remember that chart showing a flat line from google
for datacentre use, and them running on renewable power 24/7?

Well, it turns out that datacentres have the highest energy intensity per square foot
than any other building - even more than aluminium smelters!

And if you design them to do so, they can also respond quickly to changes in demand
on the grid, to take advantage of this duck curve.

Google are already doing this - and they talk about it as a planet friendly, energy
saving measure.

But it you can distribute jobs through time to run them when energy is green and
cheap, then you end up with lower carbon emissions, but also it can turn something
that used to cost you money, into something that makes you money.
If we can measure carbon,
then we use it as a creative
constraint to work with when
creating designs.

 Branch Magazine - when energy is green, serve the richer experience inside the same carbon budget (link)

This is supposed to be a talk about web performance, so here’s an example of
applying these principles of carbon aware design in production

Last year, I worked with a team on a digital magazine all about the sustainable web,
called Branch.

We knew that the carbon footprint of data over the wire changes based on proportion
of renewables on the grid, so instead of just having performance budget, we tried
using designing with a carbon budget.

When the wind was blowing and the sun was shining, we’d serve the high bandwidth,
rich version. This is when you might use a web worker to download assets in the
background, and pre-cache stuff as much as you could.

If you already have the content locally, then you don’t need to make any subsequent
requests over the network, to navigate around it, making it feel faster too.
Carbon aware progressive
enhancement?

Responsive responsive
design?

 Branch Magazine - when energy is more dirty, adjust the design to stay inside the budget and send the key content

Conversely, when the grid was largely supplied by power from fossil fuels, we knew
our carbon budget wouldn’t go so far.

So we designed the site, and the content account for this lower bandwidth scenario.

Every time we’d use an image, we’d have to think about how it would look in the low
bandwidth scenario.

Designing this way forced us to always be able to serve a fast site, but it had the side
effect of forcing us to think about accessibility too.

If we can’t send a big photo, and it’s a key part of the story, then we’d at least need to
communicate these ideas with good looking alt-text on images, and so on.

User could always override this, and if we had already filled a browsers cache of
content when energy was cheap and green, it would make sense to serve the rich
images we already have, but hopefully you get the idea.

Browsers are really capable these days, and is while this is a basic example, this
principle applies in loads of places.
Green
Open
Lean
Distributed
               A way to think about greening digital infrastructure. See also, principles.green (link)

So that’s GOLD, and .

Green, open, lean and distributed.
Next steps I said I’d provide some next steps. There are two I’d suggest.
Becoming carbon aware:

        climateaction.tech/letsgreentheweb

The first is follow the link below to climateAction.tech, next week there’s a whole
campaign starting around the idea of low carbon websites, being led by Hannah
Smith and Luiz Cruz, both absolute experts in this field.

I help organise this community, and I learn so much being part of it it

It’s the single best place I can think of to learn more about this subject.
Thanks!
climateaction.tech/LetsGreenTheWeb
#LetsGreenTheWeb
@climateActTech
thegreenwebfoundation.org/fosdem
chris@thegreenwebfoundation.org
@mrchrisadams / @greenwebfound
These links, twitter accounts and hashtags are the ones I think will be most useful to
you. I really enjoy being part of CAT, and if you liked this talk, I think you would doo.
Finally, I’d also recommend is visiting the special page for FOSDEM on the screen,
for the sharable version of this talk, that collates all the links and sources I’ve
referenced.
At the Green Web Foundation, we use open data, open source, and an open
approach to speed a transition from fossil fuels.
All of our tools and datasets are free to use, and we’re alway looking for folks to work
with.
If you’d like to get in touch my details are on this page, and hopefully, my future self
has been making himself useful and helping answer questions in the chat.
Thanks for your time, FOSDEM!You can also read