ELECTRICITY GENERATION - FACTS AND FIGURES - VGB PowerTech
←
→
Page content transcription
If your browser does not render page correctly, please read the page content below
FACTS AND FIGURES

ELECTRICITY GENERATION   2020|2021
FAC TS A N D FI G U R ES                                                                                                  EL E C T R I C I T Y G EN ER AT I O N 2020 l 2021

DEVELOPMENT OF THE GLOBAL AND EUROPEAN ELECTRICITY DEMAND

T    he global population of 7.7 billion people is increasing by 90 million
     people per year. Electricity consumption will grow faster, average 2000
to 2018: 66 %, than any other form of energy consumption due to an increas-
                                                                                    Contents

                                                                                    n Electricity demand worldwide and in Europe                                    2  – 3
ing demand and population growth − one quarter of the global population
does not yet has access to electricity. Additionally, digitisation, electromobil-   n Renewables (RES) in the EU                                                        4
ity and sector-coupling will increase electricity demand.                           n Hydro power, wind energy, biomass                                             5–7
The IEA estimates in all of its scenarios that in all fields and regions the an-    n Distributed power, storage technologies                                       8–9
nual electricity demand will increase from 26,607 billion kWh to a range of
38,713 to 42,824 billion kWh; an yearly average increase of about 2.1 %.            n Flexible generation                                                         10 – 11
The three scenarios are based on different targets for efficiency and emission      n Framework for conventional power plants                                     12 – 13
reduction. Further scenarios e.g. by BP, ExxonMobil and the U.S. Energy
                                                                                    n Nuclear power worldwide                                                     14 – 15
Administration (EIA) and are available. According to all forecasts the world-
wide electricity demand will increase by 2040 in a range of 34,000 to               n Small modular reactors | Decommissioning                                    16 – 17
43,000 billion kWh. In the EU, the expected increase in electricity demand          n New power generation capacities needed                                      18 – 19
is lower at about an average of +0.7 %.
                                                                                    n Global climate policy needed                                                20 – 21
Generation capacities worldwide are increasing with +2.0 % p.a., a significant
increase.                                                                           n VGB: Activities and members                                                 22 – 23
The impact of the 2020 corona crisis is estimated to be low in both the             n Imprint                                                                          24
medium and long term. In China, for example, electricity demand in mid-
2020 is expected to rise again compared to the previous year.

                                                                                    EU includes the United Kingdom with respect to the data bases (before 2020).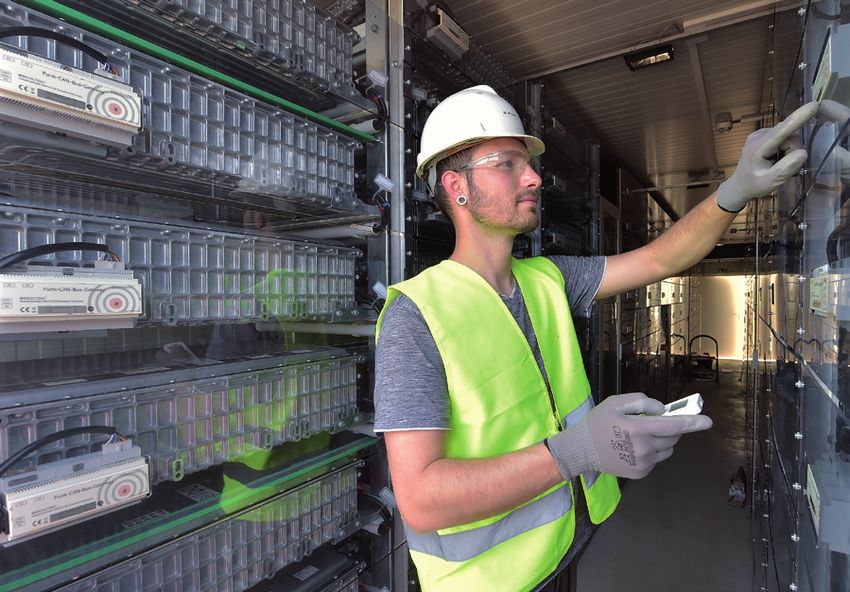
Expected growth in electricity generation in billion (109) kWh worldwide Expected growth in electricity generation in billion (109) kWh in the EU
45,000 IEA scenarios (2019) 4,500
+45 to +61 % IEA scenarios (2019)
+2.0 to 2.3 % per year
Current Policies
40,000 +9 to 22 %
4,000 +0.5 to 1.1 % per year
3,500
Current Policies
EIA - Reference Scenario
30,000
Stated Policies 3,000
BP - Energy Outlook
Sustainable Development
Wind,
Sustainable Development
2,500
Stated Policies
ExxonMobil
biomass, solar Wind,
20,000 biomass, solar
Hydro 2,000
Hydro
Nuclear
1,500 Nuclear
Fossil
10,000 Fossil
1,000
500
IEA
0 IEA
2018 2040 0
Year 2018 2040
Year
Sources: IEA, BP, U.S. EIA, ExxonMobil, EU Commission, VGB (own calculations)
PAG E 2 – 3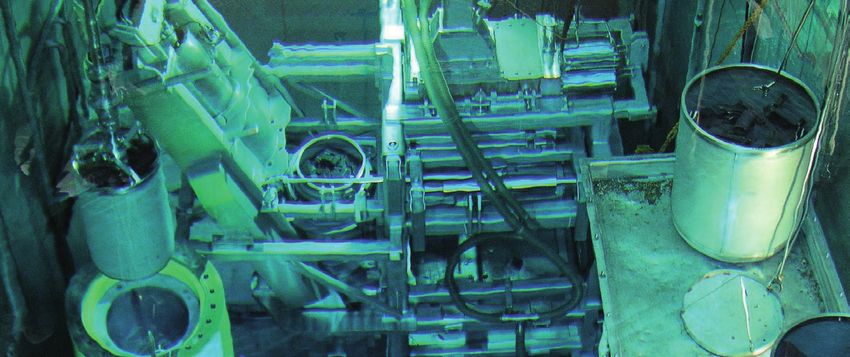
FAC TS A N D FI G U R ES EL E C T R I C I T Y G EN ER AT I O N 2020 l 2021
RENEWABLES – EU’S AMBITIOUS TARGETS FOR 2020
T he EU and their member states have set binding, ambitious targets to
promote the expansion of renewable energy sources. For the electricity
sector, the EU expects renewables to account for 34 % by 2020.
Sweden
Finland
Latvia
54.6
41.2
40.3
38 Target reached
40 Target reached
49 Target
reached
Denmark 36.1 30 Target reached
Since the implementation of the EU Directive for climate protection and Austria 33.4 34
Portugal 30.3 31
energy ‒ often referred to as the “20-20-20 package” ‒ adopted in Decem- Estonia 30.0 25 Target reached
ber 2008, the share of renewables in gross final energy consumption has Croatia
Lithuania
28.0
24.4
20 Target reached
23 Target reached
increased steadily. In 2018 the share reached 18,0 %, almost twice as high Romania 22.0 24 Target reached
Slovenia
as in 2004 (8.5 %). This represents an increase of 0.5 percentage points Bulgaria
21.1
20.5
25
16 Target reached
EU-targets for RES till 2020:
over the previous year 2017. Greece 18.0 18 Target reached 20 % share of renewable
Italy 17.9 17 Target reached energy in gross final energy
At 54.6 %, Sweden‘s share of renewables was by far the highest in 2018, Spain 17.5 20 consumption
followed by Finland (41.2 %), Latvia (40.3 %), Denmark (36.1 %) and France 16.6 23 10 % share of energy
Germany 16.5 18 from renewable sources
Austria (33.4 %). The lowest shares of renewable energy were registered in Czech Rep. 15.2 13 Target reached in transport
Cyprus
the Netherlands (7.4 %), Malta (8.0 %) and Luxembourg (9.1 %). In total, Hungary
12.9
12.5
13
EU
14
twelve of the 28 EU member states have met their 2020 targets: Bulgaria, Slovakia 11.9 14 2018: 18.0 % 2020: 20 %
Croatia, Czech Republic, Denmark, Estonia, Finland, Greece, Italy, Latvia, Poland
Ireland
11.3
11.1
15
16
Lithuania, Romania and Sweden. United King. 11.0 15
Belgium 9.4 13 2018
Energy from renewables will play a key role in the years after 2020. For this Luxembourg 9.1 11 Target in 2020
reason, the member states have agreed on a new EU target of at least 32 % Malta
Netherlands
8.0
7.4
10
14
by 2030. EU-28 18.0 20
0 10 20 30 40 50 60
Share of renewables of gross final energy consumption in %
Source: Eurostat 2020 (data base: 2018)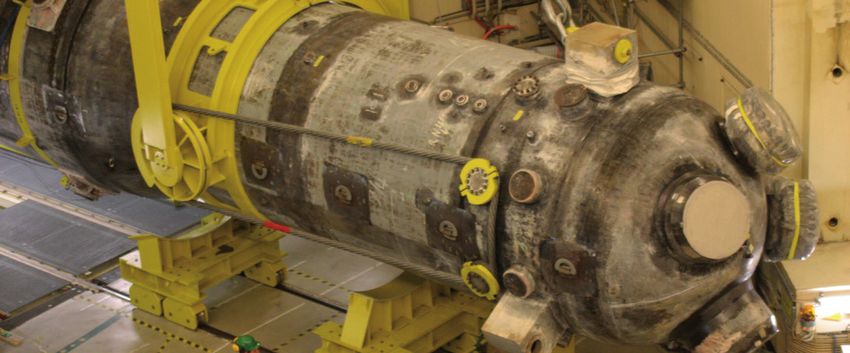
HYDRO POWER – AN INDISPENSABLE SOURCE OF ENERGY

H     ydro power is not only a reliable renewable energy source, but also the
      frontrunner in Europe in the generation of electricity from renewable
energy sources. With a production of more than 379 TWh – around 35.0 %          Target for RES-electricity                    Status 2018 – Total: 1,079 TWh
of the electricity generated from renewable energy sources – hydro power                in EU-28                                Target in 2020: 1,196 TWh
makes a significant contribution to achieving the EU target of 34 % of elec-    2018               2020                                      83 target; current targets achieved
                                                                                                                    In brackets (...): Individual
tricity generation from renewable energy sources by 2020.                       32.9 %             34.0 %                                                 304
In addition to the predictable and constant generation of run of river pow-
er plants for base load coverage, the provision of reserve power and peak
                                                                                      Wind energy
load to ensure security of supply and, in particular, control power to main-                                                                            Hydro power
tain grid stability in an increasingly flexible energy market is becoming                               377
more and more important. In Europe, these requirements are primarily met                             (495; 76 %)                        379
by high-efficiency pumped storage and storage hydro power plants with a                                                             (355; 107 %)
total installed bottleneck capacity of more than 48,524 MW.
                                                                                                      188
Hydro power is therefore not only an extremely efficient, reliable and stor-                       (232; 81 %)
                                                                                                                            128
able form of energy, but also an indispensable renewable source of energy                                         7     (103; 124 %)
which has to be conserved and further developed within the framework of                                      (11; 61 %)
the energy transition.                                                             Biomass

                                                                                                             Geothermal    Solar energy

                                                                                                                                    Source: Eurostat 2020 (data base: 2018)

                                                                                                                                                            PAG E 4 – 5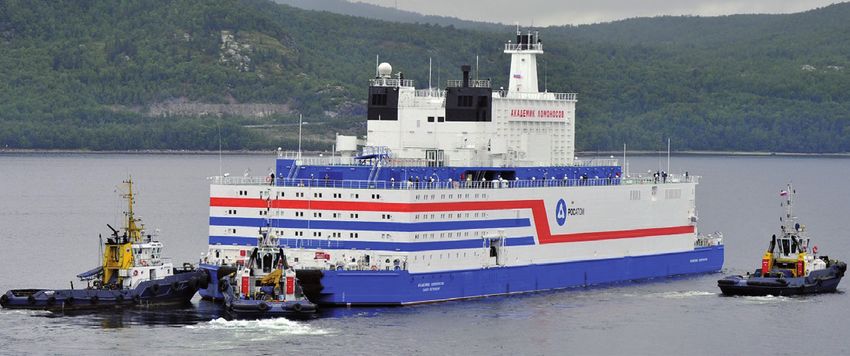
FAC TS A N D FI G U R ES EL E C T R I C I T Y G EN ER AT I O N 2020 l 2021
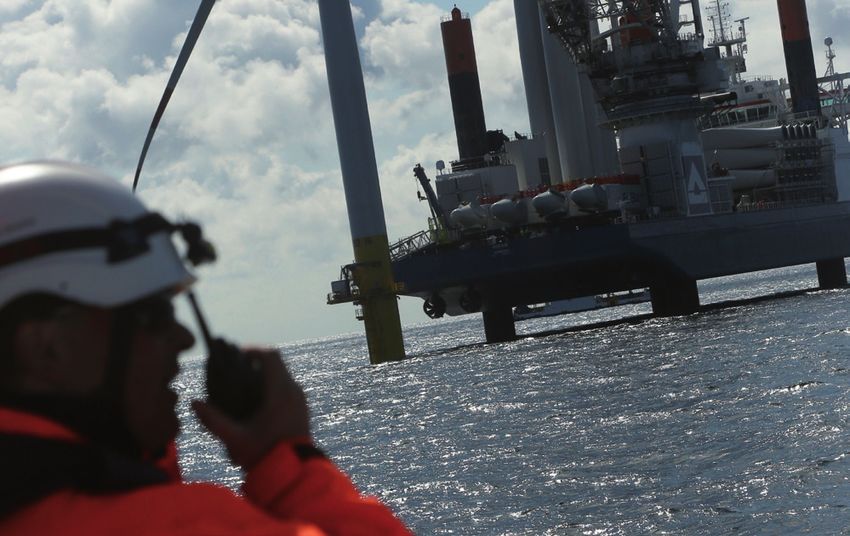
WIND ENERGY – A MAINSTAY OF THE ENERGY TRANSITION
I n order to meet the European Union’s targets for the energy and climate
package by 2020, it is also imperative to further expand the use of wind
energy. In Germany at the end of 2019, around 30,950 wind turbines with
Wind power:
Capacities in Europe
end of 2019 in MW
a total capacity of 61,357 MW were in operation. At that time, the installed
capacity of wind turbines in Europe was 204,814 MW and worldwide Total Europe*:
FI
650,557 MW. 204,814 MW
NO 2,284
1,444 SE
A retrospective analysis of the wind turbine market reveals continuous fur- 8,985
ther development of system technology, accompanied by increasing rated ES 320
RU
power, rotor diameter and hub height. From the first small plants with an IR
4,155
DK
6,128
LV 66
191
LT 548
average output of around 30 kW and rotor diameters of less than 15 m in UK
23,515
NL
4,600
the mid-1980s, offshore wind turbines with a rated power of 14 MW and BE DE PL BY 3
61,357 5,917
more as well as rotor diameters of 222 m have been developed. Wind tur- 3,879
LU CZ UA
bines have already paid for themselves in terms of energy after three to FR 136 337
SK 3
1,170
AT
seven months of operation. This means that after this time the turbine has 16,646 CH 75
3,159 HU RO
329
produced as much energy as is required for its production, operation and PT
SI HR
3
3,029
ES IT 652
disposal. In addition to the consistent further development of system tech- 5,437
25,808 10,512 BG
nology, the optimization of maintenance strategies in particular will play a 691
TR
decisive role in the future in order to increase technical availability and thus GR
3,576 8,056
economic efficiency. Especially reliability, weight, costs and efficiency play
a key role in this respect. CY 158
* Including not listed countries. Source: WindEurope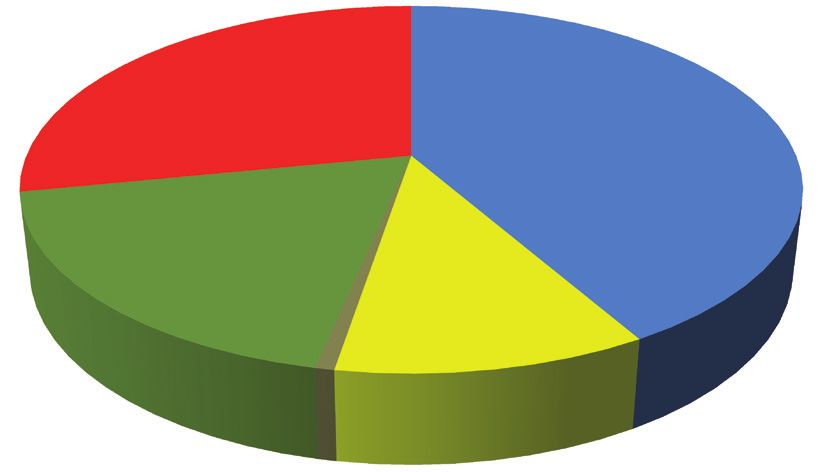
BIOMASS – THE ALL-ROUNDER
E nergy production from biomass is a decisive component of the energy
transition. Currently, 188 TWh of electricity is produced from biomass
in Europe, which means that biomass accounts for 17.5 % of renewable Biomass: Development of electricity generation in the EU
electricity generation. In Europe, Finland, Italy, the United Kingdom and Finland Italy United Kingdom Germany EU-28
Germany were the countries with the highest electricity production from 250
biomass in 2018.
Biomass is used as a fuel in thermal power plants or is fermented to produce
Electricity generation in billion (109) kWh
200
methane in biogas plants. Biomass power plants meet the same require-
ments for the stability of the electricity grid as fossil-fired power plants.
They are suitable for base-load as well as for the supply of balancing and 150
control power. In addition, it is also possible to convert coal-fired power
plants to biomass in order to continue using existing sites. Biogas is usually
used in gas engines to generate electricity or can be fed into the natural gas 100
grid. This contributes a considerable storage potential.
Biomass power plants and biogas plants can be used both in centralised and
distributed systems. Biomass, as an all-round renewable energy source, is 50
therefore an indispensable component of future energy supply systems.
0
2012 2013 2014 2015 2016 2017 2018 2020
Year
Source: Eurostat
PAG E 6 – 7FAC TS A N D FI G U R ES EL E C T R I C I T Y G EN ER AT I O N 2020 l 2021
DISTRIBUTED POWER GENERATION – NEW SUPPLY SYSTEM STRUCTURES
D istributed generation is an essential part of the energy transition and
will increase significantly in the coming years. However, the complex
system of distributed energy supply, consisting of “Security of supply – en-
Growth of distributed power production in different regions
120,000
vironmental protection – economic efficiency”, must be considered in its North America Western Europe Eastern Europe
entirety.
100,000
Combined heat and power plants are mainly based on the classic reciprocat-
ing engine process. In addition, fuel cells can open up new fields of applica-
Capacity in MW
tion for combined heat and power (CHP). They represent important tech- 80,000
nical innovations, as they enable the use of CHP technology, even in the
very small power range. This applies in particular to applications in the local
heating sector, but also in the commercial and industrial sectors. 60,000
In combination with the increase in distributed energy generation, these
systems will increasingly have to offer the necessary network services in the 40,000
future, including the provision of control power.
To support the necessary measures, smart metering will now also be intro-
20,000
duced in Germany. With intelligent information networks, energy produc-
tion and consumption can be efficiently linked and balanced. The central
component of an intelligent metering system is the Smart Meter Gateway 0
as a communication unit. 2014 2015 2016 2017 2018 2019 2020 2021 2022 2023
Year
Source: Navigant ResearchSTORAGE TECHNOLOGIES – AN IMPORTANT COMPONENT OF SYSTEM STABILITY
E fficient system integration of variable renewable energies and distrib-
uted generation requires a high degree of flexibility. This flexibility can
be provided by controllable generation, storage and sector coupling solu-
Specification High capacity High amount of energy
Storage time Seconds Minutes Hours (days)
tions.
Storage systems can be divided into centralised storage power plants, decen- Application
(examples)
Voltage stabilisation ˝Black start“ Stand-alone networks,
electricity trading
tralised small-scale storage facilities, short-term or long-term storage facili- Frequency stabilisation Uninterruptible
power supply Peak-load smoothing
Flicker compensation
ties. Furthermore, there is the possibility to store electrical or thermal energy. Soft-hybrides
Load balacing
Batterie-power vehicles
Hydrogen is a central key to achieving climate neutrality. The technologies Classification Thermal Local Decentral Central storage
Short-time storage
for producing climate-neutral hydrogen are already available today. How- technologies storage small storage large batteries power plants
ever, climate-friendly hydrogen technologies must be developed and Storage
concepts Sensitive storages Double-layer Lead-acid Lead-acid Pumped-storage
strengthened quickly and international cooperation must be expanded. Latent storages capacitors batteries (Pb) batteries (Pb) power plants
Since it is currently the only application that can link all sectors (electricity, Chemical Superconducting
Lithium-Ion Lithium-Ion Compressed-air
storages batteries (LIB) batteries (LIB) power plants
industry, heating and transport) and at the same time ensure the over-sea- magnetic
energy storage Nickel-cadmium Natrium-
sonal storage capacity of energy, power-to-gas (PtG) is taking on the role of batteries (NiCd) sulphur
Hydrogen-storage
Nickel-metal- batteries (NaS)
a key technology for sector coupling. Fly-wheel
hydrid batteries Redox-flow-
power plants
(NiMH) batteries (RFB)
Market-driven framework is required for the use of the various storage tech- Type of storage
nologies. Virtual storage
Electrical (electromagnetic or -static field)
The only mature technology currently available is the use of hydropower in Electro-chemical (chemical energy)
the form of pumped storage power plants. Large battery systems have al- Mechanical (kinetic or potential energy)
ready demonstrated their technical suitability.
Source: Fraunhofer ISI (2012)
PAG E 8 – 9FAC TS A N D FI G U R ES EL E C T R I C I T Y G EN ER AT I O N 2020 l 2021
FLEXIBLE GENERATION – GUARANTEEING SECURITY OF SUPPLY
T oday, volatile energy resources such as photovoltaics and wind contrib-
ute about 10 % to global electricity generation – according to IRENA,
their share will grow to about 60 % by 2050. This will also increase the need
The increasing share of volatile energy resources requires not only a high
degree of flexibility in the energy system, but also special attention to secu-
rity of supply. It must be ensured that electricity demand is covered at all
for flexibility in the energy system, which arises from fluctuating residual times and in all places. Fluctuations in the feed-in of wind and photovolta-
loads. The more flexible an energy system is, the better the integration of ics must be balanced not only in the short term, but also in the long term.
increasing shares of photovoltaics and wind will succeed. System flexibility In Europe, for example, there are meteorological situations in which there
is essentially ensured by the four options of controllable generation, energy is no wind and no sunshine for several days or weeks. During this period,
storage, grids and demand-side management. controllable generation capacities and/or energy storage facilities must
Dispatchable generation technologies currently form the backbone of sys- guarantee security of supply.
tem flexibility – in Europe, for example, they account for 80 % of available New and appropriately upgraded thermal power plants can contribute to
flexibility capacities (IEA, World Energy Outlook 2019). Controllable gen- the integration of renewable energies into a modern power supply system
eration mainly includes thermal power plants and hydropower plants. Their through their flexible operation. The focus of technical developments is on
flexibility can be characterised by three parameters: Minimum load, load the exploitation of the existing potential for flexible plant operation.
gradient and start-up and shut-down times. The minimum load represents Against the backdrop of the expansion targets for renewable energy
the lowest load at which a power plant can be operated under stable condi- throughout Europe, a broad and flexible thermal power plant portfolio will
tions. The load gradient indicates how quickly a power plant can change its continue to be indispensable in the future in order to ensure economic ef-
output in a given time. The start-up time indicates the time from the start ficiency and security of supply at all times.
of power plant operation until the minimum load is reached; the shut-down
time indicates the time until complete shut-down.Flexibility parameters of controllable generation plants:
High load gradients, low minimum load, short ramp-up times
Flexibility of thermal power plants – State-of-the-art
Plant type Hard coal Lignite CCGT Gas Nuclear
1,300 turbine
Lignite (e.g. BoA) Nuclear
1,200 Load gradient
2/4/6 2/4/6 4/8/12 8/12/15 2/5/10
in %capacity
per minute~1,000 MW
Capacity in MW
Max Max capacity ~1,300 MW
Nuclear power plants Min capacity ~420 MW Min capacity ~520 MW
1,000 ... ramp rate
Max +/-30 MW/min Max ramp rate +/-63 MW/min
a a
in the load 40...90 50...90 40 ...90 40 ...90 40...100
range of %
Combined Cycle Power Plant (CCGT) Hard coal
800 Minimum load
Max capacity a
Max
in %capacity
of ~2 x 440
40/MW
25/15 60/40/20 50/40/30 50/40/20a
~800 MW
40b/40b/40b
Lignite fired power plants Min capacity ~520*/260** MW Min capacity ~210 MW
nominal capacity
Max ramp rate +/-36 MW/min Max ramp rate +/-20 MW/min
600
Combined Cycle Ramp-up time
Power Plants (CCGT) *in two
hours (h),operation
boiler 3/2/1 6/4/2 1.5/1/0.5FAC TS A N D FI G U R ES EL E C T R I C I T Y G EN ER AT I O N 2020 l 2021
NEW FRAMEWORK FOR THE OPERATION OF CONVENTIONAL POWER PLANTS
E lectricity generation in Europe has changed in recent years. These include
the development of renewable energies, the reduction of electricity gen-
eration in conventional – thermal – power plants, the different European
The performance-weighted characteristic values of energy availability and en-
ergy utilisation as well as of planned, disposable and not disposable availabil-
ity and especially of unavailability show interesting developments over the 22
energy policies and the development of the electricity market. An efficient tool years which reflect current trends such as liberalisation and the energy turna-
is needed to help make decisions and to assess the various influences. round.
With the objective of evaluating, comparing and optimising the operation of The unplanned unavailability reflects the short-term technical failures of the
power plants and the plants (systems & components) themselves, VGB has power plants. While for coal-fired power plants this has been increasing stead-
been collecting data on e.g. the availability and utilisation of different power ily over all these years, for gas turbines it has only increased sharply in the last
plants since 1970 according to uniform definitions and procedures, using the 3 years, with the same fluctuations in maintenance measures over the last 10
Power Plant Information System (KISSY – Kraftwerksinformationssystem). years.
The following trend diagrams show the comparison between European coal-
fired power plants (276 plants) and gas turbines (151 plants) over the period
1998 to 2019. The number of power plants shown per year vary because Sources
typical behaviours such as decommissioning, new plants, power plant modi- Technical and Commercial Key Indicators for Power Plants,
VGB-S-002-03-2016-08-EN, VGB PowerTech, ISBN 978-3-86875-934-1 (eBook, free of charge)
fications, transfer to grid and capacity reserve or safety readiness have to be VGB-Standard Annex to VGB-S-002 Series,
considered. VGB-S-002-33-2016-08-EN, VGB PowerTech, ISBN 978-3-86875-933-4 (eBook, free of charge)
Availability of Power Plants 2010 – 2019, VGB-TW 103Ve,
Issue 2020, VGB PowerTech, ISBN: 978-3-96284-215-4
Analysis of Unavailability of Thermal Power Plants 2010 – 2019, VGB-TW 103Ae,
Issue 2020, VGB PowerTech, ISBN: 978-3-96284-219-2Energy availabilty of European power plants Unavailability (UA) of European power plants
Energy availabilty, coal Energy availabilty, gas UA planned, coal UA postponable, coal UA not postponable, coal
Energy utilisation, coal Energy utilisation, gas UA planned, nat. gas UA postponable, nat. gas UA not postponable, nat. gas.
100 12
10
80
Energy availabiltyin %
Unavailability in %
8
60
6
40
4
20
2
0 0
1998 2000 2002 2004 2006 2008 2010 2012 2014 2016 2018 2019 1998 2000 2002 2004 2006 2008 2010 2012 2014 2016 2018 2019
Year Year
Source: VGB data base KISSY (Power plant information system, data: 2019)
PAG E 12 – 13FAC TS A N D FI G U R ES EL E C T R I C I T Y G EN ER AT I O N 2020 l 2021
NUCLEAR POWER – CONTINUED EXPANSION WORLDWIDE
I n 2019, electricity generation from nuclear power plants was around
2,587 billion kWh, slightly higher than in 2018, due to excellent operat-
ing results of the plants as a whole, the first commissioning of new units
Electricity generation from nuclear power worldwide
100 3,000
Electricity generation from nuclear power plants in billion (109) kWh
mainly in Asia and the recommissioning of 8 units in Japan in recent years.
The share of nuclear energy in the total global electricity generation was Availability in %
2,500
10.5 % in 2019. In Western Europe, electricity generation from nuclear
energy remained almost constant compared to 2018 at around 750 billion
kWh. After North America, Western Europe is the second strongest eco- Others 2,000
nomic region with nuclear power generation.
Japan
Since the first commercial nuclear power plants were commissioned in 50 1,500
Calder Hall, England, in 1956, a cumulative total of about 83,900 bil- USA
lion kWh of electricity has been produced. This corresponds to about three 1,000
times today’s worldwide annual electricity demand.
The greatest increase in nuclear power generation was in the 1980s, when
500
the large nuclear power plant projects with unit capacities above 1,000 MW, EU
which were started in the 1970s, went into operation.
0 0
After the events in Japan in 2011, the availability of work increased slightly 1956 1960 1970 1980 1990 2000 2010 2019
to a global average to the high value of almost 80 %. Year
Source: atw – Int. Journal for Nuclear Power 5/2020NUCLEAR POWER: PLANTS, PLANNED SHUTDOWNS, NEW PLANTS AND PROJECTS
USA 97 + 2 4 +1 +1 Finland
W orldwide, 444 nuclear power plants with a
total capacity of 419,797 MW were oper-
ated in 31 countries (status: December 2019). 52
France 58 - 2 + 1 4+2 Hungary
nuclear power plant units are currently under
Japan 34 + 2 48 + 11 + 30 China
construction and the trend of new projects in the
United Kingdom 15 + 2 + 10 3 +1 Argentina
countries of Asia as well as in newcomer coun-
Russia 34 + 4 + 16 2 +1 + 4 Brazil
tries, also in Africa, the Middle East and South
Canada 19 + 7 2+2 Mexico America – with substantial participation of the
Germany 6 -6 5 +2+2 Pakistan supplier countries – is increasing.
South Korea 24 + 5 + 10 2+4 South Africa
In the years 2018 and 2019, for example, a total
India 22 + 7 + 7 Nuclear power plants worldwide 1-1+1 Armenia
in operation 2019: 444
of 9 new nuclear power plant units started com-
Ukraine 15 + 2 1 Netherlands mercial operation for the first time in China,
Sweden 7 2+2 Romania among them Taishan 1 and 2, the first European
Spain 7 1+1 Slovenia pressurised water reactors (EPR). With a gross
Belgium 7 1+1 Iran capacity of 1,750 MW each these are currently
Taiwan, China 3 +2 +4 + 2 UAE the most powerful nuclear power plant units
+4 Poland
Bulgaria 2 +2 worldwide.
+1 Lithuania
Slovakia 4 +2+2
New build: 52 +4 Vietnam Thus, 15,600 MW of nuclear power plant capac-
Switzerland 4
Planned shut-downs: 9 +1+3 Turkey ity have been added worldwide, but also 9 older
Czech Republic 6+4
Projects: 200 (including projects in further 16 countries) +2 Belarus power plant units, mostly with lower capacity,
+2 Bangladesh have been permanently shut-down.
Sources: IAEA, atw – Int. Journal for Nuclear Power, status: 12/2019
PAG E 14 – 15FAC TS A N D FI G U R ES EL E C T R I C I T Y G EN ER AT I O N 2020 l 2021
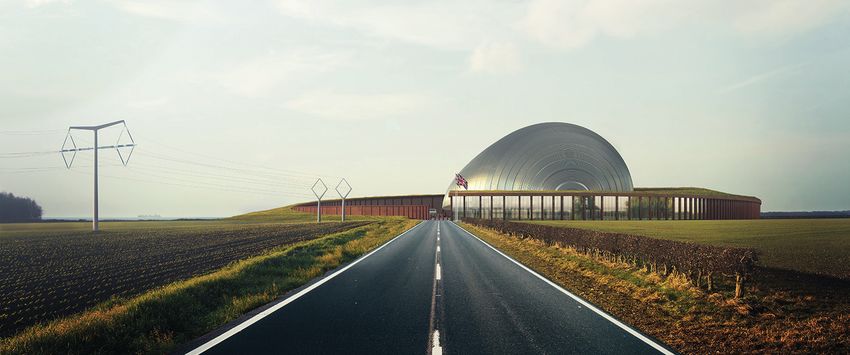
SMALL MODULAR REACTORS (SMR)
A part from the further development of the reliable light water reactor
technology, innovative modularly designed reactors of small and medi-
um capacity up to approx. 600 MW are developed. These “Small Modular
Reactors” (SMR) and other concepts belong to the so-called Generation IV
reactors. The USA and Canada in particular are involved in this, but projects
are also starting in Great Britain, China and Finland.
These concepts are characterised above by the following properties:
ll Highest safety standards through passive systems or physically inherent
safety features.
ll Modular design. i.e. a step-by-step investment-optimised construction
of the units according to requirements is possible.
ll “Modular principle”, i.e. production in the manufacturer’s factory with
all advantages of series production is aimed for.
ll Long maintenance intervals and operating times for the nuclear fuel
loading over several years lead to lower operating costs.
ll Partial erection of the modules in underground caverns and thus also
close to the consumers. This enables not only the generation of
electricity, but also the supply with district or process heat.
ll Self-supply of remote areas in island operation.
SMR project in the UK and Russian nuclear power plant on a floating bar.DECOMMISSIONING AND DISMANTLING
A ssuming an average lifetime of 60 years for a nuclear power plant,
approx. 300 plants will be shut down worldwide by 2030.
Since the decision for the phase-out of nuclear energy in 2011, the German
plant operators and the nuclear industry, which has also prepared itself for
the dismantling, have gained extensive knowledge on planning, organisation
and implementation of the dismantling. Of the 30 prototype, pilot and
power reactors decommissioned to date, three have been completely disman-
tled to the “greenfield site”. The dismantling work at other plants has started
well and is well advanced according to the shutdown date.
Apart from Germany, nuclear power plants are also decommissioned and
dismantled in other European countries such as Belgium, France, Sweden,
Lithuania but also outside Europe.
The increased international interest leads to the fact that international or-
ganisations like WANO, WNA, OECD/NEA are increasingly dealing with
the decommissioning and dismantling of nuclear power plants.
Within the framework of the EU project Horizon2020 SHARE (Stakehold-
er-based Analysis of Research for Decommissioning), the EU, in coopera-
tion with relevant stakeholders, is also identifying a Strategic Research
Agenda for the decommissioning and dismantling of nuclear installations.
Removal of a steam generator and underwater loading of casks during dismantling.
PAG E 16 – 17FAC TS A N D FI G U R ES EL E C T R I C I T Y G EN ER AT I O N 2020 l 2021
NEW POWER GENERATION CAPACITIES REQUIRED
F or more than two decades, European electricity generation has been in-
vesting predominantly in renewable energy sources and gas-fired power
plants, whereas in the 1970s and 1980s, investments focused on conven-
The future of today´s electricity generating capacities in operation
1,000
tional coal-fired and nuclear power plants. This structural change is above all
Other
the result of various financial support systems for renewables in the indi-
vidual European countries. Geothermal
Capacity in operation in GW*
800
Hydro
Conventional power plants in Europe, mainly coal-fired and nuclear power
Photovoltaic
plants, have therefore now reached a technical age at which future decom-
Waste
missioning is foreseeable. The typical technical lifetimes of coal-fired power 600
Peat
plants are about 40 years, those of nuclear power plants about 60 to 80
years, and those of hydroelectric power plants about 100 years. In addition, Biomass
it is also foreseeable that in the coming years, renewables capacities will 400 Wind, offshore
increasingly reach the end of their technical operating life; the service life of Wind, onshore
wind power and photovoltaic systems is considered to be 20 to 30 years. Nuclear
200
Oil
Based on typical service life data and individual political decisions (e.g.
phasing out nuclear power in Germany by 2022), it can be estimated that Lignite
by the year 2030 around 30 % of the electricity generation capacities cur- 0 Hard coal
rently in operation in Europe will be decommissioned. By 2050, this figure 2015 2025 2035 2045 2050
Year
will be around 80 %. * ˝Mortality“, Base: Capacities in operation end of 2014
This estimate makes it clear that with today‘s time horizons for planning,
construction and commissioning of power generation plants of 10 years and
more, suitable replacement capacities for a secure electricity supply will Source: Investment Requirements in the EU electricity sector up to 2050
have to be prepared in good time – now. Chalmers University of Technology, Department of Energy and Environment, Energy TechnologyPLANNED AND ANNOUNCED NEW CONSTRUCTION PROJECTS IN EUROPE
T he need to replace existing power generation capacities in Europe has
led many companies to plan new construction projects. Despite the
massive expansion of energy from renewables, coal, natural gas and nuclear
Projected and announced power plant capacities in Europe
energy continue to be the most important primary energy sources for reliable Share of energy source 2020 Gas (28,403 MW, 29.4 %)
available power generation. Highly efficient new plants are replacing less
Oil (0 MW, 0 %)
efficient power plants. In addition to a significant reduction in CO2 emis-
sions, new power plants will also reduce further emissions and their increased Hard coal (12,200 MW, 12.7 %)
flexibility will contribute to a secure electricity supply and the integration of
renewable energy into the supply system. However, due to a lack of long- Lignite and peat (1,160 MW, 1.2 %)
term political framework conditions across Europe, investment in new ca- Nuclear (11,800 MW, 12.2 %)
pacities is stalled.
Hydro (9,013 MW, 9.3 %)
According to the updated VGB PowerTech new construction statistics, the
technology of gas-fired power plants accounts for the largest share of the Wind (33,279 MW, 34.5 %)
{
available capacity of disposable conventional plants at around 30 %. With Biomass
a share of approx. 14 % these are followed by hard coal and lignite power (300 MW, 0.3 %)
plant projects, particularly in Eastern European countries. The low-emis- Residues and waste
(120 MW, 0.1 %)
sion sources nuclear and hydropower account for 12.3 % and 9.2 %. Pro-
Other renewables
jects based on non-schedulable generation technologies continue to focus Total*: 96,575 MW (300 MW, 0.3 %)
on wind power plants with a capacity share of approx. 34.5 %.
Within a decade, the projected and announced new build capacities gath-
ered have declined considerably, from 277,884 MW in 2010 to 96,563 MW * without photovoltaic, oil: no projects., incl. averages
in 2020. Source: Data base VGB, state: 2020
SEI T E 18 – 19FAC TS A N D FI G U R ES EL E C T R I C I T Y G EN ER AT I O N 2020 l 2021
CLIMATE POLICY: GLOBAL APPROACH NEEDED
B etween 1990 and 2018, the total greenhouse gas emissions (GHGE) in
the European Union (EU-28) decreased by 23.2 % (World Bank, EU,
state: 2018). Targets for climate and energy policy were revised by the EU
Current Policies Stated Policies Sustainable
Development
in billion (10 6 ) t CO 2
Commission in November 2018. The objective is to reduce EU emissions by
at least 40 % below 1990 levels by 2030.
2018
2040
2040
2040
For the stabilisation and actual reduction of GHGE emissions, action, based
on the principle of effectiveness and cost efficiency, has to be taken world- CO 2 emissions worldwide, total, energy sector
wide. Cost-efficient measures such as insulation of buildings, fossil-fired
Total* 33,243 41,302 35,589 15,796
power plants with higher efficiencies, the application of CCU (Carbon Cap-
ture and Utilisation), expanded use of renewables or further use of technolo- Coal 14,664 16,609 13,891 3,424
gies with low GHGE like nuclear energy must be applied with priority and Oil 11,446 14,053 12,001 6,433
without prejudice in order to mitigate the globally increasing amount of Natural gas 7,134 10,639 9,697 6,032
GHGE.
thereof electricity generation
The International Energy Agency (IEA) has developed a stabilisation con-
cept, “Sustainable Development”, which, compared with the reference sce- Coal 10,066 11,813 9,641 1,552
narios “Current Policies” – unchanged energy policy – and “Stated Policies” Oil 692 497 418 200
– taking into account announced measures for a more sustainable energy Natural gas 3,060 4,284 3,775 2,123
policy – aims to stabilise energy consumption and the CO2 concentration in
thereof other final energy consumption
the atmosphere through a bundle of instruments.
Total 17,809 22,561 19,895 11,037
IEA scenarios for the reduction of greenhouse gas emissions. Share of energy sources.
* incl. upstream and downstream sector Source: IEA, World Energy Outlook 2019CO2 emissions total and per capita from fossil fuel combustion CO2 emissions from different power plants
for selected regions for 2018 and changes from 1990 to 2018 in g CO2 equivalent per kWh,
calculated for the life cycle of the power plant
t CO2 per capita billion (109) t CO2 per year
BoA technology
0 1 2 3 4 5 6 20
Lignite 950 to 1,230
EU-28 6.1
Region | Change 1990 to 2018
- 18 % 3,518 790 to 1,080
Hard coal
India 1.96
+ 313 % 2,650 Oil 890
USA 16.56
+1 % 5,410 Natural gas 640
143 Gas
China 7.05 combined 410 to 430 Electricity generation with CCU
+ 347 % 10,060 cycle
127 Photovoltaik 35 to 160
World 4.14
+ 61 % 33,114
Nuclear 16 to 23
0 1 2 3 4 5 6 30 8 to 16 Result range due to different
Wind
methods of calculation
Hydro power 4 to 13 and different site implications.
Sources: U.S. Department of Energy’s (DOE) Environmental System Science Data Infrastructure for a Sources: PSI Paul Scherrer Institut/Switzerland, ESU-services, VGB (own calculations)
Virtual Ecosystem (ESS-DIVE) 2020, and IEA: CO2 emissions from fuel combustion
PAG E 20 – 21FAC TS A N D FI G U R ES EL E C T R I C I T Y G EN ER AT I O N 2020 l 2021
VGB POWERTECH E.V.
VGB PowerTech e.V. is the international technical association for generation Structure of the VGB membership:
and storage of power and heat with head office located in Essen (Germany).
Currently VGB has 436 members, comprising operators, manufacturers, and Fossil-fired power plants 227,500 MW
institutions connected with energy engineering. Nuclear power plants 32,500 MW
Our members come from 34 countries and represent an installed power plant Hydro power plants and other renewables 43,000 MW
capacity of 303,000 MW located in Europe. Total 303,000 MW
The activities of VGB PowerTech comprise: EU: 410 members in 20 countries
ll Provision of an international platform for the accumulation, exchange, Austria, Belgium, Croatia, Czech Republic, Denmark,
and transfer of technical know-how. Finland, France, Germany, Greece, Ireland, Italy, Latvia,
ll Acting as “gate-keeper” and provider of technical know-how for the Luxembourg, The Netherlands, Poland, Portugal, Romania,
member companies and other associations of our industry. Slovenia, Spain, Sweden
ll Harmonisation of technical and operational standards.
ll Identification and organisation of joint R&D activities. Other Europe: 14 members in 4 countries
ll Exclusive member access to qualified expert knowledge. Russia, Switzerland, Turkey, United Kingdom
ll Representation of members´ interests.
Outside Europe: 12 members in 10 countries
VGB is performing these tasks in close cooperation with Eurelectric on
Argentina, Canada, China, Israel, Japan, Malaysia,
European-level and further national and international associations.
Mongolia, Morocco, Saudi Arabia, South Africa
Total: 436 members in 34 countriesTASKS OF THE INTERNATIONAL
TECHNICAL ASSOCIATION VGB POWERTECH
General Assembly
VGB PowerTech e. V. supports its members with all technical
issues of generation and storage of electricity and heat in Board Technical Advisory
order to further optimise Scientific Advisory Board Board
of Directors
ll Safety
ll Efficiency Management
ll Environmental friendliness
ll Economic efficiency and Competence Areas for the Generation and Storage of Power and Heat
ll Occupational safety and health protection
The competence areas “Nuclear Power Plants”, “Power Plant Nuclear Renewables Environmental
Power Plant Technology, Technical
Technologies”, “Renewables and Distributed Generation”, Power and Distributed Chemistry, Safe-
Technologies Generation Services
Plants ty and Health
and “Environmental Technology, Chemistry, Safety and
Health” are dealing with all aspects of nuclear, conventional
and renewable generation. They are cooperating closely to
fully exploit the synergies.
The engineering services of the “Technical Services” with engi-
neering consulting, materials and oil laboratory and water
chemistry, the VGB Research Foundation, data bases, and pub-
lications. e.g. the technical journal VGB POWERTECH per-
fectly round off the portfolio of expertise of VGB PowerTech. VGB Committees
PAG E 22 – 23VGB PowerTech e.V. Editorial: Oliver Then (responsible),
Deilbachtal 173 Mario Bachhiesl, Ludger Mohrbach, Stefan Prost
45257 Essen | Germany and Christopher Weßelmann
September 2020
Phone: +49 201 8128 – 0 www.vgb.org | info@vgb.org
Fax: +49 201 8128 – 302 Photo credits: Offshore wind famr, EnBW,
battery storage, innogy, Andre Laaks,
SMR: Rolls-Royce, Rosatom, Decommissioning: GNSYou can also read