Trash Long-Term Reduction Plan and Progress Assessment Strategy - February 1, 2014 - Submitted by
←
→
Page content transcription
If your browser does not render page correctly, please read the page content below
Trash Long-Term Reduction Plan and
    Progress Assessment Strategy

                        February 1, 2014

                          Submitted by:
            Vallejo Sanitation and Flood Control District
                          450 Ryder Street
                         Vallejo, CA 94534

     In compliance with Provisions C.10.c of Order R2-2009-0074
Vallejo Sanitation and Flood Control District

                                                2
Page Intentionally Left Blank
iiiVallejo Sanitation and Flood Control District
Vallejo Sanitation and Flood Control District
LONG-TERM TRASH LOAD REDUCTION PLAN AND
ASSESSMENT STRATEGY
CERTIFICATION STATEMENT
"I certify, under penalty of law, that this document and all attachments were prepared
under my direction or supervision in accordance with a system designed to ensure that
qualified personnel properly gather and evaluate the information submitted. Based on my
inquiry of the person or persons who manage the system, or those persons directly
responsible for gathering the information, the information submitted, is, to the best of my
knowledge and belief, true, accurate, and complete. I am aware that there are significant
penalties for submitting false information, including the possibility of fine and
imprisonment for knowing violations.”
Signature by Duly Authorized Representative:
Daniel Tafolla 2/1/14
Environmental Services Director
ivLong‐Term Trash Load Reduction Plan
TABLE OF CONTENTS
LIST OF TABLES ............................................................................................................................................ V
LIST FIGURES ............................................................................................................................................... VI
ABBREVIATIONS ......................................................................................................................................... VII
PREFACE .........................................................................................................................................................2
1.0 INTRODUCTION ....................................................................................................................................2
1.1 PURPOSE OF LONG-TERM TRASH REDUCTION PLAN ........................................................................................ 2
1.2 BACKGROUND .................................................................................................................................................. 3
1.2.1 Long-Term Trash Load Reduction Plan Framework ............................................................................. 3
1.2.2 BASMAA Generation Rates Project....................................................................................................... 4
1.2.3 Short-Term Trash Load Reduction Plan ................................................................................................ 5
1.3 ORGANIZATION OF LONG-TERM PLAN ............................................................................................................. 6
2.0 SCOPE OF THE TRASH PROBLEM .....................................................................................................7
2.1 PERMITTEE CHARACTERISTICS ........................................................................................................................ 7
2.2 TRASH SOURCES AND PATHWAYS .................................................................................................................... 7
2.3 TRASH GENERATING AREAS ............................................................................................................................ 8
2.3.1 Generation Categories and Designation of Areas ................................................................................. 8
2.3.2 Summary of Trash Generating Areas and Sources .............................................................................. 10
3.0 TRASH MANAGEMENT AREAS AND CONTROL MEASURES....................................................... 13
3.1 MANAGEMENT AREA DELINEATION AND PRIORITIZATION ............................................................................ 13
3.2 CURRENT AND PLANNED TRASH CONTROL MEASURES ................................................................................. 16
3.3 CONTROL MEASURE IMPLEMENTATION SCHEDULE ....................................................................................... 17
4.0 PROGRESS ASSESSMENT STRATEGY ............................................................................................. 20
4.1 VALLEJO SANITATION AND FLOOD CONTROL DISTRICT PILOT ASSESSMENT STRATEGY................................. 20
4.1.1 Management Questions........................................................................................................................ 20
4.1.2 Indicators of Progress and Success ..................................................................................................... 20
4.1.3 Pilot Assessment Methods .................................................................................................................... 21
4.2 BASMAA “TRACKING CALIFORNIA’S TRASH” PROJECT............................................................................... 23
4.2.1 Testing of Trash Monitoring Methods ................................................................................................. 25
4.2.2 Full Capture Equivalent Studies .......................................................................................................... 25
4.3 LONG-TERM ASSESSMENT STRATEGY ........................................................................................................... 25
4.4 IMPLEMENTATION SCHEDULE ........................................................................................................................ 25
5.0 REFERENCES ...................................................................................................................................... 27
LIST OF TABLES
TABLE 1. SAN FRANCISCO BAY AREA TRASH GENERATION RATES BY LAND USE (GALLONS/ACRE/YEAR).
TABLE 2. PERCENTAGES OF THE DISTRICT'S JURISDICTIONAL AREA WITHIN LAND USE CLASSES IDENTIFIED BY ABAG
(2005)
TABLE 3. TRASH GENERATION CATEGORIES AND ASSOCIATED GENERATION RATES (GALLONS/ACRE/YEAR).
TABLE 4. DEFINITIONS OF ON-LAND TRASH ASSESSMENT CONDITION CATEGORIES.
TABLE 5. PERCENTAGE OF JURISDICTIONAL AREA WITHIN THE CITY/COUNTY OF [INSERT MUNICIPALITY NAME]
ASSIGNED TO EACH TRASH GENERATION CATEGORY.
TABLE 6. JURISDICTIONAL AREA AND PERCENTAGE OF EACH TRASH MANAGEMENT AREA (TMA) COMPRISED OF
TRASH GENERATION CATEGORIES
vVallejo Sanitation and Flood Control District
TABLE 7. VALLEJO SANITATINO AND FLOOD CONTROL DISTRICT'S TRASH CONTROL MEASURE IMPLEMENTATION
SCHEDULE.
TABLE 8. TRASH CONDITION CATEGORIES USED IN THE DRAFT ON-LAND VISUAL ASSESSMENT PROTOCOL.
TABLE 9. VALLEJO SANITATINO AND FLOOD CONTROL DISTRICT'S TRASH PROGRESS ASSESSMENT IMPLEMENTATION
SCHEDULE.
LIST FIGURES
FIGURE 1. EIGHT-STEP FRAMEWORK FOR DEVELOPING, IMPLEMENTING AND REFINING LONG-TERM TRASH
REDUCTION PLANS.
FIGURE 2. CONCEPTUAL MODEL OF TRASH GENERATION, INTERCEPTION AND LOAD.
FIGURE 3. TRASH SOURCES CATEGORIES AND TRANSPORT PATHWAYS TO URBAN CREEKS.
FIGURE 4. TRASH SOURCES CATEGORIES AND TRANSPORT PATHWAYS TO URBAN CREEKS.
FIGURE 5. FINAL TRASH GENERATION MAP FOR VALLEJO SANITATION AND FLOOD CONTROL DISTRICT.
FIGURE 6. TRASH MANAGEMENT AREA MAP FOR VALLEJO SANITATION AND FLOOD CONTROL DISTRICT.
viLong‐Term Trash Load Reduction Plan
ABBREVIATIONS
BASMAA Bay Area Stormwater Management Agencies Association
BID Business Improvement District
CalRecycle California Department of Resources Recycling and Recovery
Caltrans California Department of Transportation
CASQA California Stormwater Quality Association
CDS Continuous Deflection Separator
CEQA California Environmental Quality Act
CY Cubic Yards
EIR Environmental Impact Report
EPA Environmental Protection Agency
GIS Geographic Information System
MRP Municipal Regional Stormwater NPDES Permit
MS4 Municipal Separate Storm Sewer System
NGO Non-Governmental Organization
NPDES National Pollutant Discharge Elimination System
Q Flow
SFRWQCB San Francisco Regional Water Quality Control Board
SWRCB State Water Resource Control Board
TMDL Total Maximum Daily Load
USEPA United States Environmental Protection Agency
Water Board San Francisco Regional Water Quality Control Board
WDR Waste Discharge Requirements
viiVallejo Sanitation and Flood Control District
PREFACE
This Long-Term Trash Load Reduction Plan and Assessment Strategy (Long-Term Plan) is submitted in
compliance with provision C.10.c of the Municipal Regional Stormwater NPDES Permit (MRP) for
Phase I communities in the San Francisco Bay (Order R2-2009-0074). The Long-Term Plan was
developed using a regionally consistent outline and guidance developed by the Bay Area Stormwater
Management Agencies Association (BASMAA) and reviewed by San Francisco Bay Regional Water
Quality Control Board staff. The Long-Term Plan is consistent with the Long-Term Trash Load
Reduction Framework developed in collaboration with Water Board staff. Its content is based on the
Vallejo Sanitation and Flood Control District’s current understanding of trash problems within its
jurisdiction and the effectiveness of control measures designed to reduce trash impacts associated with
Municipal Separate Storm Sewer (MS4) discharges. This Long-Term Plan is intended to be iterative and
may be modified in the future based on information gained through the implementation of trash control
measures. Vallejo Sanitation and Flood Control District therefore reserves the right to revise or amend
this Long-Term Plan at its discretion. If significant revisions or amendments are made by Vallejo
Sanitation and Flood Control District, a revised Long-Term Plan will be submitted to the Water Board
through the Vallejo Sanitation and Flood Control annual reporting process.
2Vallejo Sanitation and Flood Control District
1.0 INTRODUCTION
1.1 Purpose of Long-Term Trash Reduction Plan
The Municipal Regional Stormwater National Pollutant Discharge Elimination System (NPDES) Permit
for Phase I communities in the San Francisco Bay (Order R2-2009-0074), also known as the Municipal
Regional Permit (MRP), became effective on December 1, 2009. The MRP applies to 76 large, medium
and small municipalities (cities, towns and counties) and flood control agencies in the San Francisco Bay
Region, collectively referred to as Permittees. Provision C.10.c of the MRP requires Permittees to submit
a Long-Term Trash Load Reduction Plan (Long-Term Plan) by February 1, 2014. Long-Term Plans must
describe control measures that are currently being implemented, including the level of implementation,
and additional control measures that will be implemented and/or increased level of implementation
designed to attain a 70% trash load reduction by July 1, 2017, and 100% (i.e., “No Visual Impact”) by
July 1, 2022.
This Long-Term Plan is submitted by Vallejo Sanitation and Flood Control District in compliance with
MRP provision C.10.c. Consistent with provision C.10 requirements, the goal of the Long-Term Plan is to
solve trash problems in receiving waters by reducing the impacts associated with trash in discharges from
the Vallejo Sanitation and Flood Control District’s municipal separate storm sewer system (MS4) that are
regulated by NPDES Permit requirements. The Long-Term Plan includes:
1. Descriptions the current level of implementation of trash control measures, and the type and
extent to which new or enhanced control measures will be implemented to achieve a target of
100% (i.e. full) trash reduction from MS4s by July 1, 2022, with an interim milestone of 70%
reduction by July 1, 2017;
2. A description of the Trash Assessment Strategy that will be used assess progress towards
trash reduction targets achieved as a result of control measure implementation; and,
3. Time schedules for implementing control measures and the assessment strategy.
The Long-Term Plan was developed using a regionally consistent outline and guidance developed by the
Bay Area Stormwater Management Agencies Association (BASMAA) and reviewed by the San Francisco
Bay Regional Water Quality Control Board (Water Board) staff. The Long-Term Plan is consistent with
the Long-Term Trash Load Reduction Framework (see section 1.2.1) developed in collaboration with
Water Board staff. Its content is based on the Vallejo Sanitation and Flood Control District’s current
understanding of trash problems within its jurisdiction and the effectiveness of control measures designed
to reduce trash impacts associated with Municipal Separate Storm Sewer (MS4) discharges. The Long-
Term Plan builds upon trash control measures implemented by the Vallejo Sanitation and Flood Control
District prior to the adoption of the MRP and during the implementation of the Short-Term Trash Load
Reduction Plan submitted to the Water Board on February 1, 2012.
2Long‐Term Trash Load Reduction Plan
1.2 Background
1.2.1 Long-Term Trash Load Reduction Plan Framework
A workgroup of MRP Permittee, Bay Area countywide stormwater, and Water Board staff met between
October 2012 and March 2013 to better define the process for developing and implementing Long-Term
Plans, methods for assessing progress toward reduction goals, and tracking and reporting requirements
associated with provision C.10. Through these discussions, an eight-step framework for developing and
implementing Long-Term Plans was created by the workgroup (Figure 1).
1. Identify and map trash generating areas
2. Identify trash sources
(as needed)
3. Delineate and prioritize management 8. Modify area designations &
areas reprioritize areas / problems
4. Identify/select control measures 7. Assess progress via defined methods
5. Define method(s) to assess progress 6. Implement control measures
Figure 1. Eight-step framework for developing, implementing and refining Long-Term Trash Reduction Plans.
The workgroup agreed that as the first step in the framework, Permittees would identify very high, high,
moderate, and low trash generating areas in their jurisdictional areas. Trash generation rates developed
through the BASMAA Baseline Trash Generation Rates Project (as discussed below) were used as a
starting point for differentiating and delineating land areas with varying levels of trash generation.
Permittees would then use local knowledge and field and/or desktop assessments to confirm or refine the
level of trash generation for specific areas within their jurisdiction. Each Permittee would then develop a
map depicting trash generation categories within their jurisdiction.
As a next step, Permittees would then delineate and prioritize Trash Management Areas (TMAs) where
specific control measures exist or are planned for implementation. TMAs delineated by Permittees are
intended to serve as reporting units in the future. Reporting at the management area level provides the
level of detail necessary to demonstrate implementation and progress towards trash reduction targets.
Once control measures are selected and implemented, Permittees will evaluate progress toward trash
reduction targets using outcome-based assessment methods. As the results of the progress assessments are
available, Permittees may choose to reprioritize trash management areas and associated control measures
designed to improve trash reduction within their jurisdictions.
3Vallejo Sanitation and
d Flood Control District
1.2.2 BASMAA
B Generation
G n Rates Pro
oject
Through approval
a of a BASMAA reegional projecct in 2010, Peermittees agreeed to work collaborativelyy to
develop a regionally co onsistent methhod to establiish trash geneeration rates w
within their juurisdictions. T
The
project, allso known as the BASMAA A Trash Generration Rates P Project (Geneeration Rates Project) assisted
Permittees in establishiing the rates of
o trash generration and ideentifying veryy high, high, m moderate andd low
trash geneerating areas.
The term “trash generaation” refers to the rate at which
w trash iss produced or generated onnto the surfacee of
the watersshed and is po otentially avaailable for tran
nsport via MS S4s to receivinng waters. Geeneration ratees do
not expliccitly take into account existting control measures
m that intercept trassh prior to traansport. Generration
rates are expressed
e as trash
t volume//acre/year and d were establiished via the Generation R Rates Project.
neration, the teerm “trash loaading” refers to the rate att which trash ffrom MS4s ennters
In contrasst to trash gen
receiving waters. Trash h loading ratees are also exp pressed as traash volume/accre/year and aare equal to orr less
than trash
h generation raates because theyt account for the effectts of control m
measures that intercept trassh
generatedd in an area beefore it is disccharged to a receiving wateer. Trash loadding rates are specific to
particular areas becausse they are dep pendent upon n the effectiveeness of contrrol measures iimplemented
within an area. Figure 2 illustrates th he difference between trassh generation and loading.
Fiigure 2. Conceeptual model of
o trash generattion, interceptioon and load.
Trash genneration rates were estimateed based on factors
f that siggnificantly afffect trash genneration (i.e., land
use and in
ncome). The method
m used tot the establissh trash generration rates foor each Permiittee builds offf
“lessons learned” from m previous trassh loading stu
udies conductted in urban aareas (Allisonn and Chiew 11995;
Allison ett al. 1998; Arm
mitage et al. 1998;
1 Armitaage and Rooseeboom 2000; Lippner et all. 2001; Armittage
2003; Kimm et al. 2004; County of Lo os Angeles 20 002, 2004a, 22004b; Armitaage 2007). Thhe method is bbased
on a conceptual model developed ass an outgrowtth of these stuudies (BASM MAA 2011b).
Trash gen
neration rates were develop ped through th he quantificattion and charaacterization oof trash capturred in
Water Board-recognizeed full-capturre treatment devices
d installled in the Sann Francisco Bay area. Trashh
generation
n rates estimaated from thiss study are listted for each lland use type.. Methods useed to develop trash
generation
n rates are moore fully desccribed in BAS SMAA (2011bb, 2011c, andd 2012).
4Long‐Term Trash Load Reduction Plan
Table 1. San Francisco Bay Area trash generation rates by land use (gallons/acre/year).
Land Use Lowb Bestb Highb
Commercial & Services 0.7 6.2 17.3
Industrial 2.8 8.4 17.8
a
Residential 0.3 - 30.2 0.5 - 87.1 1.0 - 257.0
a
Retail 0.7 - 109.7 1.8 - 150.0 4.6 - 389.1
K-12 Schools 3 6.2 11.5
Urban Parks 0.5 5.0 11.4
a
For residential and retail land uses, trash generation rates are provided as a range that takes into account the correlation between rates and
household median income.
b
For residential and retail land uses: Low = 5% confidence interval; Best = best fit regression line between generation rates and household
median income; and, High = 95% confidence interval. For all other land use categories: High = 90th percentile; Best = mean generation rate;
and, Low = 10th percentile.
1.2.3 Short-Term Trash Load Reduction Plan
In February 2012, Vallejo Sanitation and Flood Control District developed a Short-Term Plan that
described the current level of control measures implementation and identified the type and extent to
which new or enhanced control measures would be implemented to attain a 40% trash load reduction
from its MS4 by July 1, 2014. Since that time, the Vallejo Sanitation and Flood Control District has
begun to implement its short-term plan. Control measures implemented to date via the short-term trash
reduction plan are:
• Control Measure #1- Full Trash Capture.
In September, 2012 four large full trash capture devices were installed in Rindler creek West of I-
80 behind the Solano County Fairgrounds. These devices are located in Trash Management Area
#1. One additional large full trash capture device was installed on January, 2013. This device is
located in Trash Management Area #6, on a storm drain outfall into Lake Dalwigk.
• Control Measure #2- On-land Trash Clean-ups.
As necessary the District continues to fund debris removal from the remains of homeless
encampments. This State wide issue will continue to be a resource allocation problem for
Vallejo.
• Control Measure #4- Creek Clean-ups.
Not including Costal Cleanup day the District sponsors or directly funds an average of ten creek
clean-ups per year with approximately three cubic yards of trash removed in total.
Control measures described in this Long-Term Plan build upon actions taken to-date via Vallejo
Sanitation and Flood Control District’s Short-Term Plan. A full description of control measures
implemented via short and long-term plans is included in section 3.2. Outcomes associated with short-
term plan implementation will be reported in the Vallejo Sanitation and Flood Control District’s Fiscal
Year 2013-14 Annual Report, scheduled for submittal to the Water Board by September 15, 2014.
5Vallejo Sanitation and Flood Control District
1.3 Organization of Long-Term Plan
This Long-Term Plan is organized into the following sections:
1.0 Introduction;
2.0 Scope of the Trash Problem;
3.0 Trash Management Areas and Control Measures;
4.0 Progress Assessment Strategies; and
5.0 References
Section 2.0 is intended to provide a description of the extent and magnitude of the trash problem in the
Vallejo Sanitation and Flood Control District. Control measures that will be implemented by Vallejo
Sanitation and Flood Control District as a result of this Long-Term Plan are described in section 3.0.
Section 4.0 describes the methods that will be used to assess progress toward trash reduction targets.
6Long‐Term Trash Load Reduction Plan
2.0 SCOPE OF THE TRASH PROBLEM
2.1 Permittee Characteristics
The Vallejo Sanitation & Flood Control District is an independent special district created by the State of
California in 1952. Located in Solano County with a jurisdictional area of 17,718 acres and a population
of 115,942.
Land uses within Vallejo Sanitation and Flood Control District depicted in ABAG (2005) are provided
below.
Table 2. Percentages of Vallejo Sanitation and Flood Control District’s jurisdictional area1 within land use classes
identified by ABAG (2005)
Jurisdictional Area % of Jurisdictional
Land Use Category
(Acres) Area
Commercial and Services 634.7 3.6%
Industrial 1,089.1 6.1%
Residential 7,854.5 44.3%
Retail 891.8 5.0%
K-12 Schools 444.7 2.5%
Urban Parks 260.7 1.5%
Other 6542.3 36.9
2.2 Trash Sources and Pathways
Trash in San Francisco Bay Area creeks and shorelines originates from a variety of sources and is
transported to receiving waters by a number of pathways (Figure 3). Of the four source categories,
pedestrian litter includes trash sources from high traffic areas near businesses and schools, transitional
areas where food/drinks are not permitted (e.g. bus stops), and from public or private special events with
high volumes of people. Trash from vehicles occurs due to littering from automobiles and uncovered
loads. Inadequate waste container management includes sources such as overflowing or uncovered
containers and dumpsters as well as the dispersion of household and business-related trash and recycling
materials before, during, and after collection. On-land illegal dumping of trash is the final source
category.
1
A Permittee’s jurisdictional area is defined as the urban land area within a Permittee’s boundary that is not subject to stormwater NPDES
Permit requirements for traditional and non‐traditional small MS4s (i.e. Phase II MS4s) or the California Department of Transportation, or
owned and maintained by the State of California, the U.S. federal government or other municipal agency or special district (e.g., flood control
district).
7Vallejo Sanitation and
d Flood Control District
Trash is trransported to receiving waaters through three
t main paathways: 1) Stormwater Coonveyances; 22)
Wind; and d, 3) Direct Dumping.
D Storrmwater or urrban runoff coonveyance syystems (e.g., M MS4s) consistt of
curbs/guttters, and pipes and channels that discharge to urban ccreeks and thhe San Francissco Bay
shoreliness. Wind can also
a blow trassh directly intto creeks or thhe Bay. Lastlyy, trash in recceiving waterrs can
also originnate from direect dumping into
i urban creeeks and shorrelines.
This Longg-term Plan an nd associatedd trash controll measures deescribed in Seection 3.0 are focused on
reducing trash
t from on
ne of the transsport pathwayys illustrated iin Figure 3– sstormwater cconveyances..
Specificallly, the Long--term Plan is focused on reeducing the im mpacts of disccharges from MS4s to Sann
Francisco Area receiving waters and d the protectio
on of associatted beneficiall uses.
Source Pedestrian Inaadequate On‐land Littter from
Litter Waste Container Dumping V
Vehicles
C
Categories
Mannagement
TTransport Stormw
water
P
Pathways
Wind
d Direct Du
umping
Conveya
ances
Receiving
R
Waters Urban Creeks and the San Francisco Bay
B Estuary
Figu
ure 3. Trash so
ources categoriies and transpoort pathways too urban creeks.
2.3 Trash
T Gen
nerating Areas
2.3.1 Generation
G Categoriess and Desig
gnation of Areas
The proceess and methoods used to id
dentify the levvel of trash geeneration withhin the Vallejo Sanitation aand
Flood Conntrol District boundries aree described in
n this section and illustrateed in Figure 4.
Fig
gure 4. Trash sources
s categories and transpport pathways tto urban creekss.
8Long‐Term Trash Load Reduction Plan
As a first step, trash generation rates developed through the BASMAA Trash Generation Rates Project
were applied to parcels within the Vallejo Sanitation and Flood Control District based on current land
uses and 2010 household median incomes. A Draft Trash Generation Map was created as a result of this
application. The draft map served as a starting point for the Vallejo Sanitation and Flood Control District
to identify trash generating levels. Levels of trash generation are depicted on the map using four trash
generation rate (gallons/acre/year) categories that are symbolized by four different colors illustrated in
Table 3.
Table 3. Trash generation categories and associated generation rates (gallons/acre/year).
Category Very High High Moderate Low
Generation Rate
> 50 10-50 5-10Vallejo Sanitation and Flood Control District
Table 4. Definitions of on-land trash assessment condition categories.
On-land Assessment
Summary Definition
Condition Category
A
Effectively no trash is observed in the assessment area.
(Low)
B Predominantly free of trash except for a few pieces that are easily
(Moderate) observed.
C Trash is widely/evenly distributed and/or small accumulations are visible
(High) on the street, sidewalks, or inlets.
D Trash is continuously seen throughout the assessment area, with large
(Very High) piles and a strong impression of lack of concern for litter in the area.
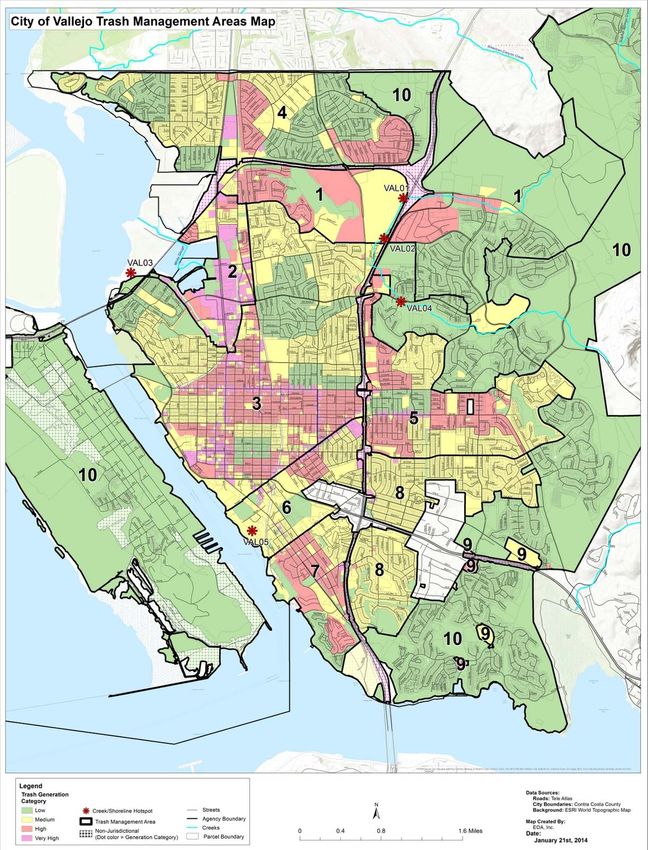
3. Based on assessments conducted to confirm/refine trash generation category designations, the
District created a final trash generation map that depicts the most current understanding of trash
generation within the City of Vallejo. The District documented this process by tracking the
information collected through the assessments and subsequent refinements to the Draft Trash
Generation Map. The Final Trash Generation Map is included as figure 5.
Summary statistics for land use and trash generation categories generated through the mapping and
assessment process are presented in Table 5.
Table 5. Percentage of jurisdictional area within the City of Vallejo assigned to each trash generation category.
Trash Commercial
Jurisdictional K‐12 Urban
Generation and Industrial Residential Retail Other
Area (Acres) Schools Parks
Category Services
Very High 476.0 0.0% 0.0% 0.0% 100.0% 0.0% 0.0% 0.0%
High 1,947.5 0.0% 0.0% 79.4% 20.6% 0.0% 0.0% 0.0%
Medium 4,314.1 14.5% 8.4% 60.3% 0.3% 10.3% 6.0% 0.0%
Low 10,980.3 0.1% 6.6% 33.7% 0.0% 0.0% 0.0% 59.6%
10Long‐Term Trash Load Reduction Plan
Figure 5. Final Trash Generation Map for Vallejo Sanitation and Flood Control District
11Vallejo Sanitation and Flood Control District
Page Intentionally Left Blank
12Long‐Term Trash Load Reduction Plan
3.0 TRASH MANAGEMENT AREAS AND CONTROL
MEASURES
This section describes the control measures that Vallejo Sanitation and Flood Control District has or plans
to implement to solve trash problems and achieve a target of 100% (i.e. full) trash reduction from their
MS4 by July 1, 2022. The selection of control measures described in this section is based on the District’s
current understanding of trash problems within its jurisdiction and the effectiveness of control measures
designed to reduce trash impacts associated with MS4 discharges. Information on the effectiveness of
some trash control measures is currently lacking and therefore in the absence of this information, the
District based its selection of control measures on existing effectiveness information, their experience in
implementing trash controls and knowledge of trash problems, and costs of implementation. As
knowledge is gained through the implementation of these control measures, the District may choose to
refine their trash control strategy described in this section. If significant revisions or amendments are
made, a revised Long-Term Plan will be submitted to the Water Board through the District’s annual
reporting process.
3.1 Management Area Delineation and Prioritization
Consistent with the long-term plan framework, Vallejo Sanitation and Flood Control District delineated
and prioritized trash management areas (TMAs) based on the geographical distribution of trash generating
areas, types of trash sources, and current or planned control measure locations. TMAs are intended to
form the management units by which trash control measure implementation can be tracked and assessed
for progress towards trash reduction targets. Once delineated, TMAs were also prioritized for control
measure implementation. The District’s primary management areas were selected based on the spatial
distribution of trash generating areas and the location of specific existing or planned management actions
within the District’s jurisdiction
A map depicting the District’s TMAs is included as Figure 6. All jurisdictional areas within the District
are included within a TMA. The amount of jurisdictional land area and associated trash condition
categories for each TMA are listed below.
Table 6. Jurisdictional area and percentage of each Trash Management Area (TMA) comprised of trash generation
categories
Trash Generation Rate
Jurisdictional Area
TMA Very
(Acres) High Medium Low
High
1 2,225.7 0.3% 19.6% 15.6% 64.5%
2 439.0 42.9% 17.1% 24.9% 15.1%
3 2,690.6 6.9% 19.2% 50.6% 23.3%
4 1,489.2 1.6% 17.3% 37.3% 43.8%
5 1,116.2 1.8% 33.3% 52.1% 12.8%
6 496.2 7.5% 9.2% 68.3% 15.0%
7 479.8 1.1% 44.9% 30.0% 23.9%
8 912.4 0.9% 0.3% 89.9% 9.0%
9 71.5 0.0% 21.3% 76.3% 2.4%
10 7,797.3 0.0% 0.1% 0.1% 99.8%
13Vallejo Sanitation and Flood Control District
Figure 6. Trash Management Area Map for Vallejo Sanitation and Flood Control District
14Long‐Term Trash Load Reduction Plan
Page Intentionally Left Blank
15Vallejo Sanitation and Flood Control District
3.2 Current and Planned Trash Control Measures
3.2.1 Trash Management Area #1
This area is located West of I-80 and comprises 2225 acres. This is the location of the first series of full
trash capture devices installed in the District. This area has been known for a typically large amount of
trash converging into Rindler creek. This is also the location of several volunteer and District funded
clean-ups. The actions in this area were initiated after the MRP effective date.
3.2.2 Trash Management Area #2
This area is located on the West side of Vallejo and comprises 439 acres. This area has a very high trash
generation rate of 42.9%. This site is one of our Costal Cleanup Day sites and usually has several hundred
participants. These actions were implemented after the MRP effective date. For future implementation
the District will be investigating the potential for a full trash capture device installation.
3.2.3 Trash Management Area #3
This area is West of I-80 and comprises 2690 acres. Roughly centered in the City this area is largely
residential with a very high trash generation rate of 6.9%, a high rate of 19.2% and a medium trash
generation rate of 50.6%. Few actions have been addressed in this area. Future implementation will
include increased on land trash cleanups, potential increased street sweeping and the possibility of full
capture device installation.
3.2.4 Trash Management Area #4
Located in the Northern end of Vallejo this area is comprised of 1489 acres. Largely residential with a
small area of commercial businesses. Future efforts will include increased on land cleanups and potential
increased street sweeping.
3.2.5 Trash Management Area #5
This largely residential area is located on the East side of I-80 and comprises 1116 acres. Future efforts
will include increased on land cleanups and potential increased street sweeping.
3.2.6 Trash Management Area #6
This area is located in the South Western end of Vallejo and is comprised of 496 acres. This is the
location of the most recently installed full trash capture device. Future plans potentially include another
full capture device installation.
3.2.7 Trash Management Area #7
This area is West of I-80 on the Southern end of Vallejo and is comprised of 479 acres. This is a common
Costal Cleanup Day site and also the location of several District sponsored on land cleanups. Future
plans include investigating the potential for a large trash capture device installation.
3.2.8 Trash Management Area #8
This area is East of I-80 and comprises 912 acres. Future efforts will include increased on land cleanups
and potential increased street sweeping.
16Long‐Term Trash Load Reduction Plan
3.2.9 Trash Management Area #9
This area includes several small areas of higher generation rates dispersed in the largely green area of
TMA #10. Future efforts will include increased on land cleanups and investigating the potential of a full
trash capture device.
3.2.10 Trash Management Area #10
This area is located on the far Eastern side of Vallejo and also Mare Island it is comprised of 7797 acres.
This is a very low generation area and will be included in control measures as necessary.
3.3 Control Measure Implementation Schedule
See Table 7 for Vallejo Sanitation and Flood Control District’s trash control measure implementation
schedule. This Table shall be reviewed and revised as needed as future measures are implemented.
17Vallejo Sanitation and Flood Control District
Table 7. Vallejo Sanitation and Flood Control District trash control measure implementation schedule.
Short-Term Long-Term
FY 2016-2017b
FY 2013-2014a
FY 2021-2022c
FY 2009-2010
FY 2010-2011
FY 2011-2012
FY 2012-2013
FY 2014-2015
FY 2015-2016
FY 2017-2018
FY 2018-2019
FY 2019-2020
FY 2020-2021
Trash Management Area and
Pre-MRP
Control Measures
TMA #1
Control Measure #1-Full trash capture x
Control Measure #1-On land cleanups x
TMA #2
Control Measure #1-On land cleanups x
Control Measure #2-Full trash capture x
TMA #3
Control Measure #-On land cleanups x
Control Measure #2-Increased street sweeping x
Control Measure #3-Full trash capture x
TMA #4
Control Measure #1-On land cleanups x
Control Measure #2-Increased street sweeping x
TMA #5
Control Measure #1-On land cleanups x
Control Measure #2-Increased street sweeping x
TMA # 6
Control Measure #1-Full trash capture x
18Long‐Term Trash Load Reduction Plan
Short-Term Long-Term
FY 2016-2017b
FY 2013-2014a
FY 2021-2022c
FY 2009-2010
FY 2010-2011
FY 2011-2012
FY 2012-2013
FY 2014-2015
FY 2015-2016
FY 2017-2018
FY 2018-2019
FY 2019-2020
FY 2020-2021
Trash Management Area and
Pre-MRP
Control Measures
TMA #7
Control Measure #1-On land cleanups x
Control Measure #2-Full trash capture x
TMA # 8
Control Measure #1-On land cleanups x
Control Measure #2-Increased street sweeping x
TMA #9
Control Measure #1-On land cleanups x
Control Measure #2-Full trash capture x
TMA #10
Control Measure #1-On land cleanups x
a
July 1, 2014 - 40% trash reduction target
b
July 1, 2017 - 70% trash reduction target
c
July 1, 2022 - 100% trash reduction target
19Long‐Term Trash Load Reduction Plan
4.0 PROGRESS ASSESSMENT STRATEGY
Provision C.10.a.ii of the MRP requires Permittees to develop and implement a trash load reduction
tracking method that will be used to account for trash load reduction actions and to demonstrate progress
and attainment of trash load reduction targets. Early into the MRP, Permittees decided to work
collaboratively to develop a trash load reduction tracking method through the Bay Area Stormwater
Management Agencies Association (BASMAA). Permittees, Water Board staff and other stakeholders
assisted in developing Version 1.0 of the tracking method. On behalf of all MRP Permittees, the Bay Area
Stormwater Management Agencies Association (BASMAA) submitted Version 1.0 to the Water Board on
February 1, 2012.
The Trash Assessment Strategy (Strategy) described in this section is intended to serve as Version 2.0 of
the trash tracking method and replace version 1.0 previously submitted to the Water Board. The Strategy
is specific to Vallejo Sanitation and Flood Control District. The Distirct intends to implement the Strategy
in phases and at multiple geographical scales (i.e., jurisdiction-wide and trash management area) in
collaboration with the City of Vallejo. Pilot implementation is scheduled for the near-term and as
assessment methods are tested and refined, the Strategy will be adapted into a longer-term approach. The
Strategy selected by the District is described in the following sections.
4.1 Pilot Assessment Strategy
The following Vallejo Sanitation and Flood Control Trash Assessment Strategy was developed by the
Distirct. The District’s Strategy will be implemented at a pilot scale on a countywide basis and includes
measurements and observations in the City of Vallejo.
4.1.1 Management Questions
The District’s strategy is intended to answer the following core management questions over time as trash
control measures outlined in section 3.0 are implemented and refined:
• Are the MS4 trash load reduction targets being achieved?
• Have trash problems in receiving waters been resolved?
• If trash problems in receiving waters exist, what are the important sources and transport
pathways?
The District’s strategy, including indicators and methods, is summarized in this section.
4.1.2 Indicators of Progress and Success
The management questions listed in the previous section will be addressed by tracking information and
collecting data needed to report on a set of key environmental indicators. Environmental indicators are
simple measures that communicate what is happening in the environment. Since trash in the environment
is very complex, indicators provide a more practical and economical way to track the state of the
environment than if we attempted to record every possible variable.
With regard to municipal stormwater trash management, indicators are intended to detect progress
towards trash load reduction targets and solving trash problems. Ideally, indicators should be robust and
able to detect progress that is attributable to multiple types of trash control measure implementation
scenarios. Assessment results should also provide Permittees with an adequate level of confidence that
trash load reductions from MS4s have occurred, while also assessing whether trash problems in receiving
20Long‐Term Trash Load Reduction Plan
waters have been resolved. Indicators must also be cost effective, relatively easy to generate, and
understandable to stakeholders.
Primary and secondary indicators that the District will use to answer core management questions include:
Primary Indicators:
1-A Reduction in the level of trash present on-land and available to MS4s
1-B Effective full capture device operation and maintenance
Secondary Indicators:
2-A Successful levels of trash control measures implementation
2-B Reductions in the amount of trash in receiving waters
In selecting the indicators above, the District recognize that no one environmental indicator will provide
the information necessary to effectively determine progress made in reducing trash discharged from MS4s
and improvements in the level of trash in receiving waters. Multiple indicators were therefore selected.
The ultimate goal of municipal stormwater trash reduction strategies is to reduce the impacts of trash
associated with MS4s on receiving waters. Indicators selected to assess progress towards this goal should
ideally measure outcomes (e.g., reductions in trash discharged). The primary indicators selected by the
District are outcome-based and include those that are directly related to MS4 discharges. Secondary
indicators are outcome or output-based and are intended to provide additional perspective on and
evidence of, successful trash control measure implementation and improvements in receiving water
condition with regard to trash.
As described in Section 2.2, trash is transported to receiving waters from pathways other than MS4s,
which may confound our ability to observe MS4-associated reductions in creeks and shorelines. Due to
this challenge of linking MS4 control measure implementation to receiving water conditions, the
receiving water based indicator is currently considered a secondary indicator. Evaluations of data on the
amount of trash in receiving waters that are conducted over time through the Pilot Assessment Strategy
will assist the District in further determinations of the important sources and pathways causing problems
in local creeks, rivers and shorelines.
4.1.3 Pilot Assessment Methods
1-A. On-land Visual Assessments
As part of the Trash Generation Map assessment and refinement process (see Section 2.3.1), a draft
on-land visual assessment method was developed to assist Permittees in confirming and refining trash
generating area designations (i.e., very high, high, moderate and low trash generating categories). The
draft on-land visual assessment method is intended to be a cost-effective tool and provide Permittees
with a viable alternative to quantifying the level of trash discharged from MS4s. As part of
BASMAA’s Tracking California’s Trash grant received from the State Water Resources Control
Board (see Section 4.2), quantitative relationships between trash loading from MS4s and on-land
visual assessment condition categories will be established. Condition categories defined in the draft
on-land assessment protocol are listed in Table 8
21Vallejo Sanitation and Flood Control District
Table 8. Trash condition categories used in the draft on-land visual assessment protocol.
Trash Condition
Summary Definition
Category
A
Effectively no trash is observed in the assessment area.
(Low)
B Predominantly free of trash except for a few pieces that are easily
(Moderate) observed.
C Trash is widely/evenly distributed and/or small accumulations are
(High) visible on the street, sidewalks, or inlets.
D Trash is continuously seen throughout the assessment area, with large
(Very High) piles and a strong impression of lack of concern for litter in the area.
On-land visual assessments will be conducted in trash management areas within the City of Vallejo as
part of the District’s strategy. On-land assessments are intended to establish initial conditions and
detect improvements in the level of trash available to MS4s over time. More specifically, on-land
visual assessment methods will be conducted in areas not treated by trash full capture devices in an
attempt to evaluate reductions associated with other types of control measures. Assessment methods
for areas treated by full capture devices are described in this next section.
Given that the on-land assessment method and associated protocol have not been fully tested and
refined, initial assessments will occur at a pilot scale in the City and in parallel to the Tracking
California’s Trash project
1-B. Full Capture Operation and Maintenance Verification
Consistent with the MRP, adequate inspection and maintenance of trash full capture devices is
required to maintain full capture designation by the Water Board. The District is currently developing
an operation and maintenance verification program (Trash O&M Verification Program), to ensure
that devices are inspected and maintained at a level that maintains this designation. The District’s
Trash O&M Verification Program will be modeled on the current O&M verification program for
stormwater treatment controls implemented consistent with the Permit new and redevelopment
requirements.
2-A. Control Measure Effectiveness Evaluations
In addition to on-land trash assessments and full capture operation and maintenance verification, the
District will also conduct assessments of trash control measures implemented within their
jurisdictional area. Assessment methods will be selected based on trash sources and the type of
control measure being implemented. The following are example assessment methods that may be
used to demonstrate successful control measure implementation and progress towards trash reduction
targets:
• Street Sweeping – Reporting the frequency of sweeping and ability to sweep to the curb in
specific areas where enhanced sweeping is implemented; and/or documenting the level of trash
on streets directly after street sweeping during wet and dry weather seasons.
22Long‐Term Trash Load Reduction Plan
• Public/Private Trash Container Management – Reporting the magnitude and extent of enhanced
actions; and/or visually assessing and documenting conditions around public trash containers
before and after implementing enhanced control measures.
• Targeted Outreach and Enforcement – Reporting the magnitude and extent of enhanced actions;
tracking and reporting the % increase in enforcement actions; and/or visually assessing and
documenting the conditions in targeted areas before and after implementing control measures.
• Public Outreach Campaigns – Reporting the magnitude and extent of enhanced actions, and/or
conducting pre and post campaign surveys.
• On-land Cleanups and Enforcement – Reporting the magnitude and extent of enhanced actions;
visually assessing and documenting the conditions in targeted areas before and after control
measure implementation; and/or tracking the volumes of trash removed.
• Illegal Dumping Prevention – Reporting the magnitude and extent of enhanced actions; and/or
tracking and reporting improvements in the number of incidents.
• Business Improvement Districts – Reporting the magnitude and extent of enhanced actions;
and/or visually assessing and documenting the conditions in BID areas before and after
implementing control measures.
• Prevention of Uncovered Loads - Reporting the magnitude and extent of enhanced actions;
tracking and reporting the decreases in the number of incidents; and/or visually assessing and
documenting the conditions in targeted areas before and after implementing control measures.
• Partial Capture Devices – Reporting the magnitude and extent of enhanced actions; and/or
visually assessing and the amount of trash in storm drains or downstream of partial capture
devices.
2-C. Receiving Water Condition Assessments
The ultimate goal of stormwater trash management in the Bay Area is to significantly reduce the
amount of trash found in receiving waters. In the last decade, Permittees and volunteers have
collected data on the amounts of trash removed during cleanup events. More recently, Permittees
have conducted trash assessments in creek and shoreline hotspots using standardized assessment
methods. In an effort to answer the core management question Have trash problems in receiving
waters been resolved?, the District plans to continue conducting receiving water condition
assessments at trash hot spots a minimum of one time per year. Assessment will be conducted
consistent with Permit hot spot cleanup and assessment requirements.
4.2 BASMAA “Tracking California’s Trash” Project
The District’s strategy described in the previous section recognizes that outcome-based trash assessment
methods needed to assess progress toward trash reduction targets are not well established by the scientific
community. In an effort to address these information gaps associated with trash assessment methods, the
Bay Area Stormwater Management Agencies Association (BASMAA), in collaboration with Vallejo
Sanitation and Flood Control District, the 5 Gyres Institute, San Francisco Estuary Partnership, the City
of Los Angeles, and other stormwater programs in the Bay Area, developed the Tracking California’s
Trash Project. The Project is funded through a Proposition 84 grant awarded to BASMAA by the State
Water Resources Control Board (SWRCB) who recognized the need for standardized trash assessment
methods that are robust and cost-effective.
23Vallejo Sanitation and Flood Control District
The Project is intended to assist BASMAA member agencies in testing trash assessment and monitoring
methods needed to evaluate trash levels in receiving waters, establish control measures that have an
equivalent performance to trash full capture devices, and assess progress in trash reduction over time. The
following sections provide brief descriptions of tasks that BASMAA will conduct via the three-year
Project. Full descriptions of project scopes, deliverables, and outcomes will be developed as part of the
task-specific Sampling and Analysis Plans required by the SWRCB during the beginning of the Project.
The Project is currently underway and will continue through 2016.
24Long‐Term Trash Load Reduction Plan
4.2.1 Testing of Trash Monitoring Methods
BASMAA and the 5 Gyres Institute will evaluate the following two types of assessment methods as part
of the Project:
• Trash Flux Monitoring – Trash flux monitoring is intended quantify the amount of trash
flowing in receiving waters under varying hydrological conditions. Flux monitoring will be tested
in up to four receiving water bodies in San Francisco Bay and/or the Los Angeles areas. Methods
selected for evaluation and monitoring will be based on a literature review conducted during this
task and through input from technical advisors and stakeholders. Monitoring is scheduled to begin
in 2014 and will be completed in 2016.
• On-land Visual Assessments – As part of the Project, BASMAA will also conduct an evaluation
of on-land visual assessment methods that are included in the FSUMRP Strategy. The methods
are designed to determine the level of trash on streets and public right-of-ways that may be
transported to receiving waters via MS4s. BASMAA plans to conduct field work associated with
the evaluation of on-land visual assessment at a number of sites throughout the region. To the
extent practical, sites where the on-land methods evaluations take place will be coordinated with
trash flux monitoring in receiving waters. On-land assessments will occur in areas that drain to
trash full capture devices, and all sites will be assessed during wet and dry weather seasons in
order to evaluate on-land methods during varying hydrologic conditions. Monitoring is scheduled
to begin in 2014 and will be completed in 2016.
4.2.2 Full Capture Equivalent Studies
Through the implementation of BASMAA’s Tracking California’s Trash grant-funded project, a small set
of “Full Capture Equivalent” projects will also be conducted in an attempt to demonstrate that specific
combinations of control measures will reduce trash to a level equivalent to full capture devices. Initial
BMP combinations include high-frequency street sweeping, and enhanced street sweeping with auto-
retractable curb inlet screens. Other combinations will also be considered. Studies are scheduled to begin
in 2014 and will be completed in 2016.
4.3 Long-Term Assessment Strategy
The District is committed to implementing standardized assessment methods post-2016 based on the
lessons learned from pilot assessments and studies that will occur between 2014 and 2016. Assessment
activities described in the previous sections will evaluate the utility of different assessment methods to
demonstrate progress towards trash reduction targets and provide recommended approaches for long-term
implementation. Lessons learned will be submitted to the Water Board with the FY 2015-2016 Annual
Report and a revised Strategy will be developed and submitted, if necessary. The revised Strategy will
include agreed upon assessment methods that will be used to demonstrate progress during the remaining
term of trash reduction requirements. Reporting using the new/revised methods will begin with the FY
2016-17 Annual Report.
4.4 Implementation Schedule
The implementation schedule for the District’s Short-term Strategy, BASMAA’s Tracking California’s
Trash project, and the Long-Term Assessment Strategy are included in table 9. Load reduction reporting
milestones are also denoted in the table. The schedule is consistent with the need for near-term pilot
assessment results to demonstrate progress toward short-term targets, while acknowledging the need for
testing and evaluation of assessment methods and protocols prior to long-term implementation.
25Vallejo Sanitation and Flood Control District
Table 9. Vallejo Sanitation and Flood Control District trash progress assessment implementation schedule.
Fiscal Year
Prior to FY
2013-14
2016-17b
2013-14a
2021-22c
2014-15
2015-16
2017-18
2018-19
2019-20
2020-21
Trash Assessment Programs and Methods
Short-Term Trash Assessment Strategy
On-land Visual Assessments
Initial (Baseline) Assessments X
Pilot Progress Assessments X X X X
Full Capture Operation and Maintenance Verification X X X
Control Measure Effectiveness Evaluations X X X X X
Receiving Water Condition Assessments X X X X X
Tracking California’s Trash Project (BASMAA)
Testing of Trash Monitoring Methods
Trash Flux Monitoring Protocol Testing X X X
On-land Visual Assessment Evaluations X X X
Full Capture Equivalent Studies X X X
Long-Term Trash Assessment Strategy X X X X X
a
July 1, 2014 - 40% trash reduction target
b
July 1, 2017 - 70% trash reduction target
c
July 1, 2022 - 100% trash reduction target
26Long‐Term Trash Load Reduction Plan
5.0 REFERENCES
Allison R.A. and F.H.S. Chiew 1995. Monitoring stormwater pollution from various land uses in an urban catchment.
Proceedings from the 2nd International Symposium on Urban Stormwater Management, Melbourne, 551-516.
Allison, R.A., T.A. Walker, F.H.S. Chiew, I.C. O’Neill and T.A McMahon 1998. From Roads to rivers: Gross pollutant removal
from urban waterways. Report 98/6. Cooperative Research Centre for Catchment Hydrology. Victoria, Australia. May
1998.
Armitage, N. 2003. The removal of urban solid waste from stormwater drains. Prepared for the International Workshop on Global
Developments in Urban Drainage Management, Indian Institute of Technology, Bombay, Mumbai India. 5-7 February 2003.
Armitage, N. 2007. The reduction of urban litter in the stormwater drains of South Africa. Urban Water Journal Vol. 4, No. 3:
151-172. September 2007.
Armitage N., A. Rooseboom, C. Nel, and P. Townshend 1998. “The removal of Urban Litter from Stormwater Conduits and
Streams. Water Research Commission (South Africa) Report No. TT 95/98, Prestoria.
Armitage, N. and A. Rooseboom 2000. The removal of urban litter from stormwater conduits and streams: Paper 1 – The
quantities involved and catchment litter management options. Water S.A. Vol. 26. No. 2: 181-187.
ABAG (Association of Bay Area Governments). 2005. Bay Area Land Use Geographical Information Systems Datalayer.
BASMAA (Bay Area Stormwater Management Agencies Association). 2011a. Progress Report on Methods to Estimate Baseline
Trash Loads from Bay Area Municipal Stormwater Systems and Track Loads Reduced. February 2011.
BASMAA (Bay Area Stormwater Management Agencies Association). 2011b. Method to Estimate Baseline Trash Loads from
Bay Area Municipal Stormwater Systems: Technical Memorandum #1. Prepared by EOA, Inc. April 2011.
BASMAA (Bay Area Stormwater Management Agencies Association). 2011c. Sampling and Analysis Plan. Prepared by EOA,
Inc. April 2011.
BASMAA (Bay Area Stormwater Management Agencies Association). 2012. Trash Baseline Generation Rates: Technical
Report. Prepared by EOA, Inc. February 1, 2012.
County of Los Angeles. 2002. Los Angeles County Litter Monitoring Plan for the Los Angeles River and Ballona Creek Trash
Total Maximum Daily Load. May 30, 2002.
County of Los Angeles. 2004a. Trash Baseline Monitoring Results Los Angles River and Ballona Creek Watershed. Los Angeles
County Department of Public Works. February 17, 2004.
County of Los Angeles 2004b. Trash Baseline Monitoring for Los Angles River and Ballona Creek Watersheds. Los Angeles
County Department of Public Works. May 6, 2004.
Kim, L.H, M. Kayhanian, M.K. Stenstrom 2004. Event mean concentration and loading of litter from highways during storms.
Science of the Total Environment Vol 330: 101-113.
Lippner, G., R. Churchwell, R. Allison, G. Moeller, and J. Johnston 2001. A Scientific Approach to Evaluating Storm Water
Best Management Practices for Litter. Transportation Research Record. TTR 1743, 10-15.
27You can also read