Rail Service Expansion from Oshawa to Bowmanville and New Rail Maintenance Facility in Whitby Air Quality Assessment Report - Metrolinx
←
→
Page content transcription
If your browser does not render page correctly, please read the page content below
GO Transit

Rail Service Expansion from Oshawa to
Bowmanville and New Rail Maintenance Facility in
Whitby
Air Quality Assessment Report

Prepared by:

AECOM
105 Commerce Valley Drive West, Floor 7, Markham, ON, Canada L3T 7W3
T 905.886.7022 F 905.886.9494 www.aecom.com

Project Number:

60115182

Date:

January 2011
AECOM
105 Commerce Valley Drive West, Floor 7, Markham, ON, Canada L3T 7W3
T 905.886.7022 F 905.886.9494 www.aecom.com

Statement of Qualifications and Limitations

The attached Report (the “Report”) has been prepared by AECOM Canada Ltd. (“Consultant”) for the benefit of
the client (“Client”) in accordance with the agreement between Consultant and Client, including the scope of work
detailed therein (the “Agreement”).

The information, data, recommendations and conclusions contained in the Report:

   •   are subject to the scope, schedule, and other constraints and limitations in the Agreement and the
       qualifications contained in the Report (the “Limitations”)
   •   represent Consultant’s professional judgement in light of the Limitations and industry standards for the
       preparation of similar reports
   •   may be based on information provided to Consultant which has not been independently verified
   •   have not been updated since the date of issuance of the Report and their accuracy is limited to the
       time period and circumstances in which they were collected, processed, made or issued
   •   must be read as a whole and sections thereof should not be read out of such context
   •   were prepared for the specific purposes described in the Report and the Agreement
   •   in the case of subsurface, environmental or geotechnical conditions, may be based on limited testing
       and on the assumption that such conditions are uniform and not variable either geographically or over
       time

Unless expressly stated to the contrary in the Report or the Agreement, Consultant:

   •   shall not be responsible for any events or circumstances that may have occurred since the date on
       which the Report was prepared or for any inaccuracies contained in information that was provided to
       Consultant
   •   agrees that the Report represents its professional judgement as described above for the specific
       purpose described in the Report and the Agreement, but Consultant makes no other representations
       with respect to the Report or any part thereof
   •   in the case of subsurface, environmental or geotechnical conditions, is not responsible for variability in
       such conditions geographically or over time

The Report is to be treated as confidential and may not be used or relied upon by third parties, except:

   •   as agreed by Consultant and Client
   •   as required by-law
   •   for use by governmental reviewing agencies

Any use of this Report is subject to this Statement of Qualifications and Limitations. Any damages arising from
improper use of the Report or parts thereof shall be borne by the party making such use.

This Statement of Qualifications and Limitations is attached to and forms part of the Report.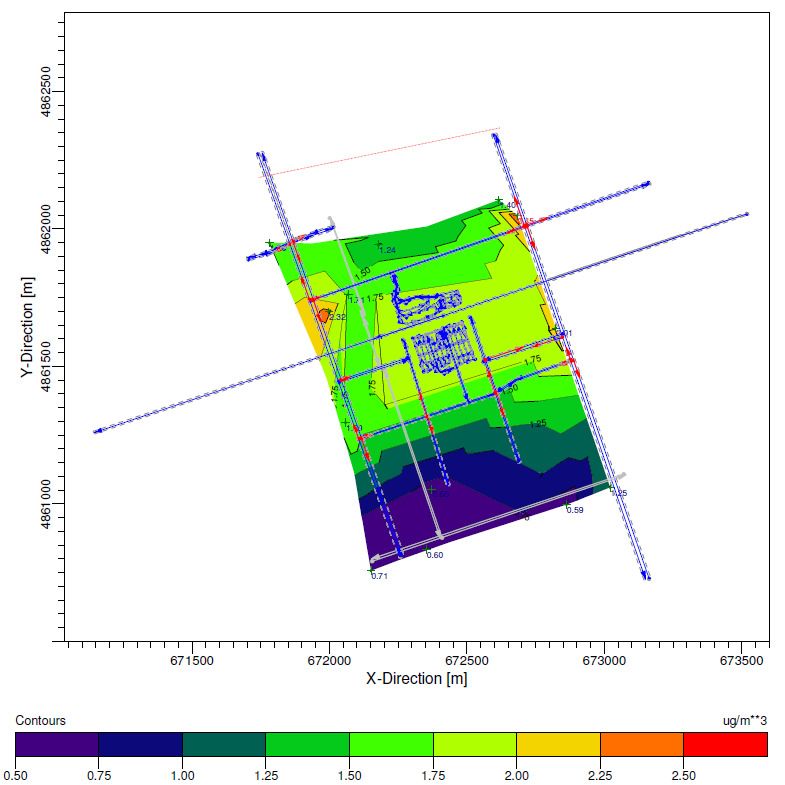
GO Transit
Rail Service Expansion from Oshawa to Bowmanville and New Rail Maintenance Facility in Whitby
Air Quality Assessment Report

Revision Log

Revision #      Revised By            Date                            Issue / Revision Description
GO Transit
Rail Service Expansion from Oshawa to Bowmanville and New Rail Maintenance Facility in Whitby
Air Quality Assessment Report

Signature Page

Report Prepared By:                                        Report Prepared By:

Timothy Reyes, BASc                                        Thomas Werner, P. Eng.
Air Quality Specialist                                     Air Quality Engineer

Report Prepared By:

Muqeeth Syed, E.I.T.
Air Quality Engineer-in-Training

Report Reviewed By:

Derek Shaw, P.Eng.
Compliance Lead
GO Transit
Rail Service Expansion from Oshawa to Bowmanville and New Rail Maintenance Facility in Whitby
Air Quality Assessment Report

Executive Summary

AECOM was retained by GO Transit to prepare an Air Impact Assessment for the proposed GO Transit rail
expansion of the Lakeshore East operations from Whitby to Clarington, Ontario to accommodate increased ridership
demand along this corridor.

The proposed project would provide new GO Transit commuter rail service between Oshawa and Bowmanville. It
would require the construction of four (4) new GO Transit rail stations, one (1) new layover facility and one (1) new
maintenance facility along the existing Canadian National Railway (CNR) and Canadian Pacific Railway (CPR) rail
corridors.

The purpose of the Air Impact Assessment is to predict the potential air quality impacts of the GO Transit expansion
in Durham Region. The objective of the report is to provide a comparison of the air quality impacts resulting from the
proposed expansion to an established future baseline and evaluate how the proposed expansion may potentially
affect air quality in the study area. The pollutants of concern are nitrogen oxides (NOx), carbon monoxide (CO),
sulphur dioxide (SO2) and particulate matter (PM). Select VOC emissions were also assessed and include
acetaldehyde, acrolein, benzene, 1,3-butadiene, and formaldehyde.

Local air quality impacts were determined by comparing predicted modelled concentrations and ambient levels at
representative sensitive receptors of CO, NOx, SO2, PM and VOCs to established standards or guidelines. Regional
air quality impacts were determined by estimating and comparing the differences in air pollutant emissions from the
total transportation mix, using an emission inventory approach. All analysis was performed for the years 2015 and
2031 based on the future no-build and future build scenarios.

Ambient data for TSP and PM10 are not readily available. Background values for TSP and PM10 were calculated using
MOE approved ratios (PM2.5 / PM10 = 0.54 and PM2.5 / TSP = 0.3). In addition, all station models investigating PM
assumed that TSP and PM10 emissions are that of PM2.5. This is considered to be a conservative estimate for
dispersed TSP levels, since it is expected that the larger particles in TSP should settle quicker than the smaller
fraction of PM10 or PM2.5 and the vast majority of combustion emissions are PM2.5.

As discussed in Section 2 “Approach and Methodology” of this report, the Base Case for this specific project was
assessed using ambient air concentrations for the pollutants of interest and were extracted from Ontario Ministry of
Environment and the Federal National Air Pollution Surveillance (NAPS) program. This data was used to represent
the current base year. The background contaminant concentration levels may include emissions resulting from
current traffic levels. The modelled point of impingement (POI) adds local traffic values to this background
contaminant concentration resulting in a highly conservative analysis.

Future traffic maps, plans and reports were reviewed to build the road networks and links around the proposed GO
stations. Sensitive receptor locations were evaluated and extracted from secondary sources and a field investigation.
Using the traffic information, representative emissions rates were developed for vehicular flow using MOBILE 6.2.

The collected data and generated vehicular emission rates were used in an air dispersion model, CAL3QHCR. The
CAL3QHCR air dispersion model is a recognized tool developed by the USEPA for assessing emissions from linear
sources such as roadways. The main inputs required for the model include, a base map of road network, the location
of receptors and road segments, vehicle exhaust emission factors (i.e., g/VmT) for the road segments, the overall
peak hourly traffic flow in each area, traffic signal timing used to calculate idle times and length of traffic queuing; and
one year (2000) of meteorological data.

The CAL3QHCR model was run using urban settings as outlined in the US EPA document Guideline on Air Quality
Models (40 CFR Part 51, Appendix W). The gaseous contaminants such as CO, SO2, NOx and VOCs were modelled
using the CO option, while the particulate contaminants used the PM option. Presented results are based on a 1 hr,
8 hr, 24 hr and annual averaging time to facilitate comparison to the applicable guidelines. The maximum

                                                                                                                           i
GO Transit
Rail Service Expansion from Oshawa to Bowmanville and New Rail Maintenance Facility in Whitby
Air Quality Assessment Report
concentration predicted by CAL3QHCR is considered conservative as the maximum emission factors and peak traffic
flow are used for all hours of the one-year modeling period when in reality the actual emission factors and traffic flow
are frequently less (not peak).
For the highest impacted receptor, the main findings of the air quality assessment are outlined below:
The local effects of the two future build scenarios are limited to receptors close to the GO stations. The modelled
impact and concentration levels greatly decrease with increasing distance from the GO stations and the main arterial
roads feeding into these stations. The modelling results comparing the current impact and the future build 2015
scenario are shown in Table E- 1. For all four stations, the future build scenario is seen to result in an decreased
predicted concentration at the highest impacted receptor for NOx, and VOCs. The modelling results for the two future
no-build and future build scenario are shown in Table E- 2 and Table E- 3. For all four stations, the future build
scenario is seen to result in an increased predicted concentration at the highest impacted receptor
Table E- 1 - Difference in Maximum Predicted Concentrations - Current vs. Future Build 2015
Percentage Percentage Percentage Percentage
Increase Increase Increase Increase
Averaging
around around around around
Pollutant Time
Thornton Ritson Courtice Martin
(Hours)
Station Station Station Station
(%) (%) (%) (%)
NOx 1 -3 -21 -23 -11
24 -2 -14 -15 -7
CO 1 5 -10 13 -1
24 3 -6 8 -1
SO2 24 1 1 5 1
PM2.5 24 -5 2 5 1
Acetaldehyde 24 0 -2 0 0
Acrolein 24 0 -4 -5 -5
Benzene 24 -2 -17 -4 -6
1,3-Butadiene 24 -6 -29 -6 -17
Formaldehyde 24 0 -2 0 -1
iiGO Transit
Rail Service Expansion from Oshawa to Bowmanville and New Rail Maintenance Facility in Whitby
Air Quality Assessment Report
Table E- 2 – Difference in Maximum Predicted Concentrations (2015) - Future Build vs. No Build
Percentage Percentage Percentage Percentage
Increase Increase Increase Increase
Averaging
around around around around
Pollutant Time
Thornton Ritson Courtice Martin
(Hours)
Station Station Station Station
(%) (%) (%) (%)
NOx 1 9 3 21 8
24 5 2 12 5
CO 1 19 6 37 12
24 10 4 21 6
SO2 24 1 0 5 1
PM2.5 24 0 0 7 2
Acetaldehyde 24 1 1 2 1
Acrolein 24 1 5 0 0
Benzene 24 15 5 17 12
1,3-Butadiene 24 25 5 33 12
Formaldehyde 24 1 1 2 1
Table E- 3 – Difference in Maximum Predicted Concentrations (2031) - Future Build vs. No Build
Percentage Percentage Percentage Percentage
Increase Increase Increase Increase
Averaging
around around around around
Pollutant Time
Thornton Ritson Courtice Martin
(Hours)
Station Station Station Station
(%) (%) (%) (%)
NOx 1 6 4 30 5
24 3 2 17 3
CO 1 24 10 49 7
24 13 6 30 4
SO2 24 1 1 7 1
PM2.5 24 1 1 11 5
Acetaldehyde 24 1 1 3 1
Acrolein 24 1 0 5 0
Benzene 24 15 9 26 5
1,3-Butadiene 24 18 15 36 9
Formaldehyde 24 1 1 2 0
Although there is a local increase in air pollutants from the specific GO Transit stations, the overall impact will
decrease due to commuters using GO Transit and reducing vehicle use on a regional level. The reduction in annual
emissions is shown in Table E- 4 along with mobile emission inventories for Ontario and Canada.
iiiGO Transit
Rail Service Expansion from Oshawa to Bowmanville and New Rail Maintenance Facility in Whitby
Air Quality Assessment Report
Table E- 4 -Regional Impacts, Change in Annual Mobile Emissions Due to Future Build
Project 2031 GO Train Project 2031 Vehicle Traffic Removed
Project
Contaminant Thornton Ritson Courtice Martin Thornton Ritson Courtice Martin (2031) Total Ontario 2007 Canada 2007
Emissions
Tonnes/year Tonnes/year Tonnes/year Tonnes/year Tonnes/year Tonnes/year Tonnes/year Tonnes/year kTonnes/year kTonnes/year kTonnes/year
Composite VOC* -6.80E-7 5.94E-8 6.08E-8 6.08E-8 -60.9 -61.7 -117.1 -56.9 -0.297 161 553.828
Composite CO 0.000 1.151 1.141 1.141 -2,062.2 -2,118.9 -2,843.8 -2,047.2 -9.069 2,067 6852.157
Composite NOx -4.321 0.899 0.881 0.881 -120.3 -123.9 -220.5 -148.4 -0.615 310.812 1209.463
PM2.5 -0.154 0.014 0.014 0.014 -7.8 -8.0 -10.0 -10.0 -0.036 16.464 64.885
*For road vehicles, ”Composite VOC” is as defined by the EPA code Mobile 6.2C. For trains,”Compsosite VOC” is defined as total Benzo(a)Pyrene.GO Transit
Rail Service Expansion from Oshawa to Bowmanville and New Rail Maintenance Facility in Whitby
Air Quality Assessment Report
Table of Contents
1. Introduction ............................................................................................................... 3
2. Approach and Methodology ..................................................................................... 3
2.1. Relevant Guidelines .................................................................................................... 4
2.2. Study Area .................................................................................................................. 4
2.3. Existing Ambient Air Quality ........................................................................................ 5
2.4. Modelling Scenarios.................................................................................................... 7
3. Data Collection and Analysis ................................................................................... 8
3.1. Maintenance Facility ................................................................................................... 8
3.2. Roadway Links, Traffic and Fleet Composition ........................................................... 8
3.2.1. Thornton Station ....................................................................................................................... 8
3.2.2. Ritson Station............................................................................................................................ 8
3.2.3. Courtice Station ........................................................................................................................ 9
3.2.4. Martin Station ............................................................................................................................ 9
3.3. Receptor Data............................................................................................................. 9
4. Emission Inventory ................................................................................................. 12
4.1. Vehicle Emission Factors from MOBILE 6.2.............................................................. 12
5. Dispersion Modelling .............................................................................................. 15
5.1. Tier 1 Modelling ........................................................................................................ 16
5.2. Tier 2 Modelling ........................................................................................................ 16
5.3. Unit Dispersion Modelling ......................................................................................... 17
6. Assessment of Results ........................................................................................... 18
6.1. Maximum Modelling Concentrations ......................................................................... 18
6.1.1. Thornton.................................................................................................................................. 18
6.1.2. Courtice................................................................................................................................... 25
6.1.3. Martin ...................................................................................................................................... 28
6.2. Train Impact – Ritson Station .................................................................................... 31
6.3. Regional Impacts ...................................................................................................... 34
7. Conclusions and Recommendations .................................................................... 36
8. References ............................................................................................................... 37
1GO Transit
Rail Service Expansion from Oshawa to Bowmanville and New Rail Maintenance Facility in Whitby
Air Quality Assessment Report
List of Figures
Figure 1: Non-dimensional Time of Day Traffic Flows.................................................................................................. 17
Figure 2 - Train Only Comparison Future Build 2015 - Unit Scalar .............................................................................. 32
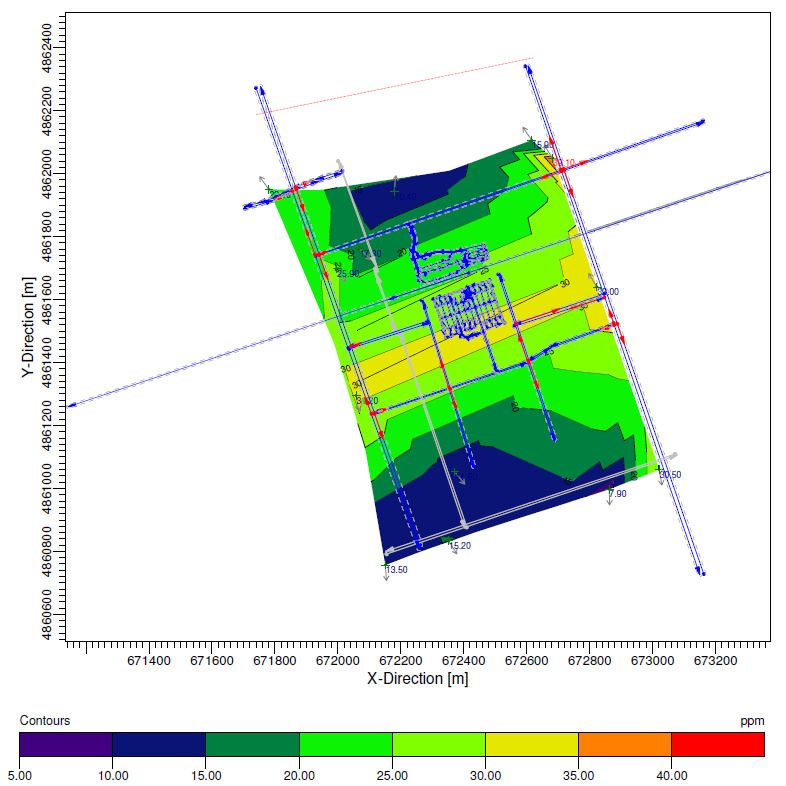
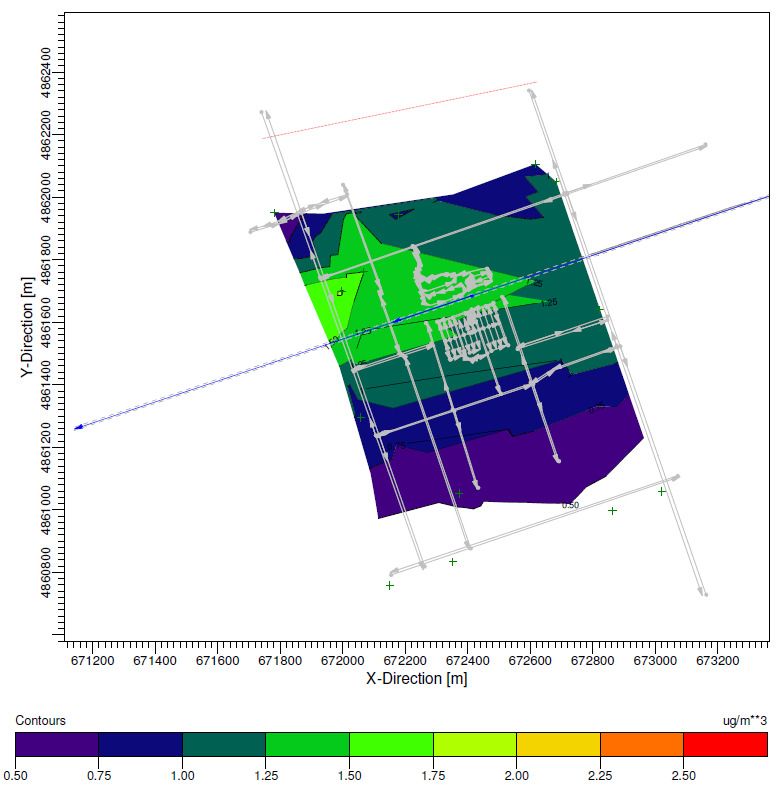
Figure 3 - Train Only Comparison Future Build 2015 - PM .......................................................................................... 33
List of Tables
Table 1 Summary of Applicable Guidelines and Standards ........................................................................................... 4
Table 2 - Rail Service Zone Definitions .......................................................................................................................... 5
Table 3 - Toronto West Monitoring Station Information .................................................................................................. 6
Table 4 - Hamilton Downtown Monitoring Station Information ....................................................................................... 6
Table 5 – Windsor West Monitoring Station Information ................................................................................................ 7
Table 6 – Ambient Air Quality 24 hr Concentrations Used in Air Dispersion Modelling .................................................. 7
Table 7 – Ritson Station Receptors.............................................................................................................................. 10
Table 8 – Martin Station Receptors .............................................................................................................................. 11
Table 9 – Courtice Station Receptors .......................................................................................................................... 11
Table 10– Thornton Station Receptors ........................................................................................................................ 12
Table 11 – MOBILE6.2 Input Data ............................................................................................................................... 13
Table 12 – MOBILE6.2 Input Data; Vehicle Speed ...................................................................................................... 14
Table 13 - Thornton - Maximum Predicted Concentrations -- Current.......................................................................... 19
Table 14 -Thornton - Maximum Predicted Concentrations 2015 - Future Build Scenario ............................................ 20
Table 15 - Ritson - Maximum Predicted Concentrations - Current Scenario ................................................................ 22
Table 16 - Ritson - Maximum Predicted Concentrations 2015 - Future Build Scenario................................................ 23
Table 17 – Maximum Predicted 1 Hour Concentrations – Current Scenario ................................................................ 24
Table 18 – Maximum Predicted 1 Hour Concentrations 2015 - Future build Scenario ................................................. 24
Table 19 - Courtice - Maximum Predicted Concentrations - Current Scenario ............................................................. 26
Table 20 - Courtice - Maximum Predicted Concentrations 2015 - Future Build Scenario ............................................ 27
Table 21 - Martin - Maximum Predicted Concentrations - Current Scenario ................................................................ 29
Table 22 - Martin - Maximum Predicted Concentrations 2015 - Future Build Scenario ................................................ 30
Table 23 – Regional Impacts, Change in Annual Mobile Emissions Due to Future Build............................................. 35
Appendices
Appendix A. Air Quality Monitoring Data
Appendix B. Sensitive Receptors
Appendix C. Emission Factors and MOBILE6.2 Input/Output
Appendix D. CAL3QHCR Input/Output
Appendix E. Future Build 2031 Results
Appendix F. Future No Build 2015 Results
Appendix G. Future No Build 2031 Results
Appendix H. Sample Concentration Contour Plots
Appendix I. Draft GO Transit Traffic Impact Studies
Appendix J. Time of Day Traffic Data
Appendix K. December 4, 2009 Submission
2GO Transit
Rail Service Expansion from Oshawa to Bowmanville and New Rail Maintenance Facility in Whitby
Air Quality Assessment Report
1. Introduction
AECOM was retained by GO Transit to prepare an Air Impact Assessment for the proposed GO Transit rail
expansion of the Lakeshore East operations from Whitby to Clarington, Ontario to accommodate increased ridership
demand along this corridor. The proposed project would provide new GO Transit commuter rail service between
Oshawa and Bowmanville. It would require the construction of four (4) new GO Transit rail stations, one (1) new
layover facility and one (1) new maintenance facility along the existing Canadian National Railway (CNR) and
Canadian Pacific Railway (CPR) rail corridors.
The purpose of the Air Impact Assessment is to predict the potential air quality impacts as they relate to the proposed
undertaking within the study area. The objective of the report is to provide a comparison of the emissions of air quality
contaminants estimated to result from the proposed expansion to an established future baseline, and evaluate how
the proposed expansion may potentially affect air quality in the study area.
2. Approach and Methodology
The air quality study consisted of an assessment to address the air quality impacts of the proposed GO Transit rail
expansion project in Durham Region. The impacts studied are broadly defined in terms of local and regional air
quality impacts.
Local air quality impacts were assessed by estimating contaminant concentrations at representative sensitive
receptors within the study area and comparing them to applicable regulatory limits. Within the study area, a
comparison was completed between background contaminant concentration levels and anticipated contaminant
concentration levels resulting from the project, including future traffic volumes. Ambient concentrations and current
traffic volumes were used to represent the current base year. The scenarios analyzed include the future build and
future no-build for the years 2015 and 2031.
Regional air quality impacts were assessed by estimating and comparing the differences in air pollutant emissions
from the total transportation mix for the year 2015 and 2031 based on the future no-build and future-build scenarios.
An emission inventory approach was thus used to determine the regional air quality impacts.
The study assessed impacts from transportation emissions such as nitrogen oxides (NOx), carbon monoxide (CO),
sulphur dioxide (SO2) and particulate matter (PM). Select VOC emissions were also assessed as directed by the
MOE. They include acetaldehyde, acrolein, benzene, 1,3-butadiene, and formaldehyde.
Ambient data for TSP and PM10 are not readily available. Background values for TSP and PM10 were calculated using
MOE approved ratios (PM2.5 / PM10 = 0.54 and PM2.5 / TSP = 0.3). In addition, all station models investigating PM
assumed that TSP and PM10 emissions are that of PM2.5. This is considered to be a conservative estimate for
dispersed TSP levels, since it is expected that the larger particles in TSP should settle quicker than the smaller
fraction of PM10 or PM2.5 and the vast majority of combustion emissions are PM2.5.
Emission and dispersion models included MOBILE6.2 and US EPA CAL3QHCR. Further model input details are
described in the corresponding section.
3GO Transit
Rail Service Expansion from Oshawa to Bowmanville and New Rail Maintenance Facility in Whitby
Air Quality Assessment Report
2.1. Relevant Guidelines
The maximum predicted concentrations at the sensitive receptors in this study were compared with the corresponding
standards, criteria, and guidelines:
• Ontario Regulation 419/05 Air Pollution – Local Air Quality Regulation, Schedule 3;
• MOE Ambient Air Quality Criteria; and
• Proposed Canada Wide Standards (CCME).
A summary of standards proposed for the Air Quality Assessment is shown below in Table 1. Where multiple
sources of standards are available, the most stringent values are shown. The MOE interim 24-hour reference level
for PM10 was added for comparison.
Table 1 Summary of Applicable Guidelines and Standards
3
Contaminant Source Averaging Time Value (µg/m )
NOx Reg. 419/05 Schedule 3 1 hr 400
Reg. 419/05 Schedule 3 24 hr 200
CO Reg. 419/05 Schedule 3 1 hr 36,200
Reg. 419/05 Schedule 3 8 hr 15,700
SO2 Reg. 419/05 Schedule 3 1 690
Reg. 419/05 Schedule 3 24 275
PM - TSP Reg. 419/05 Schedule 3 24 hr 120
PM10 MOE Interim Reference Level 24 hr 50
PM2.5 Canada Wide Standard (CCME) 24 hr 30
Acetaldehyde Reg. 419/05 Schedule 3 24 hr 500
Acrolein Reg. 419/05 Schedule 3 24 hr 0.4
Benzene N/A N/A N/A
1,3-Butadiene N/A N/A N/A
Formaldehyde Reg. 419/05 Schedule 3 24 hr 65
AAQCs are acceptable effects-based levels in ambient air. Limits are set based on the “limiting effect” and are the
lowest concentrations at which an adverse effect may be experienced. Effects considered may be health, odour,
vegetation, soiling, visibility, corrosion or others and limits have variable averaging times appropriate for the effect
that they are intended to protect against. AAQCs are used for assessing general air quality and the potential for
causing an adverse effect. They are set at levels below which adverse health and/or environmental effects are not
expected. If a contaminant has more than one AAQC, all must be used for assessment purposes as each represents
a different type of effect linked to a particular averaging period.
The Canadian Council of Ministers of the Environment (CCME) has developed Canada-wide Standards for a variety
of contaminants. These standards are developed jointly by various provincial jurisdictions based on scientific and
risk-based approach. Standards are presented to the Ministers along with a timetable for implementation and
monitoring and public reporting programs. Ministers are responsible for implementing the standards within their own
jurisdictions and promote consistency across the country. Applicable standards include the Canada Wide Standard
for PM2.5 (particles smaller than 2.5 µm in diameter), which was established for the year 2010. This standard is
th
based on the 98 percentile ambient measurement (24-hour), annually averaged over three years.
2.2. Study Area
The proposed expansion route generally follows existing east-to-west CNR and CPR rail lines. It is bounded by Brock
Street in Whitby at the western limit and Bragg Road in Bowmanville at the eastern limit. Eastbound GO trains are to
operate within the existing CNR rail corridor until Thickson Road South. Between Thickson Road South and Thornton
4GO Transit
Rail Service Expansion from Oshawa to Bowmanville and New Rail Maintenance Facility in Whitby
Air Quality Assessment Report
Road South, a new rail bridge crossing will be erected over Highway 401. The GO rail line would then merge onto
and continue east along the existing CPR rail corridor until terminating at the proposed Bowmanville GO station at
Martin Road. Westbound GO trains will follow the same route but in the opposite direction.
The spatial extent of the study area was selected to encompass potential project air quality impacts. It includes the
layer of air near the earth’s surface, known as the troposphere, which extends from the surface to approximately 10
km in altitude. The study area follows the proposed GO Rail route and infrastructure. It is bounded by 500m in each
direction north and south of the rail corridor in order to encompass Highway 401 and capture emission, accumulation
and dispersion of air contaminants.
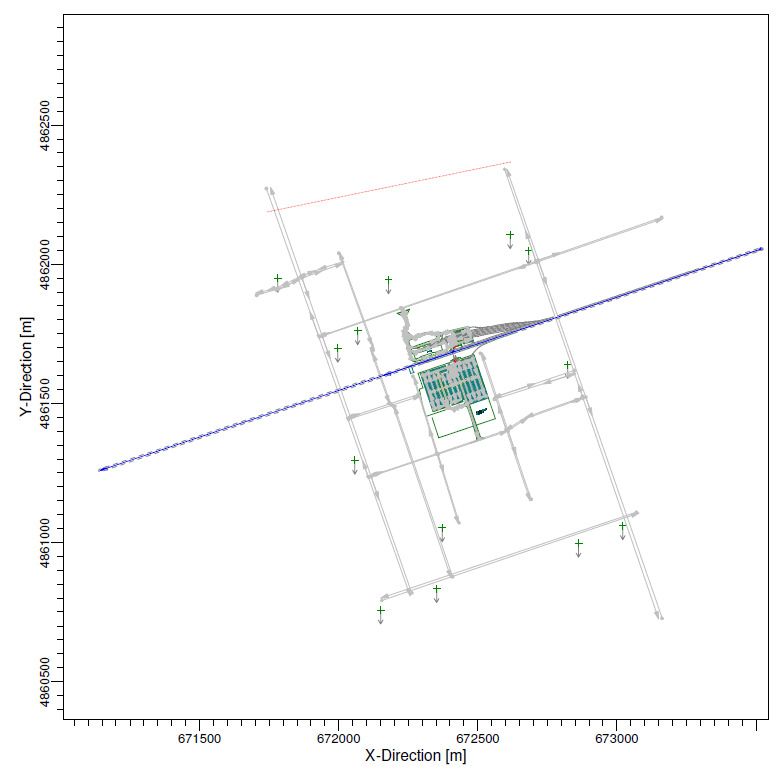
The study area limits and the proposed GO Rail route and infrastructure locations are depicted in the Project
Overview Plan in Appendix A. Proposed track layouts are also included in Appendix A.
To facilitate the analysis, the study area was divided into three (3) zones. Each zone represents a distinct blend of
CPR, CNR, CNR passenger (VIA) and GO Transit rail service within each time frame. The zones are described in
Table 2.
Table 2 - Rail Service Zone Definitions
Zone Stations Description of Zone
Thornton Rd (Oshawa West) East of Brock Street and West of the proposed Hwy
Zone 1
401 crossing
Ritson Rd. (Oshawa Central) East of proposed Hwy 401 crossing and West of
Zone 2
proposed Central Oshawa station
Courtice Rd (Clarington) East of the proposed Central Oshawa station and
Zone 3
Martin Rd (Bowmanville) West of Bragg Road
2.3. Existing Ambient Air Quality
A general estimate of the baseline ambient air quality was made using publicly available historical air quality data
from ambient air quality monitoring stations within Ontario. Data utilized was the latest publicly available at the time
of the study commencement. It was assumed that the historic ambient air quality will be the same for both the future
build and future no-build scenarios in 2015 and 2031. This is a conservative estimate as there are numerous federal,
provincial, and municipal initiatives which are currently being implemented to reduce the levels of ambient air
pollutants. For vehicle emissions in particular, it is anticipated that due to more stringent vehicle emission limits the
1
on road emissions will decrease despite increasing traffic. In addition, ambient monitoring data typically shows
decreasing concentrations for PM2.5, NOx, SO2 and CO over the past several years.
Hourly and annual ambient concentrations of air quality pollutants (PM2.5, NOx, SO2 and CO) were obtained from the
Toronto West monitoring station (Table 3). The Toronto West station has shown considerably higher ambient results
due to its proximity to high density traffic corridors.
Ambient monitoring data for air quality pollutants was extracted as follows for (PM2.5, NOx, SO2 and CO):
th
• 1 and 24 hour ambient concentrations for the contaminant were obtained from the 90 percentile of hourly
measurements from the Toronto West station (average value).
1
MOE, 2008, “Air Quality in Ontario, 2007 Report”, Monitoring & Reporting Section, Environmental Monitoring and Reporting Branch MOE
Document: 6930e, http://www.ene.gov.on.ca/publications/6930e.pdf
5GO Transit
Rail Service Expansion from Oshawa to Bowmanville and New Rail Maintenance Facility in Whitby
Air Quality Assessment Report
• The annual ambient concentrations for the contaminant consisted of the maximum annual average of the
hourly measurements from the Toronto West station
• As TSP and PM10 are not monitored, MOE approved ratios (PM2.5 / PM10 = 0.54 and PM2.5 / TSP = 0.3) were
used to estimate ambient concentrations.
Table 3 - Toronto West Monitoring Station Information
Toronto West Information
Station Name: Toronto West
NAPS Number N/A
Address: 125 Resources Rd.
Latitude: 43.709444
Longitude: -79.5435
Station Type: Urban
Height of Air Intake: 8m
Elevation ASL: 141 m
Pollutants Measured: O3, PM2.5, NO2, CO, SO2
Most of the data was extracted from the annual MOE publication “Air Quality in Ontario”
(http://www.airqualityontario.com/history/). Data from 2003 – 2007 was used.
Ambient air monitoring for VOCs is less common and the available monitoring stations were not close to the study
area as compared to stations monitoring NOx, CO, SO2 and PM. The MOE’s Hamilton Downtown monitoring
station(Table 4) was chosen for ambient background Benzene and 1,3-Butadiene concentrations. Data in the form of
24 hour averages was provided to AECOM for 45 days of 2008.
Table 4 - Hamilton Downtown Monitoring Station Information
Hamilton Downtown Information
Station Name: Hamilton Downtown
NAPS Number: 60512
Address: Elgin St./Kelly St.
Latitude: 43.257778
Longitude: -79.861667
Station Type: Urban
Height of Air Intake: 4m
Elevation ASL: 90 m
Pollutants Measured: Benzene, 1,3-Butadiene
Additional VOC data was obtained from the Windsor West monitoring station (Table 5). Data for acetaldehyde,
acrolein and formaldehyde was provided as an annual average for the years 2000-2004. For each contaminant, the
th
average of 90 percentile values was used as the 24 hr background contaminant value. The highest annual average
was selected to be the annual background contaminant value.
6GO Transit
Rail Service Expansion from Oshawa to Bowmanville and New Rail Maintenance Facility in Whitby
Air Quality Assessment Report
Table 5 – Windsor West Monitoring Station Information
Windsor West Information
Station Name: Windsor West
NAPS Number: 60211
Address: College Ave./South St
Latitude: 42.292889
Longitude: --83.073139
Station Type: Urban
Height of Air Intake: 4m
Elevation ASL: 180 m
Pollutants Measured: Acetaldehyde, Acrolein, Formaldehyde
The monitoring stations at which these values were obtained are located in areas that are more urban and industrial
than the location of many of the proposed GO stations, and hence may have higher contaminant concentrations than
the area of interest. Furthermore, the background contaminant concentration levels already include emissions
resulting from current traffic levels. The modelled point of impingement (POI) adds local traffic values to this
background contaminant concentration and this double accounting of traffic emissions results in a highly conservative
analysis.
Table 6 – Ambient Air Quality 24 hr Concentrations Used in Air Dispersion Modelling
th
Contaminant 90 Percentile Concentration
3
µg/m
NOx 162
CO 673
SO2 13.8
PM2.5 18.6
PM10 34.44
PMTSP 62
Acetaldehyde 2.62
Acrolein 0.19
Benzene 1.88
1,3-Butadiene 0.09
Formaldehyde 4.45
Table 6 shows the ambient concentration values used as the background concentration. The ambient concentration
for NOx (24 hour), acrolein, and PM2.5, represent 50% or more of the contribution to the relevant standard or
guideline.
2.4. Modelling Scenarios
For each station five (5) scenarios were investigated:
• Current (2009)
• Future No Build (2015)
• Future No Build (2031)
• Future Build (2015)
• Future Build (2031)
7GO Transit
Rail Service Expansion from Oshawa to Bowmanville and New Rail Maintenance Facility in Whitby
Air Quality Assessment Report
3. Data Collection and Analysis
3.1. Maintenance Facility
For the purposes of this study, it has been determined that the air quality impact of the proposed maintenance facility
will be negligible in comparison to the four proposed stations. There are a few reasons for coming to this conclusion
with the main one being the planned location of the facility. The facility is to be built in a highly industrialized area
with the nearest sensitive receptor being approximately a kilometre away; a distance far greater than the 300m to
500m boundary within which the impacts on receptors are analyzed that is typically employed for this type of study.
In comparison, each of the four train stations modeled have receptors within 10m to 50m of arterial roadways which
are the main sources of emissions. Given that air impacts from an emission source decrease greatly with distance
from the source, air quality at any sensitive receptor will not be greatly impacted by this facility.
In addition to the much greater distance to any sensitive receptor, another factor that will cause emissions from this
facility to have a far smaller effect on air quality than the proposed stations is the actual level of emissions. As has
been noted previously, the main source of emissions in this project is the increase in traffic on the arterial roads
surrounding the stations rather than the trains themselves. The amount of traffic expected to travel to this facility is
significantly less than the thousands of commuters travelling to the stations each day.
3.2. Roadway Links, Traffic and Fleet Composition
3.2.1. Thornton Station
For the study, the road network consisted of all of the on-property roads and the adjacent main arterial roads onto
which the proposed station traffic exits.
Traffic data for the current, future build and future no build scenario was available from the draft “GO Station Traffic
Impact Study Proposed Oshawa West GO station", prepared in 2009 by AECOM (See Appendix I). No traffic
prediction data is available for the year 2031. Instead, traffic predictions from the study timeframe of 2015 were
extrapolated using a conservative GDP growth estimate of 2.5 to quantify the traffic volumes for both on-property and
arterial traffic in both future scenarios for the year 2031. The default MOBILE6.2 fleet composition was used for all
scenarios.
3.2.2. Ritson Station
For the study, the road network consisted of all of the on-property roads and the adjacent main arterial roads onto
which the proposed station traffic exits.
Traffic data for the current, future build and future no build scenario was available from the draft “GO Station Traffic
Impact Study Proposed Central Oshawa GO Station”, prepared in 2009 by AECOM (See Appendix I). No traffic
prediction data is available for the year 2031. Instead, traffic predictions from the study timeframe of 2015 were
extrapolated using a conservative GDP growth estimate of 2.5 to quantify the traffic volumes for both on-property and
arterial traffic in both future scenarios for the year 2031. .The default MOBILE6.2 fleet composition was used for all
scenarios.
8GO Transit
Rail Service Expansion from Oshawa to Bowmanville and New Rail Maintenance Facility in Whitby
Air Quality Assessment Report
3.2.3. Courtice Station
For the study, the road network consisted of all of the on-property roads and the adjacent main arterial roads onto
which the proposed station traffic exits.
Traffic data for the current, future build and future no build scenario was available from the draft “GO Station Traffic
Impact Study Proposed Courtice GO Station", prepared in 2009 by AECOM (See Appendix I). No traffic prediction
data is available for the year 2031. Instead, traffic predictions from the above noted study for the study timeframe of
2015 were extrapolated using a conservative GDP growth estimate of 2.5 to quantify the traffic volumes for both on-
property and arterial traffic in both future scenarios for the year 2031. The default MOBILE6.2 fleet composition was
used for all scenarios.
3.2.4. Martin Station
For the study, the road network consisted of all of the on-property roads and the adjacent main arterial roads onto
which the proposed station traffic exits.
Traffic data for the current, future build and future no build scenario was available from the draft “GO Station Traffic
Impact Study Proposed Bowmanville GO Station", prepared in 2009 by AECOM (See Appendix I). No traffic
prediction data is available for the year 2031. Instead, traffic predictions from the above noted study for the study
timeframe of 2015 were extrapolated using a conservative GDP growth estimate of 2.5 to quantify the traffic volumes
for both on-property and arterial traffic in both future scenarios for the year 2031. The default MOBILE6.2 fleet
composition was used for all scenarios.
3.3. Receptor Data
Receptors considered in the air quality assessment include potentially sensitive receptors such as residences,
education facilities, healthcare facilities, day care facilities, places of worship and community centers. Based on the
expected emission release characteristics of the sources, the closest sensitive receptors surrounding the sources (in
all directions) were identified and it was assumed that receptors further away will have lower impacts.
Data on the identification and location of the sensitive receptors, described below, was obtained from the following
sources:
• Region of Durham;
• Listings of education, healthcare and day care facilities, places of worship
Details on the sensitive receptors were confirmed by field observations by AECOM personnel. Additional
receptors were also identified during field observations. Locations of the receptors are provided
included in Appendix B.
Table 7 through
Table 10 below lists all the sensitive receptors considered for modeling. The receptor height for all sensitive receptors
was assumed to be 1.8 meters, which is considered the typical breathing height. The CAL3QHCR software uses an
internal numbering system to present results. This number will be included in brackets for presented results. For
example, “The Children’s Place” will be denoted as “4 (4)” in the results table with the internal CAL3QHCR receptor
ID in the brackets.
9GO Transit
Rail Service Expansion from Oshawa to Bowmanville and New Rail Maintenance Facility in Whitby
Air Quality Assessment Report
Table 7 – Ritson Station Receptors
Number Name Description UTM Coordinate UTM Coordinate
X (m) Y (m)
Village Union Public
1 (1) School School 671781 4861950
New Ark -
Opportunity
2 (2) Learning Center School 672151 4860757
3 (3) Ritson Public School School 672616 4862106
4 (4) The Children's Place Daycare 672683 4862049
Holy Cross Roman
5 (5) Catholic Church Church 671997 4861698
New Life Seventh
day Adventist
6 (6) Church Church 672068 4861761
Church of the Good
7 (7) Shepherd Church 672179 4861944
St John The Baptist
Ukrainian Orthodox
8 (8) Church Church 672352 4860834
Ukrainian Catholic
9 (9) Church of St George Church 672372 4861053
Annunciation of the
10 (10) Virgin Mary Church 673021 4861060
Hope Spiritualist
11 (11) Church Church 672862 4860997
St James
Presbyterian
12 (12) Church Church 672073 4861299
Riston Rd Baptist
13 (13) Church Church 672833 4861631
10GO Transit
Rail Service Expansion from Oshawa to Bowmanville and New Rail Maintenance Facility in Whitby
Air Quality Assessment Report
Table 8 – Martin Station Receptors
Number Name Description UTM Coordinate UTM Coordinate
X (m) Y (m)
Church of Jesus
Christ and Latter
14 (1) Day Saints Church 684324 4864431
Kawartha Child
15 (2) Care Services Day Care 684151 4863621
Dr. Ross Tiley Public
16 (3) School School 684622 4863188
Saint Steven's
17 (4) Elementary School School 685365 4863567
18 Leep Daycare Day Care 684592 4863900
Table 9 – Courtice Station Receptors
Number Name Description UTM Coordinate UTM Coordinate
X (m) Y (m)
Kawartha Child
15 (1) Care Services Day Care 684151 4863621
Grandview
Children's
School/Campbell Rehabilitation
43 (2) Children's School Centre/School 676053 4862181
Courtice Flea
45 (3) Market Market 678520 4862732
Hope Fellowship
46 (4) Church Church 678479 4862691
47 (5) Residence 679230 4862166
48 (6) Residence 679377 4861700
49 (7) Residence 679577 4861139
50 (8) Residence 679071 4860948
51 (9) Residence 678598 4861392
52 (10) Residence 678325 4862166
11GO Transit
Rail Service Expansion from Oshawa to Bowmanville and New Rail Maintenance Facility in Whitby
Air Quality Assessment Report
Table 10– Thornton Station Receptors
Number Name Description UTM Coordinate UTM Coordinate
X (m) Y (m)
Residence 669760 4861088
53 (1)
Residence 669459 4860996
54 (2)
Residence 669395 4861188
55 (3)
Residence 670470 4861025
56 (4)
Residence 669201 4860933
57 (5)
Residence 669130 4860859
58 (6)
Residence 668760 4860572
59 (7)
Residence 670610 4860607
60 (8)
4. Emission Inventory
The air quality assessment included the development of emission factors and quantification of emission rates related
to train and vehicle emissions (exhaust, evaporative losses, tire wear and brake wear). Emission factors and
emission rates were developed for various scenarios as summarized in the following section.
4.1. Vehicle Emission Factors from MOBILE 6.2
Mobile vehicle emissions are categorized as:
1. Exhaust emissions that are the products of fuel combustion,
2. Evaporative emissions and
3. Particulate emissions associated with brake wear and tire wear.
Evaporative emissions are divided into five emission sub-categories (hot soak, diurnal, running, resting and refueling
losses) that describe the different phases of a vehicle operating cycle that include a standing hot or cold engine, a
running engine, fuel tank vapor losses due to the diurnal air temperature cycle and vapor displacement losses due to
refueling.
The USEPA has developed an emission factor model (MOBILE) for estimating both exhaust and evaporative
emissions from a defined fleet of vehicles operating with a defined driving cycle. The most recent available version of
the model is MOBILE6.2. The default files provided with MOBILE6.2 are typical of the vehicle fleet, vehicle operating
patterns and emission regulations in the United States. The MOBILE6.2 model allows the user to override the default
data with site specific data in order to estimate site specific emissions; this capability has been used in the air quality
assessment to estimate mobile source emissions.
This model was used to generate composite emission factors (i.e., grams of pollutant emitted per vehicle mile
traveled, g/VmT) for CO, NOx, PM2.5, and VOC’s. Emission factors were developed for the months of January and
July for the future build and future no-build scenario.
12GO Transit
Rail Service Expansion from Oshawa to Bowmanville and New Rail Maintenance Facility in Whitby
Air Quality Assessment Report
The input data required to run MOBILE6.2is presented in Table 11 and Table 12 along with a summary of data
sources. Details on fleet composition are presented in Section 3.1. Where default data included in MOBILE6.2are
deemed appropriate for the study area, these default data have been used.
Table 11 – MOBILE6.2 Input Data
Parameter Input Reference
External Conditions
Year of Evaluation 2015/2031
Month of Evaluation January/July (1)
Temperature ˚C -13/25 Environment Canada weather normal’s
Humidity 65/83 % Environment Canada weather normal’s
Altitude Low (1)
Fuel Options
Reid Vapour Pressure (RVP) in
8.9 psi (summer)/ 14.7 psi (winter) (2)
PSI
Diesel Sulphur Content 15 ppm (2021) (3)
Gasoline Sulphur Content 25 ppm (2021) (2)
Air Toxics
Gasoline Aromatics (%) 28.4 (2)
Gasoline Olefin (%) 10.3 (2)
Gasoline Benzene (%) 0.8 (2
Vapour Pressure of gasoline at
47.3 (summer) / 53.7 (winter) (2)
200 F (%)
Vapour Pressure of gasoline at
83.3 (2)
300 F (%)
Oxygenate Volume % of Ethanol (10% volume, 20% market share in
(4)
or Ethyl Alcohol (Ethanol) 2021)
Vehicle Activity
Fractions of Vehicle Miles
Appendix C
Travelled (VMT)
VMT by facility, hour and speed default Default file for MOBILE 6.2
Default for all Local Roads
Starts per day
0 for all Arterial Roads
Distribution of vehicle starts
default Default file for MOBILE 6.2
during day
Soak Distribution default Default file for MOBILE 6.2
Hot Soak activity default Default file for MOBILE 6.2
Diurnal Soak activity default Default file for MOBILE 6.2
Weekday trip length distribution default Default file for MOBILE 6.2
Weekend trip length distribution default Default file for MOBILE 6.2
Weekend use vehicle activity default Default file for MOBILE 6.2
Vehicle Fleet Characteristics
Distribution of Vehicle
default Default file for MOBILE 6.2
Registrations
13GO Transit
Rail Service Expansion from Oshawa to Bowmanville and New Rail Maintenance Facility in Whitby
Air Quality Assessment Report
Parameter Input Reference
Diesel Fractions default Default file for MOBILE 6.2
Annual Mileage accumulation Ontario - Created by Environment
Default file for MOBILE 6.2
rates Canada
Vehicle Miles Travelled (VMT)
default Default file for MOBILE 6.2
fraction
Natural gas vehicles (NGV)
default Default file for MOBILE 6.2
fraction
Alternate emission factor for
default Default file for MOBILE 6.2
NGVs
(1) US EPA. Office of Transportation and Air Quality. "Technical Guidance on the use of MOBILE6.2 for emission inventory preparation.
EPA420-R-04-013, August
(2) Emission of air toxics from on-highway sources in Canada: Estimated impacts of various vehicle and fuel control strategies.
Environment Canada technical Report M6C-02-E, Prepared by SENES Consultants Limited and Air Improvement resource Inc.
(3) MOE Drive Clean Program
(4) http://www.ec.gc.ca/cleanair-airpur/CAOL/transport/publications/ethgas/ethgas3.htm
Table 12 – MOBILE6.2 Input Data; Vehicle Speed
Road Class Free Flow Idle
Speed Speed
[km/h] [km/h]
Thornton
Thornton Rd Local 60 4
Champlain Ave/Consumers Rd, Gibb St, Kendalwood Rd Local 50 4
Access Road-Bus Local 32 4
Access Road-Parking Traffic Local 32 4
Ritson Rd
Olive Ave, Gibb St, Albany Rd, Front St, Beatty Ave, McNaughton Local 50 4
Ave, Howard Ave
Simcoe Ave, Ritson Rd Arterial 50 4
Access Road-Bus Local 32 4
Access Road-Parking Traffic Local 32 4
Courtice
Baseline Rd Local 70 4
Courtice Rd Arterial 80 4
Bloor St, Trulls Rd Local 60 4
Access Road-Bus Local 32 4
Access Road-Parking Traffic Local 32 4
Martin Rd
Clarington Rd, Prince William Bvld, Pethick St, Aspen Springs Dr Local 60 4
Martin Rd, Hwy2 (King St) Arterial 60 4
Access Road-Bus Local 32 4
Access Road-Parking Traffic Local 32 4
A summary of emission factors developed along with the MOBILE6.2 input/output files are provided in Appendix C.
14GO Transit
Rail Service Expansion from Oshawa to Bowmanville and New Rail Maintenance Facility in Whitby
Air Quality Assessment Report
Train volumes and emission factors were calculated in a previous submission “GO Transit Rail Service Expansion
from Oshawa to Bowmanville and New Rail Maintenance Facility in Whitby Environmental Air Quality Assessment:
December 4, 2009” This report has been included in Appendix K.
5. Dispersion Modelling
The CAL3QHCR air dispersion model is a recognized tool developed by the USEPA for assessing emissions from
linear sources such as roadways. The main inputs to the model are described in detail in Appendix D and
summarized below:
• base map of road network
• the location of receptors (Section 3.3);
• the location and length of each road/train segment;
• vehicle/train exhaust emission factors (i.e., g/VmT) for the road segments near both stations and each
emission scenario as described in Section 4.1);
• the overall peak hourly traffic flow in each area for all hours of the day (i.e., the overall peak flow is assumed
for all hours of the day);
• traffic signal timing used to calculate idle times and length of traffic queuing; and
• One year (2000) meteorological data set
A base map of the road network in a CAD format was provided by GO Transit. Receptor coordinates were imported
into CALRoads (graphical interface for CAL3QHCR model). The base map was used to develop the location and
length of road and train links and segments within CALRoads. Arterial roads were modelled for approximately 500 m
beyond the intersection of interest. The definition of the train and roadway links was done on a case by case basis
taking into account the on property station configuration and the impacted arterial roads directly adjacent to the
proposed GO Transit stations. Commuter parking impacts were assessed where facilities are proposed. “Freeflow”
links were used to define all roads and parking lots. Supplementary “queue links” were used to define intersections.
Two “freeflow” links were used to define train travel. A ”freeflow” link was utilized to represent composite train (i.e.
traffic weighted GO, VIA, CN, CP) traffic flow through the station of interest. A supplementary “freeflow” link was
utilized to account for idling GO train emissions at the station. It was assumed that VIA, CN, CP trains would not stop
at the stations other than for emergency purposes.
Receptors considered in the air quality assessment include potentially sensitive receptors such as
education facilities, healthcare facilities, day care facilities, places of worship and community
sensitive receptors were confirmed by field observations by AECOM personnel. Additional
also identified during field observations. Locations of the receptors are provided in base maps
B.
Table 7 in Section 3.3 lists all the sensitive receptors considered for modeling.
The developed emission factors were input in to the CAL3QHCR dispersion model along with established peak traffic
flow data for the future build and future no-build scenarios. Traffic signal data from various reports were used to
calculate traffic queuing and the queue specific links in CALRoads.
One (1) year of regional meteorological data was utilized in the analysis. MOE provided upper air data was obtained
from the Buffalo station, while surface data was obtained from Toronto Pearson International airport. The
meteorological data spans the year 2000 and includes a sufficient timeframe to capture a wide degree of varying
meteorological conditions.
15GO Transit
Rail Service Expansion from Oshawa to Bowmanville and New Rail Maintenance Facility in Whitby
Air Quality Assessment Report
The CAL3QHCR model was run using urban settings as outlined in the US EPA document Guideline on Air Quality
Models (40 CFR Part 51, Appendix W) because when “the land use within a 3 km radius around the facility sources is
examined… more than 50% of the area is accounted for by land use categories ranging from multi-family dwelling to
commercial and industrial use.” Lower coefficients resulting from the urban settings produce higher concentrations
and were chosen to keep the model conservative.
The gaseous contaminants such as CO, SO2, NOx and VOCs were modelled using the CO option (for gaseous
contaminants), while the particulate contaminants used the PM option. The settling velocity of CO and gases is
typically 0, as outlined by the CAL3QHC manual. The settling velocity of PM was 2.75 cm/s.
The model was run according to MOE requirements to produce contour plots of ground level concentrations of NOx,
CO and PM encompassing the nearest sensitive receptors to the GO Transit stations. A unit dispersion method was
used for VOCs (See Section 5.3). Since the MOE standards are based on different averaging times for each of the
2
contaminants, the results were converted following the ADMGO (see Equation 5.0). CO POI values were based on
a 1hr averaging time and scaling factors were used to obtain 24hr and annual values to facilitate comparison to the
applicable guidelines. PM POI values were based on a 24 hr averaging time and scaling factors were used to obtain
1hr and annual values to facilitate comparison to the applicable guidelines.
n
t
C 24hr = Ct × 1
to
0.28
60 min
= C 60 min ×
min
24hr × 60
hr
= C 60 min × 0.41 Eqn 5.0
5.1. Tier 1 Modelling
The maximum concentration predicted by CAL3QHCR is considered very conservative as the maximum emission
factors and peak traffic flow are used for all hours of the one-year modeling period (Tier 1 CAL3QHCR modelling)
when in reality the actual emission factors and traffic flow are less at non-peak times. The maximum impacted
receptor was used in assessing all contaminants for this project.
5.2. Tier 2 Modelling
In order to assess how the conservative POI values would be resulting from Tier 1 modelling, Tier 2 modelling
incorporating time of day traffic flows was performed using CAL3QHCR for a single station (Ritson Rd). Where
possible, measured time of day traffic flows provided by the Region of Durham were utilized (Appendix J). In cases
where such data was not available, a non-dimensional profile was used based on measured traffic flows. This profile
is illustrated in Figure 1. This profile illustrates that a significant portion of the day features traffic flows less than 50%
of the peak.
2
“Air Dispersion Modelling Guideline for Ontario v2.0, March 2009”
16You can also read