Prevalence of at-risk gambling has decreased - Julkari
←
→
Page content transcription
If your browser does not render page correctly, please read the page content below
STATISTICAL REPORT 9/2020
    21 April 2020

    Gambling and problem gambling –
    Finnish Gambling 2019
    Prevalence of at-risk gambling has decreased

                                        The Finnish Gambling population study examines gambling and problem gambling
                                        among Finnish people aged from 15 to 74 in 2007, 2011, 2015 and 2019. The study was
MAIN FINDINGS                           conducted by the Finnish Institute for Health and Welfare, and commissioned and
•    Past-year prevalence of gambling   financed by the Ministry of Social Affairs and Health (section 52 of the Lotteries Act). The
     at least one game type among the   data collection for the study was carried out by Statistics Finland as computer-assisted
     respondents was 78.4%.             telephone interviews (CATI). In 2019, 3,994 Finnish people took part in the study (response
                                        rate 52%).
•    Past-year prevalence of online
     gambling was 36.3%.                Past-year prevalence of gambling at least one game type among the respondents was
                                        78%. While this rate remained unchanged between 2015 and 2019, there were changes in
•    2.5% of those who gambled
                                        gambling frequency. The proportion of respondents who gambled less often than once a
     accounted for one half (50%) of
                                        month increased, whereas the proportion of those gambling more often than this
     the total gambling expenditure.
                                        decreased. In 2019, 29% of the respondents gambled at least once a week.
•    Past-year prevalence of problem
                                        The term problem gambling is used to refer both to problematic gambling and
     gambling was 3.0% and at-risk
                                        pathological gambling. The past-year prevalence of problem gambling among the
     gambling 10.7%. The prevalence
                                        respondents was three per cent (approx. 112,000 people). In addition, approximately one
     of probable pathological
                                        in ten were at-risk level gamblers. At-risk gambling refers to gambling which causes
     gambling among the respondents
                                        individual harms and often precedes the development of problem gambling. There was no
     was 1.4%.
                                        change in the prevalence of problem gambling from 2015 to 2019. The prevalence of at-
•    Concerned significant others of    risk gambling decreased, however.
     problem gamblers accounted for
                                        Weekly lottery games and/or Jokeri (64%), scratch cards (47%) and slot machine games
     21.1% of the respondents.
                                        outside the casino (31%) were the most popular game types offered by Veikkaus Ltd. More
                                        than one out of three respondents had gambled online in the past 12 months, which was
                                        13 percentage points more than in 2015. 2.5% of gamblers accounted for one half of the
                                        total gambling expenditure. Out of the 2,917,000 people living in Mainland Finland who
                                        gambled, this means 72,000 people.

                                        Figure 1. Past-year prevalence of at-risk and problem gambling, respondents
                                        aged 15 to 74 between 2007 and 2019 (%).

Anne Salonen
anne.salonen@thl.fi
Heli Hagfors
heli.hagfors@thl.fi

Kalle Lind
kalle.lind@thl.fi
Jukka Kontto
jukka.kontto@thl.fi

                                                                                                                                   1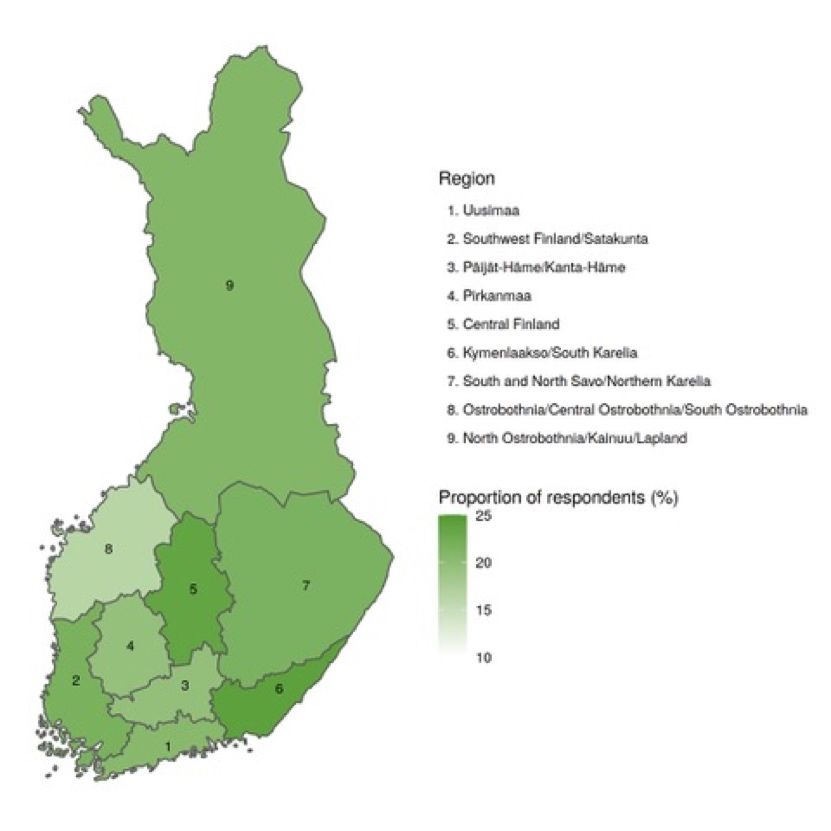
Finnish Gambling 2019

                                  Contents

                                  Background ........................................................................................................ 3
                                  Gambling ............................................................................................................ 3
                                              Prevalence of gambling ........................................................................ 3
                                              Gambling frequency ............................................................................. 4
                                              Prevalence of gambling games provided under the monopoly
                                                     system ...................................................................................... 4
                                              Gambling by operator(s) ...................................................................... 5
                                              Number of game types gambled ......................................................... 6
                                              Gambling mode .................................................................................... 7
                                              Weekly gambling expenditure in 2019................................................. 8
                                  Gamblers’ experienced problem gambling ...................................................... 8
                                              Prevalence of problem gambling and at-risk gambling ..................... 9
                                              Problem gambling severity by gambling participation .................... 10
                                              Gambling severity by gambling different game types ...................... 11
                                  Concerned significant others of problem gamblers ...................................... 13
                                  Regional comparisons ..................................................................................... 15
                                              Past-year gambling............................................................................. 15
                                              Weekly gambling ................................................................................ 16
                                              Gambling at least four game types .................................................... 17
                                              Online gambling ................................................................................. 18
                                              At-risk and problem gambling ........................................................... 19
                                              Concerned significant others of at least one problem gambler ...... 20
                                  Terms and definitions ...................................................................................... 21
                                  References ........................................................................................................ 23
                                  Quality description .......................................................................................... 24
                                  Appendix tables................................................................................................ 31
                                  Appendix figure ............................................................................................... 32

                                                                                                                                                       2
THL – Statistical report 9/2020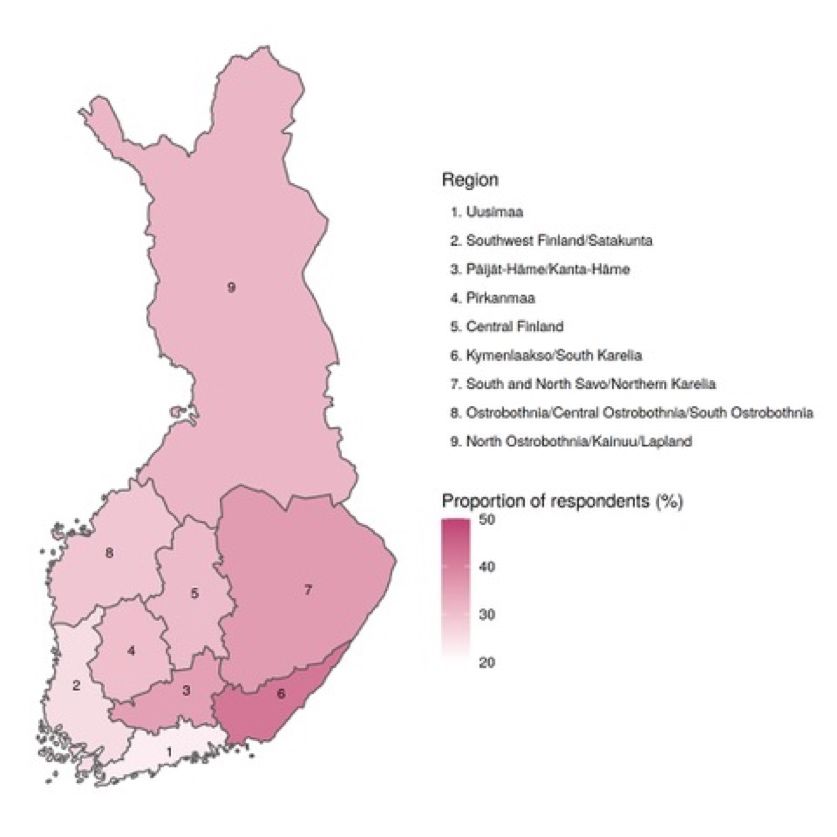
Finnish Gambling 2019

                                          Background
To be considered in this                  The Finnish Gambling population study examines gambling and problem gambling
year’s statistic:                         among Finnish people aged from 15 to 74 living in Mainland Finland in 2007, 2011, 2015
                                          and 2019. The study was conducted by the Finnish Institute for Health and Welfare, and
Until the end of 2016, three state-
                                          commissioned and financed by the Ministry of Social Affairs and Health (section 52 of the
controlled gambling operators had
                                          Lotteries Act). The data collection for the study was carried out by Statistics Finland as
exclusive rights to organise gambling
                                          computer-assisted telephone interviews (CATI) between 2 September and 13 December
in Finland: Finland's Slot Machine
                                          2019. In 2019, 3,994 Finnish people took part in the study (response rate 52%).
Association (RAY), Veikkaus Oy and
Fintoto Oy.
                                          Gambling
The Finnish gambling system was
reformed in January 2017, and the         Gambling refers to playing games where the winnings or losses comprise money or prizes
three gambling operators were             of monetary value. Such games include for example weekly lottery games, slot machines,
merged to form Veikkaus Ltd.              scratch cards and sports betting. Gambling is also available online. Under the Lotteries Act,
                                          lotteries – in other words, gambling – mean an activity in which participants may win a
The purpose of the merger was to          prize of monetary value based in full or in part on chance and in which there is a charge for
eliminate competition between the         participation. Gambling does not include video, console, computer and mobile games or
three former gambling operators and       other digital games that are not played for money or stakes consisting of money.
to prevent and reduce gambling
harms more effectively.                   Prevalence of gambling
Since 1 October 2010, the age limit for   In 2019, the past-year prevalence of gambling at least one game type among the
gambling has been 18 years, and           respondents was 78.4% (74.5% for women and 82.2% for men). This means approximately
following a transition period this age    2,917,000 people living in Mainland Finland.
limit has also applied to slot machines
                                          The past-year prevalence of gambling at least one game type did not change between
since 1 July 2011. The previous age
                                          2015 and 2019 (Appendix Table 1). On the other hand, the prevalence of gambling reduced
limit was 15.
                                          among men between 2015 and 2019. An examination by age group showed that this
                                          reduction only concerned the age group 18 to 24 (Figure 2).
                                          In total, the prevalence of gambling has increased compared to 2007. This increase
                                          concerns both genders and all age groups over 24. On the other hand, the proportion of
                                          gamblers aged from 15 to 17 decreased between 2007 and 2015, which is probably due to
                                          the change in the age limit for gambling.

                                          Figure 2. Past-year gambling prevalence, respondents aged 15 to 74 by age
                                          group between 2007 and 2019 (%)

General notes
Not only land-based gambling but also
online gambling, either using a
computer or a mobile device, are
available in Finland.
The term ‘land-based’ gambling refers
to games offered in environments
other than the Internet, for example at
operators' gambing locations (casinos,
game arcades, etc.) and distributor
locations (kiosks, grocery stores,
restaurants, etc.).
Veikkaus Ltd has a casino located in
Helsinki, and a second casino is being
planned in Tampere.

                                                                                                                                       3
THL – Statistical report 9/2020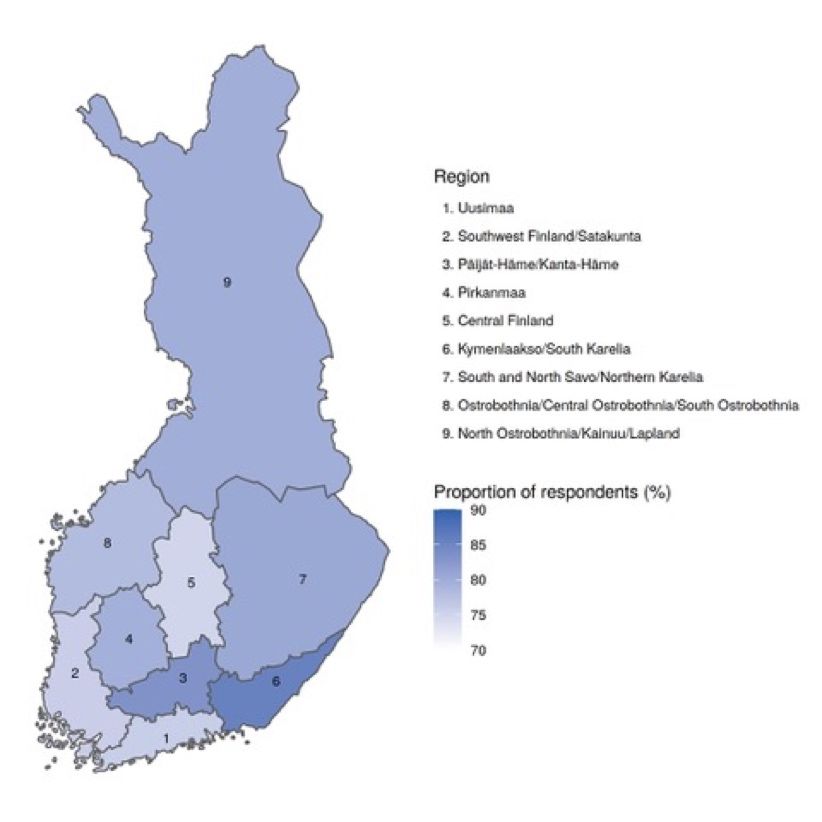
Finnish Gambling 2019

                                         Gambling frequency
General notes                            In 2019, more than one out of four respondents (29.2%) gambled once a week or more
Veikkaus Ltd has exclusive rights to     often (women 20.3%, men 38.0%). Men typically gambled one to three times a month
operate gambling games in Mainland       (57.7%), whereas the most typical gambling frequency for women was less than once a
Finland.                                 month (37.6%) or one to three times a month (36.9%).

PAF (Ålands Penningautomatförening)      The prevalence of regular gambling decreased between 2015 and 2019 (Appendix tables 2
operates gambling games in the Åland     to 5, Figure 3). The prevalence of gambling daily or several times a week decreased in the
Islands as a monopoly. PAF operates      age groups 18 to 24 and 55 to 64. On the other hand, the prevalence of gambling less often
games online but also on ships sailing   than once a month increased in all age groups except those aged between 45 and 54. The
between Finland and Sweden or            changes in gambling frequency were similar for both genders between 2015 and 2019.
Estonia.                                 The prevalence of gambling at least once a month also decreased between 2007 and 2019,
The games offered by foreign             whereas the prevalence of gambling less often than once a month increased in the same
gambling operators are mainly            period. These changes have been similar for both genders.
gambled online.
                                         Figure 3. Past-year gambling frequency, respondents aged 15 to 74 between
Participating in gambling offered by
                                         2007 and 2019 (%)
PAF and/or foreign gambling
operators is not prohibited under
Finnish legislation.
Finnish people can also participate in
private betting and/or card games
with money as stakes.

To be considered in this
year’s statistic:
                                         Prevalence of gambling games provided under the monopoly system
The selection and offer of games
change constantly: new games enter       The past-year prevalence of gambling at least one game type offered by Veikkaus Ltd in
the market, and old ones may no          2019 was 77.9% (approx. 2,897,000 people; women 74.1%, men 81.5%).
longer be available.
                                         The most popular game types offered by Veikkaus Ltd were weekly lottery games and/or
Due to changes in the availability of    Jokeri (63.6%), scratch cards (47.2%) and slot machine games outside the casino (30.6%)
games, the way in which the              (Appendix Table 6, Figure 4). These game types have ranked among the three most
prevalence of playing different game     popular games since 2007. In the 2019 study, more detailed questions were asked about
types has been recorded has changed      scratch card and slot machine gambling. In 2019, 44.6% of the respondents had opted for
slightly from year to year. To enable    land-based scratch card games and 7.9% Veikkaus Ltd's online scratch cards, while 28.3%
cross-sectional comparisons, some        per cent had participated in slot machine games at legally approved outlets (kiosks,
game types have been combined for        shopping centres, supermarkets, petrol stations, restaurants etc.), 5.2% in gambling
the purposes of this statistic.          arcades (mini-casinos) and 8.2% on Veikkaus Ltd's website.
As a result of game development, the     The proportion of those who gambled weekly lottery games and/or Jokeri as well as
characteristics of a game type, and      casino table games (roulette, black jack) operated by a croupier outside the casino
thus the potential harms caused by it,   decreased between 2015 and 2019, whereas the proportion of respondents who gambled
may also have changed between            scratch cards increased in the same period.
2007 and 2019.
                                         The proportion of those who gambled weekly lottery games and/or Jokeri did not change
                                         between 2007 and 2019, however, whereas the prevalence of scratch card gambling and
                                         gambling daily lottery games has increased. On the other hand, the prevalence of sports
                                                                                                                                   4
THL – Statistical report 9/2020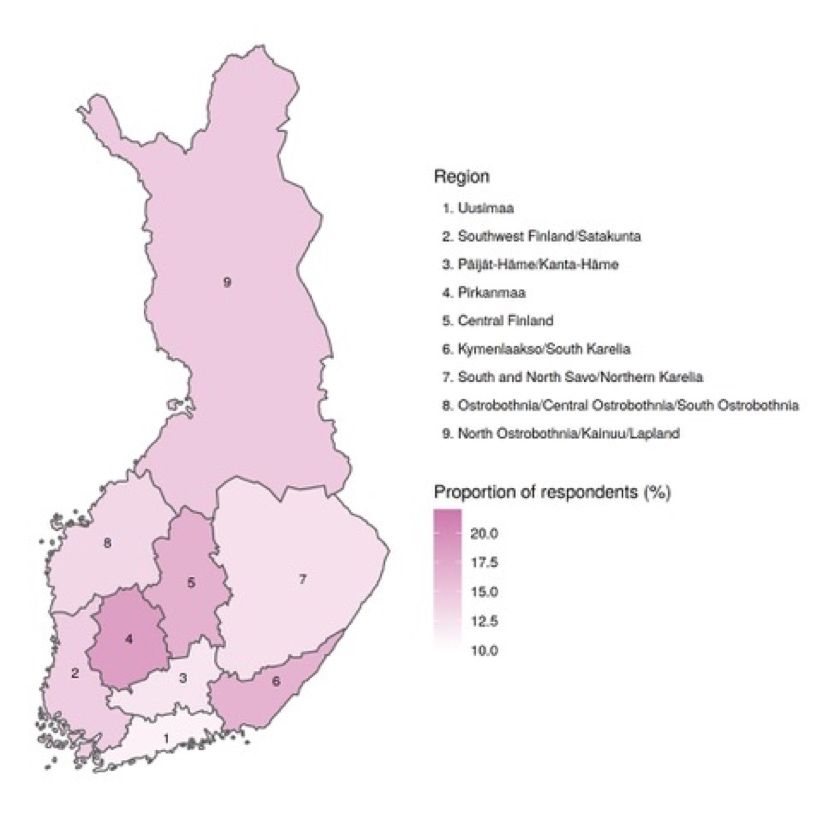
Finnish Gambling 2019

                                  betting (excluding horse games but including football pools and multibet games) and
                                  playing slot machine games has declined. The proportion of those who gambled at
                                  Helsinki Casino or gambled croupier-operated table games (roulette, black jack) outside
                                  the casino and horse games decreased between 2015 and 2019.

                                  Figure 4. Gambling game types provided under the monopoly system,
                                  respondents aged 15 to 74 between 2007 and 2019 (%)

                                  Gambling by operator(s)
                                  In 2019, participation in types of gambling provided under the monopoly system refers to
                                  Veikkaus Ltd's games, whereas in earlier years similar games were offered by three
                                  gambling operators: RAY, Fintoto and Veikkaus.
                                  In 2019, 77.9% of the respondents had gambled at least one of the game types offered by
                                  Veikkaus. On the other hand, 6.2% (approx. 231,000 people) had gambled at least one
                                  non-monopoly online game (Appendix Table 7). This classification includes online
                                  gambling offered by PAF and foreign gambling companies (off-shore gambling) but not
                                  private betting and gambling PAF’s games on ships. Almost all (98.1%) gamblers who
                                  gambled non-monopoly games had also gambled games offered in the monopoly system.
                                  The proportion of respondents who gambled at least one game typed provided under the
                                  monopoly system did not change from 2015 to 2019 (Figure 5). The prevalence of
                                  gambling at least one non-monopoly online game increased by 1.1 percentage points,
                                  however: whereas 5.1% of gamblers gambled non-monopoly online games in 2015, the
                                  corresponding figure in 2019 was 6.2%. However, the proportion of those who gambled
                                  PAF’s online games reduced from 2.8% to 1.8% between 2015 and 2019, while the
                                  proportion of those who gambled off-shore went up from 3.3% to 5.4% (Appendix Table 7).
                                  While the proportion of respondents who gambled at least one game type available in the
                                  monopoly system has remained stable in recent years, it has nevertheless increased by 4.7
                                  percentage points between 2007 and 2019. In the same period, the proportion of gamblers
                                  who participate in private betting and/or card games with money as stakes has dropped
                                  from 8.2% to 4.2%. The proportion of those opting for non-monopoly online games, on the
                                  other hand, has increased from 4.4% to 6.2%.

                                                                                                                             5
THL – Statistical report 9/2020
Finnish Gambling 2019

                                  Figure 5. Past-year gambling prevalence by operator(s), respondents aged 15 to
                                  74 between 2007 and 2019 (%)

                                  The respondents who gambled non-monopoly games (6.2%, n = 220) offered by either PAF
                                  or a foreign gambling operator were examined in greater detail. Those who had
                                  participated in private betting or gambled games on ships sailing to Sweden and/or
                                  Estonia were excluded from this examination. The gamblers in this group had an average
                                  of 2.7 different gaming accounts (range 0 to 30, median 2), while 30.4% had three or more
                                  accounts. Most typically, they gambled non-monopoly slot machine games, sports betting
                                  (excluding horse games) and poker. As the three most common reasons for non-monopoly
                                  gambling were reported good odds and better return rates, high winnings and a wider
                                  range of games.

                                  Number of game types gambled
                                  One out of five respondents (20.7%) had gambled at least four different game types
                                  (Appendix table 8) in 2019. The proportion of those who gambled at least four different
                                  game types did not change from 2015 to 2019; however, this proportion decreased in the
                                  age group 18 to 24, while it increased in the age group 45 to 54 in the same period.
                                  Nevertheless, the prevalence of gambling at least four game types increased among
                                  women between 2007 and 2019 (Figure 6). There was a particular increase in the
                                  prevalence of gambling at least four game types in the age group 35 to 54 (Figure 6). On
                                  the other hand, the proportion of gamblers who gambled at least four game types
                                  decreased in the age group 15 to 17.

                                                                                                                             6
THL – Statistical report 9/2020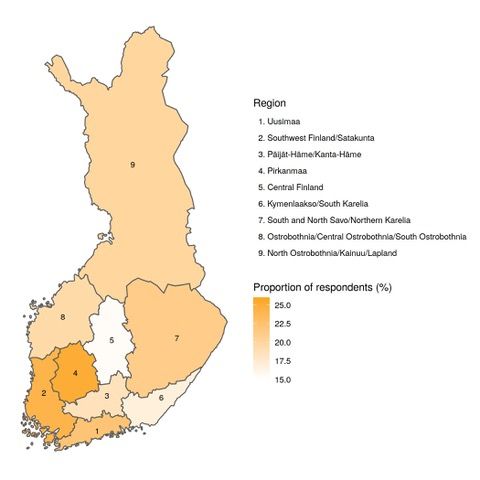
Finnish Gambling 2019

                                  Figure 6. Past-year gambling, respondents aged 15 to 74 who gambled at least
                                  four game types between 2007 and 2019 (%)

                                  Gambling mode
                                  The past-year prevalence of online gambling in 2019 was 36.3% (women 27.2%, men
                                  46.0%) (Appendix table 9). In the same year, 14.0% had only gambled online, and 22.3%
                                  had gambled both online and land-based games. The proportion of those who only
                                  gambled land-based games was 41.8%.
                                  The prevalence of online gambling has increased since 2007, and between 2015 and 2019,
                                  this increase was 12.7 percentage points. Since 2007, the change has been similar among
                                  both women and men, but also in all age groups of 18 or over (Figure 7).

                                  Figure 7. Prevalence of online gambling, respondents aged 15 to 74 by age group
                                  between 2007 and 2019 (%)

                                                                                                                          7
THL – Statistical report 9/2020
Finnish Gambling 2019
Weekly gambling expenditure in 2019
Those who had participated in gambling in the last 12 months (n = 3,122) were asked to
estimate the amount they spent on gambling. The average weekly gambling expenditure
among past-year gamblers was €10.33 (95% confidence interval between €7.86 and €12.80,
the median €2.5). The average was €15.60 for men (95% confidence interval €11.04–€20.17)
and €4.47 for women (95% confidence interval €3.45– €5.50).
In 2019, 2.5% of gamblers accounted for 50% of the total gambling expenditure, while 17.8%
accounted for 80% (Figure 8). This means that of the 2,917,000 people living in Mainland
Finland who participated in gambling in 2019, 72,000 people spent one half of the total
expenditure of that year.
In 2019, the respondents were also asked for the first time about their gambling
expenditure on Veikkaus Ltd's games. Of the total gambling expenditure of all those who
gambled, 87.5% was spent on Veikkaus Ltd's games, while 12.5% was spent on non-
monopoly games. For the part of online gamblers, Veikkaus Ltd's share in the expenditure
was lower: 83.6% of the expenditure was spent on Veikkaus Ltd's games, while the share
of non-monopoly games was 16.4%. In 2019, 642 respondents had also spent money on
non-monopoly gambling. A more detailed examination of this group of gamblers showed
that 77.4% of their expenditure was spent on games operated by Veikkaus Ltd, and the
remaining 22.6% on non-monopoly games.
In 2019, the respondents were allowed to report their gambling expenditure based on
gambling frequency of their choice. In earlier years, the questions regarding gambling
expenditure were worded slightly differently, which is why cross-sectional studies of
gambling expenditure are not included in this report. However, the total accumulation of
gamblers’ gambling expenditure between 2007 and 2015 is presented in Appendix figure 1.
Figure 8. Total accumulation of gambling expenditure and 95% confidence
intervals in 2019 among past-year gamblers
General notes
Two indicators were used to study
the respondents' potential
problem gambling.
• SOGS (the South Oaks
Gambling Screen) has been
used since 2003.
• SOGS results enable
comparisons over the longest
time period in Finland.
Gamblers’ experienced problem gambling
• PGSI (the Problem Gambling
Severity Index) has been used Problem gambling was primarily assessed using the SOGS (the South Oaks Gambling
since 2011. Screen; Lesieur & Blume 1987; 1993). The term problem gambling (SOGS ≥ 3) is used as an
upper-level concept when talking about problematic and pathological gambling. These
• For example, PGSI results are two categories are mutually exclusive. On the continuum describing gambling severity,
suitable for comparing the probable pathological gambling (SOGS ≥ 5) is the most severe form. Problematic gambling,
prevalence of problem on the other hand, describes a less severe condition than pathological gambling which
gambling in the Nordic has negative consequences, such as health problems and financial difficulties. At-risk
countries. gambling (SOGS = 1–2) is the mildest form of the problem. It refers to gambling that does
not cause significant harms to the gambler. On the other hand, it often precedes the
development of a problem gambling.
8
THL – Statistical report 9/2020Finnish Gambling 2019
Prevalence of problem gambling and at-risk gambling
The study of 2019 indicates that 3.0% of respondents aged from 15 to 74 engaged in
problem gambling (approx. 112,000 people). Of these, 1.4% suffered from probable
pathological gambling (approx. 52,000 people). 4.0% of men and 2.1% of women engaged
in problem gambling (Figure 10). The prevalence of problem gambling was the highest in
age groups 18 to 24 (5.3%) and 25 to 34 (4.8%). In 2019, the proportion of at-risk gamblers
was 10.7% (approx. 397,000 people).
The prevalence of problem gambling did not change between 2015 and 2019 (Appendix
table 10). However, the prevalence of at-risk and problem gambling (SOGS ≥ 1) decreased
among both genders (Appendix table 11) and in all age groups except those aged 65 or
over. The prevalence of at-risk gambling also decreased between 2007 and 2019 among
men (Figure 9) and among those under 25 years and individuals between 35 to 54 years
old.
The prevalence of probable pathological gambling did not change between 2015 and 2019,
it also did not change from 2007 to 2019. In 2019, 1.9% of men and 0.9% of women
suffered from probable pathological gambling.
In contrast, gambling without identified problems (SOGS = 0) increased from 2015 to 2019
(Figure 9). This increase was particularly noticeable among men and in the age groups 15
to 17 and 35 to 44 (Appendix table 12). Gambling without identified problems increased
compared to year 2007. Of the respondents, 64.7% has gambled without indentified
problems.
Figure 9. Past-year prevalence rates of at-risk and problem gambling,
respondents aged 15 to 74 between 2007 and 2019 (%).
9
THL – Statistical report 9/2020Finnish Gambling 2019
Figure 10. Past-year prevalence rates of at risk and problem gambling by gender,
respondents aged 15 to 74 between 2007 and 2019 (%).
For corresponding results regarding the prevalence of problem gambling obtained using
the PGSI, see Appendix table 13.
Problem gambling severity by gambling participation
The prevalence of at-risk and problem gambling was examined by participation in
gambling (Appendix table 14). Problem gambling was more prevalent among those who
gambled several times a week and participated in at least four game types than among
the other respondents. At-risk gambling was more prevalent among those who gambled
once a month or more often, or those who gambled at least three different game types,
than among other gamblers.
When examining the gambling mode, among those who had gambled both online and
land-based games at-risk or problem gambling was more prevalent. In 2019, questions
about Veikkaus Ltd’s membership (e.g. level of membership with certain incentives) were
included. The membership programme is for registered patrons of Veikkaus Ltd. In order
to move from one level to the next and access more attractive benefits, the customer must
use responsible gambling tools, but on the other hand gamble more often than on the
previous level. In addition to sales outlets, members can gamble Veikkaus Ltd's games
online (e.g. on mobile devices). Veikkaus Ltd's members, particularly Silver and Gold level
patrons, engaged in at-risk gambling or problem gambling more often than other
gamblers. Those who had one or more non-monopoly gambling accounts also engaged in
at-risk or problem gambling more often than other gamblers. Managed by the gambling
operator, the gambling account records the gambler’s gambling behaviour (game event
data and money transfers). On the other hand, these gamblers were also more likely than
others to gamble on a weekly basis and participate in a higher number of different game
types.
10
THL – Statistical report 9/2020Finnish Gambling 2019
Figure 11. Problem gambling prevalence rates by participation in different game
types, gamblers aged from 15 to 74 in 2019 (%)
Gambling severity by gambling different game types
When looking at the game types offered in the monopoly system, it was found that the
problem gambling prevalence rate in 2019 was the highest for those who gambled at
Helsinki Casino, those who opted for croupier-operated table games, and those who
participated in online casino games (Appendix table 15, Figure 11). On the other hand,
these gamblers were also more likely than others to gamble on a weekly basis and gamble
more types of games. The lowest problem gambling prevalence was found among those
who gambled weekly lottery games and/or Jokeri. A similar trend was also observed when
examining at-risk and problem gambling.
11
THL – Statistical report 9/2020Finnish Gambling 2019
Figure 12. Problem gambling prevalence rates among land-based and online
scratch card gamblers aged 15 to 74 in 2019 (%)
General notes
The assessment of gambling
problems from the perspective of
concerned significant othes (CSOs)
is based exclusively on the personal
views of CSOs.
These views were examined through
a single question about the
gambling of different family
members (father, mother,
brother/sister, grandparent, spouse,
child) or a friend important for the
respondent.
No time span was specified in this When we look separately at gamblers who gambled Veikkaus Ltd's land-based and online
question. Consequently, the scratch cards, we find that the prevalence of problem gambling and at-risk level gambling
responses can be interpreted to was higher among those who gambled online scratch cards than among gamblers who
refer to the respondent's life in opted for land-based scratch cards (Figure 12).
general terms.
Those who gambled slot machine games in Veikkaus Ltd’s arcades (Pelaamo, Feel Vegas,
In other words, the figures are not etc.) and on the operator’s website were more likely to engage in problem gambling than
comparable with the responses those who gambled at legally approved outlets (supermarkets, kiosks, petrol stations,
concerning the respondents' restaurants etc.) (Figure 13).
personal past-year gambling
behaviour. Figure 13. Problem gambling prevalence rates by different environments for slot
machine gambling, gamblers aged from 15 to 74 in 2019
12
THL – Statistical report 9/2020Finnish Gambling 2019
Figure 14. Problem gambling prevalence rates among gamblers gambling games
offered by different operators, gamblers aged from 15 to 74 in 2019
When we examine experienced gambling problems in 2019 by operator, we find that the
prevalence of at-risk gambling and problem gambling was lower among those who
gambled only games provided in the monopoly system than those who gambled non-
monopoly games (Appendix table 16, figure 14). On the other hand, those who gambled
non-monopoly games were also more likely than others to gamble on a weekly basis and
more different types of games.
Concerned significant others of problem gamblers
According to the statistic for 2019, 21.1% of the respondents (approximately 790,000
people) reported having one or more significant others who had a gambling problem
(Table 17, figure 15). The proportion of these respondents increased between 2015 and
2019, and also between 2007 and 2019. When examined by gender, it was found that the
proportion of male respondents increased between 2015 and 2019, whereas the
proportion of female respondents increased between 2007 and 2019.
The proportion of concerned significant others of problem gamblers among respondents
aged 25 to 34 and 45 to 55 increased from 2007 to 2019, while in the age group 15 to 17,
this proportion decreased from 18.4% to 9.7% in the same period.
In 2019, the most likely person to have a gambling problem was a friend important for the
respondent (13.7%) (Appendix table 18). The proportion of respondents who had at least
one friend with a gambling problem did not change, apart from in the age group 15 to 17,
between 2007 and 2019, whose proportion in fact decreased by 8.5 percentage points in
this period.
One out of ten respondents (10.0%) had a family member with a gambling problem
(Appendix table 19). The proportion of those who had at least one family member with a
gambling problem did not change between 2015 and 2019. On the other hand, in 2019 the
proportion of respondents who had at least one family member with a gambling problem
was 3.3 percentage points higher than in 2007. This change was similar for both genders
and in all age groups from 25 to 64.
In 2019, the family member with a gambling problem was most typically the respondent's
sibling (3.2%), father (2.5%) or spouse (2.1%) (Appendix table 19). There was an increase in
13
THL – Statistical report 9/2020Finnish Gambling 2019
the prevalence rate of problem gambling among respondents’ fathers, siblings,
grandparents and spouses between 2007 and 2019.
Figure 15. Concerned significant others of problem gamblers, respondents aged
15 to 74 between 2007 and 2019 (%)
14
THL – Statistical report 9/2020Finnish Gambling 2019
Regional comparisons
Past-year gambling
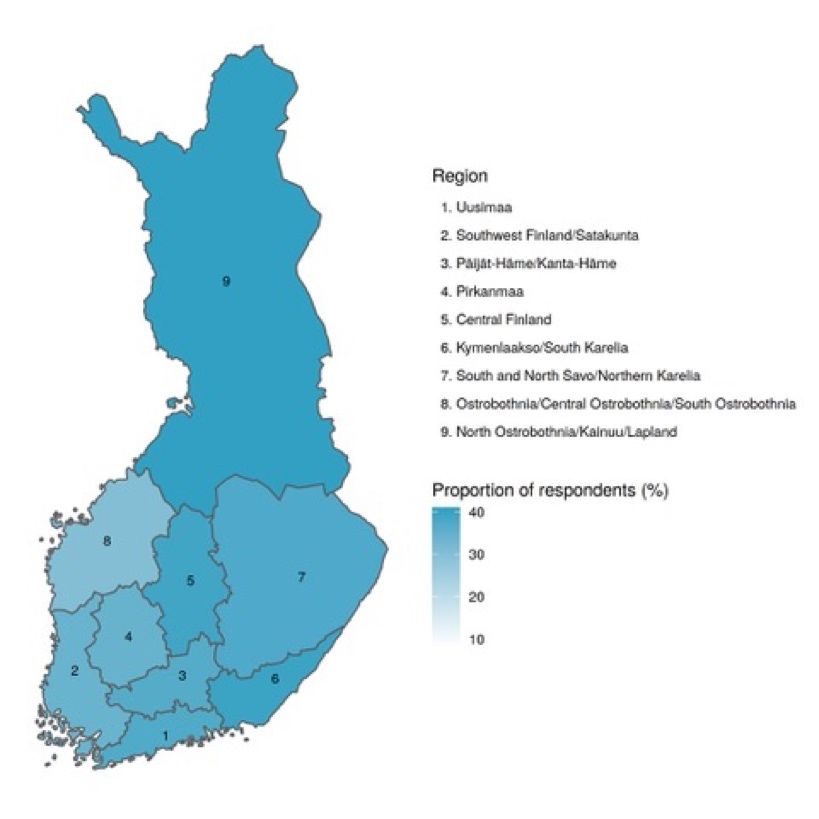
In 2019, the highest past-year gambling prevalence rates were found in
Kymenlaakso/South Karelia (85.5%) as well as Päijät-Häme and Kanta-Häme (83.3%)
(Appendix table 21, Figure 16) and the lowest in Central Finland (75.0%).
Between 2015 and 2019, the prevalence of gambling decreased in Southwest
Finland/Satakunta. On the other hand, its increased in Uusimaa, Pirkanmaa,
Kymenlaakso/South Karelia and North Ostrobothnia/Kainuu/Lapland between 2007 and
2019.
Figure 16. Gambled at least one game type during the past year, respondents
aged 15 to 74 in 2019 (%)
15
THL – Statistical report 9/2020Finnish Gambling 2019
Weekly gambling
The highest past-year gambling prevalence rates for those who gambled at least once a
week were found in Kymenlaakso/South Karelia (41.8 %) and Päijät-Häme and Kanta-
Häme (83.3%) (Appendix table 22, Figure 17). The prevalence rate was the lowest in
Uusimaa (22.8%).
The prevalence rate of gambling on a weekly basis reduced in Uusimaa, Southwest
Finland/Satakunta and North Ostrobothnia/Kainuu/Lapland between 2015 and 2019. This
rate decreased in all regions between 2007 and 2019, except in Kymenlaakso/South
Karelia and South and North Savo/North Karelia.
Figure 17. Gambled at least once a week during the past year, respondents aged
15 to 74 in 2019 (%)
16
THL – Statistical report 9/2020Finnish Gambling 2019
Gambling at least four game types
The highest past-year prevalence rates of gambling at least four game types in 2019 were
found in Kymenlaakso/South Karelia (24.1%) and Central Finland (23.6%) (Appendix table
23, Figure 18), and the lowest rates in Ostrobothnia, Central Ostrobothnia and South
Ostrobothnia (16.3%).
The past-year prevalence rate of gambling at least four game types did not change
between 2015 and 2019. However, it increased in South and North Savo and North Karelia
between 2007 and 2019.
Figure 18. Gambled at least four game types during the past year, respondents
aged 15 to 74 in 2019 (%)
17
THL – Statistical report 9/2020Finnish Gambling 2019
Online gambling
The past-year prevalence rates of online gambling in 2019 were the highest in North
Ostrobothnia/Kainuu/Lapland (40.5%) and Kymenlaakso/South Karelia (39.5%) (Appendix
table 24, Figure 19). The prevalence of online gambling was the lowest in Ostrobothnia,
Central Ostrobothnia and South Ostrobothnia (30.1 %).
The prevalence of online gambling has increased in all regions since 2007.
Figure 19. Past-year online gambling, respondents aged 15 to 74 in 2019 (%)
18
THL – Statistical report 9/2020Finnish Gambling 2019
At-risk and problem gambling
The prevalence of at-risk and problem gambling in 2019 (SOGS ≥ 1) was the highest in
Pirkanmaa (18.4%) (Appendix table 25, Figure 20) and the lowest in Uusimaa (11.0%),
Päijät-Häme/Kanta-Häme (12.3%) as well as South and North Savo and North Karelia
(12.7%).
The prevalence of at-risk and problem gambling decreased in Uusimaa, Southwest
Finland/Satakunta and South and North Savo/North Karelia between 2015 and 2019.
Between 2007 and 2019, the prevalence of at-risk and problem gambling decreased in
Uusimaa and South and North Savo/North Karelia but also in Päijät-Häme and Kanta-
Häme.
Figure 20. Past-year prevalence of at-risk and problem gambling, respondents
aged 15 to 74 in 2019 (%).
19
THL – Statistical report 9/2020Finnish Gambling 2019
Concerned significant others of at least one problem gambler
According to the statistic for 2019, the highest prevalence of concerned significant others
of problem gamblers was found in Pirkanmaa (25.1%) and Southwest Finland/Satakunta
(24.2%) (Appendix table 26, Figure 21). On the other hand, the lowest prevalence rates of
gambling experienced as problematic by concerned significant others were found in
Central Finland (15.4%) and Kymenlaakso/South Karelia (16.8%).
The prevalence of concerned significant others of problem gamblers was higher in
Uusimaa and Southwest Finland/Satakunta in 2019 than in 2015. The figure for 2019 was
also higher than in 2007 in Southwest Finland/Satakunta.
Figure 21. Concerned significant others of problem gamblers in 2019 (%)
20
THL – Statistical report 9/2020Finnish Gambling 2019
Terms and definitions
Problematic gambling: Problematic gambling describes a less severe condition than
pathological gambling which has many negative consequences, such as health problems
and financial difficulties. On the continuum describing the severity of problem gambling, it
is found between at-risk gambling and pathological gambling.
PAF: Ålands Penningautomatförening. PAF is responsible for gambling activities in the
Åland Islands, where it operates slot machines, casino games and sports betting as a
monopoly. PAF also operates gambling games on passenger ships sailing across the Baltic
Sea whose home port is located in the Åland Islands.
Gambling account: Under the Lotteries Act (section 4, 1047/2001), a gambling account
means an account kept by a gambling company for a player for gambling in which money
transfers between the gambling company and the player as well as gambling transactions
are recorded.
PGSI: The Problem Gambling Severity Index. PGSI is an instrument measuring problem
gambling by means of nine questions. In the Finnish Gambling population study, PGSI has
been used as a secondary indicator for assessing the prevalence of problem gambling.
Game: In the context of gambling, a game refers to games where the winnings or losses
comprise money or prizes of monetary value. They include lottery games, slot machines,
land-based scratch cards and sports betting. Games are also available online. Under the
Lotteries Act, lotteries – in other words, gambling– mean an activity in which participants
may win a prize of monetary value based in full or in part on chance and in which there is a
charge for participation.
Gambler: A gambler is a person who has gambled at least one game type.
Problem gambling: The term problem gambling is used as an upper-level concept when
talking about problematic and pathological gambling. The latter two categories are
mutually exclusive.
Pathological gambling: Pathological gambling refers to a condition in which the gambler
has a strong and compulsive need to gamble; they are unable to control their gambling
and therefore neglect both their basic needs and obligations. On the continuum
describing the severity of problematic gambling, pathological gambling is the most severe
form. It has been/is also referred to as a gambling disorder (GD). In this report, however,
pathological gambling does not refer to a diagnosis based on a clinical assessment, which
is why we use the term probable pathological gambling.
At-risk gambling: At-risk gambling refers to gambling that does not cause significant
harms to the gambler. However, it often precedes the development of a gambling problem.
On the continuum describing the severity of problematic gambling, at-risk gambling is the
mildest form.
SOGS: The South Oaks Gambling Screen. SOGS is an instrument measuring problem
gambling by means of 20 questions. In the Finnish Gambling population study, SOGS has
been used as the primary indicator for assessing the prevalence of gambling problems.
Monopoly: In the Finnish system of exclusive rights to operate gambling, the Lotteries Act
gives Veikkaus Ltd a monopoly for operating games in Mainland Finland. However, Finnish
legislation does not prohibit gamblers from gambling the games provided by other
operators, such as PAF, which operates under the legislation of the Åland Islands or off-
shore operators (regulated or non-regulated online gambling providers).
21
THL – Statistical report 9/2020Finnish Gambling 2019
Symbols used in the tables
. data too uncertain for presentation
.. data not available or too uncertain for presentation, or subject to secrecy
www.thl.fi/tilastot/rahapelaaminen
22
THL – Statistical report 9/2020Finnish Gambling 2019
References
Aho P, Turja T. Suomalaisten rahapelaaminen 2007. Ministry of Social Affairs and Health
and Taloustutkimus. Helsinki. 2007.
Lotteries Act 1047/2001: http://www.finlex.fi/fi/laki/ajantasa/2001/20011047 [23 March
2020].
Currie SR, Casey DM, Hodgins DC. Improving the Psychometric Properties of the Problem
Gambling Severity Index. Canadian Consortium for Gambling Research, 2010.
Ferris J, Wynne H. The Canadian problem gambling index: Final Report. Canada:
Submitted for the Canadian Centre on Substance Abuse. 2001.
Ilkas H, Turja T. Rahapelitutkimus 2003. Helsinki: Ministry of Social Affairs and Health and
Taloustutkimus, 2003.
Kontto J, Tolonen H, Salonen AH. What are we missing? – The profile of non-respondents
in the Finnish Gambling 2015 survey. Scand J Public H. 2019.
doi/full/10.1177/1403494819849283.
Lesieur H, Blume S. The South Oaks Gambling Screen (SOGS): a new instrument for the
identification of pathological gamblers. American Journal of Psychiatry. 1987;144:1184–
1188.
Lesieur H, Blume S. Revising the South Oaks Gambling Screen in different settings. Journal
of Gambling Studies. 1993;9: 213-223.
Salonen AH, Castrén S, Raisamo S, Alho H, Lahti T. Rahapeliriippuvuuden tunnistamiseen
kehitetyt mittarit. Sosiaalilääketieteellinen aikakauslehti. 2013;2;113–129.
Salonen A, Raisamo S. Suomalaisten rahapelaaminen 2015. Rahapelaaminen,
rahapeliongelmat ja rahapelaamiseen liittyvät asenteet ja mielipiteet 15–74-vuotiailla.
Finnish Institute for Health and Welfare. Report 16/2015, Helsinki.
Salonen AH, Raisamo S, Alho H. Suomalaisten rahapeliongelmien väestötutkimusten
haasteet kansainvälisessä vertailussa. Analyysit. Yhteiskuntapolitiikka.2013;78(6):650–660.
Stone CA, Romild U, Abbott M, Yeung K, Billi R, Volberg R. Effects of Different Screening and
Scoring Thresholds on PGSI Gambling Risk Segments. Int J Ment Health Addiction.
2015;13:82–102. Doi10.1007/s11469-014-9515-0.
Turja T, Halme J, Mervola M, Järvinen-Tassopoulos J, Ronkainen J-E. Suomalaisten
rahapelaaminen 2011. Statistical report 14/2012. Helsinki: Finnish Institute for Health and
Welfare.
Williams R, Volberg R, Stevens R. The population prevalence of problem gambling:
Methodological influences, standardized rates, jurisdictional differences, and worldwide
trends. Report prepared for the Ontario Problem gambling Research Centre and the
Ontario Ministry of Health and Long Term Care. 2012:1–273.
Wardle H, Moody A, Spence S, Orford J, Volberg R, Jotangia D, Griffiths M, Hussey D, Dobbie
F. British Gambling Prevalence Survey 2010. UK: National Centre for Social Research. 2011.
ISSN 1798-0887
23
THL – Statistical report 9/2020Finnish Gambling 2019
Quality description
Finnish Gambling
The Finnish Gambling population study was commissioned by the Ministry of Social Affairs
and Health and carried out by the Finnish Institute for Health and Welfare (THL). Under
section 52 of the Lotteries Act (1047/2001), responsibility for monitoring gambling
prevalence among the population as well as preventing and reducing gambling harms and
developing treatment for them rests with the Ministry of Social Affairs and Health. The
Ministry has assigned responsibility for fulfilling this obligation to the Finnish Institute for
Health and Welfare. Launched in 2003 and carried out every four years, the Finnish
Gambling population study is the key data source on gambling among the population in
Finland. The study is planned by the Finnish Institute for Health and Welfare and financed
by the Ministry of Social Affairs and Health (section 52 of the Lotteries Act).
Research data
The target population of the Finnish Gambling 2019 study was those living in Mainland
Finland aged between 15 and 74 (household population). Persons living in institutions and
persons whose mother tongue is other than Finnish, Swedish or Sámi were excluded from
the study. The sample of 7,800 people was selected by means of systematic random
sampling from a sampling frame formed on the basis of the Population Register Centre’s
register data and organised by municipality of residence ID. In other words, the subjects
for the sample were selected from the sampling frame at regular intervals, starting at a
randomly selected point. This ensured the regional representativeness of the sample. In
total, 3,994 interviews were completed acceptably in 2019. After reducing overcoverage,
the response rate was 51.9%.
The data collection for the Finnish Gambling 2019 study was carried out by the Data
Collection Department of Statistics Finland on commission from the Finnish Institute for
Health and Welfare between 2 September and 13 December 2019. Similarly to previous
years, the data collection was carried out in Finnish or Swedish as computer assisted
telephone interviews (CATI). The average interview duration was about 24 minutes (in
2015: 18 minutes). The duration of 75% of the interviews was 29 minutes or less (in 2015:
21 minutes). Towards the end of the data collection phase, the interview unit performed
its usual tasks of attempting to reach subjects whom the first interviewer had been unable
to contact. Respondents were approached again by a letter, telephone numbers were
sought, and all efforts were made to reach the respondents. As there was a risk of a postal
strike, the schedule for sending the letters had to be shortened. The interviewers were
instructed to send letters urgently to all remaining potential subjects. As the postal strike
took place between 11 and 27 November 2019, the importance of electronic
communication was stressed. Originally scheduled to end on 29 November 2019, the data
collection was extended by two weeks. During this period, particular efforts were made by
the selected 12 interviewers to reach respondents at underrepresented addresses. Due to
problems with mail delivery caused by the strike, at this point it was impossible to
approach the subjects by letter. The efforts of the final two weeks produced around 160
additional interviews. The postal strike had the greatest impact on attempts to re-contact
those who had previously refused to participate and those whose telephone numbers had
not been found.
A cover letter and a brochure on the study were sent to the respondents. Two different
types of cover letters were used: a regular one and a letter for those who hesitated about
responding. As reaching respondents, and especially young people, has become more
difficult over the years, this time separate versions of the brochure were produced for
young people (aged 15 to 30) and subjects older than this. As an ‘envelope filler’, a bag of
chewing gum was also sent to persons aged under 30, with the text "Information in
suitable bites". The purpose of this was to attract the recipient to open the envelope and
to remind them of the letter when the interviewer called. The interviewers additionally
sent the Finland in Figures booklet recently published by Statistics Finland to all subjects.
24
THL – Statistical report 9/2020Finnish Gambling 2019
An introductory video was also produced to facilitate the data collection, as the target
group of which was specified especially those under 30. The interviewers found the video
link an easy-to-use and effective tool especially in electronic communications (text
messages, e-mails). In addition, Statistics Finland commissioned new cards for subjects
whose valid telephone numbers could not be found despite the attempts to do so. The
purpose of the card was to motivate respondents to report their contact information to
the interviewer. These cards turned out to work well, and a decision was made to also use
them in Statistics Finland’s other data collections.
Relevance of statistical data
The Finnish Gambling population study examines problem gambling, opinions and
attitudes towards gambling, and factors associated with them among Finnish people aged
from 15 to 74. Regular collection of nationally representative monitoring data is the only
reliable way of finding out how gambling, problem gambling, opinions and attitudes as
well as phenomena closely related to them change over time.
Key principles of conducting the study have been maintaining data comparability over
time and examining cross-sectional changes in key indicators. The key indicators are
associated with gambling (game types, gambling frequency etc.), the prevalence of
problem gambling, and opinions on gambling.
The study also strives to monitor and study current research themes and to keep up with
the development of not only the gambling offer, gambling habits and gambling
environments but also research methods. In addition, attitudes towards gambling have
been surveyed since 2011 (Attitudes Towards Gambling Scale; ATGS-8; Wardle et al. 2011).
The findings concerning attitudes and opinions in the data collected in 2019 will be
published as a separate statistical report in 2020.
The purpose of the statistic is to produce reliable and up-to-date information for social
welfare and healthcare researchers, experts, leaders and political decision-makers as well
as those developing the prevention and reduction of gambling harms and
treatment/support and care services related to these harms. The previous years’ findings
have been reported widely at various seminars and conferences as well as in several
Finnish and international scientific peer reviewed journals.
Methodology
The statistic is based on cross-sectional study data from 2007, 2011, 2015 and 2019. The
age group included in the study has changed: in 2007, the respondents were aged 15 and
over, whereas since 2011, the study has been targeted at those aged 15 to 74. Of the data
from 2007, only respondents aged 15 to 74 were included in this statistical report (n =
4,772).
The response rates of the study have varied in different years between 25.0% and 61.9%
(Table 1). International comparison of population-based gambling studies using
telephone interviews indicate that the average response rate is 52.5 % (Williams, Volberg,
Stevens 2012; Salonen, Raisamo, Alho 2013). However, in the Finnish Gambling study the
comparability of the figures is undermined by the fact that the share of overcoverage and
non-response was not reported in great detail in Taloustutkimus’ research data from 2007
and 2011. Reasons for overcoverage in 2019 were: dead (n = 15), unable to respond
because of permanent disability or illness (n = 43), living permanently abroad (n = 21),
permanently in institutional care (n = 6) and other gross non-response (n = 20).
In the data collected by Taloustutkimus, the main reasons for non-response were lack of
telephone numbers and refusals. These reasons were clearly less common in the data
collected by Statistics Finland in 2015 and 2019. The reasons for non-response in 2019
were: subject not reached because no telephone number could be found (n = 1,376),
subject not reached (n = 402), subject was reached but they did not refuse directly (n =
692), subject refused (n = 1,062), and the interview was either interrupted or the form was
not completed to the point of being acceptable (n = 169).
25
THL – Statistical report 9/2020Finnish Gambling 2019
Table 1. Sample and response rates of interviews conducted between 2007 and
2019.
2007 2011 2015 2019
Gross sample 20,000 16,000 7,400 7,800
Overcoverage .. 1 103 105
Final sample .. 15,999 7,297 7,695
Completed interviews 5,008 4,484 4,515 3,994
Non-response .. 11,515 2,782 3,701
Response rate 25.0 28.0 61.9 51.9
Source: Finnish Gambling 2019 population study
As in similar previous studies, the response rate was lower in the youngest than in the
oldest age groups. In 2019, the response rate dropped in all age groups compared to 2015,
most clearly among those aged 55 to 64. Unlike most surveys, in 2019 men participated in
the interviews more actively than women in almost all age groups (Table 2). Men's
response rate was also higher than women’s in 2015. It is possible that gambling is a topic
that motivates men to respond. The distribution of the response rate was also typical in
geographical terms: the rate was lower for respondents living in cities than for those living
in rural areas.
Table 2. Sample, respondents and response rates in different population groups
in 2019.
Sample Respondents Response rate
Total 7,695 3,994 51.9
Women 3,870 1,964 50.7
Men 3,825 2,030 53.1
Age group
15 to 24 1,135 441 38.9
25 to 34 1,279 562 43.9
35 to 44 1,229 584 47.5
45 to 54 1,245 684 54.9
55 to 64 1,435 805 56.1
65 to 74 1,372 918 66.9
Gender x age
Men aged 15 to 24 584 231 39.6
Women aged 15 to 24 551 210 38.1
Men aged 25 to 34 652 305 46.8
Women aged 25 to 34 627 257 41.0
Men aged 35 to 44 640 318 49.7
Women aged 35 to 44 589 266 45.2
Men aged 55 to 54 608 343 56.4
Women aged 55 to 54 637 341 53.5
Men aged 55 to 64 665 389 58.5
Women aged 55 to 64 770 416 54.0
Men aged 65 to 74 676 444 65.7
Women aged 65 to 74 696 474 68.1
Marital status
Single 3,372 1,450 43.0
Married or in a registered relationship 3,207 1,938 60.4
Divorced 939 502 53.5
Widow/er 176 103 58.5
26
THL – Statistical report 9/2020Finnish Gambling 2019
Sample Respondents Response rate
Region
Uusimaa 2,195 1,101 50.2
Southwest Finland 675 362 53.6
Satakunta 320 176 55.0
Kanta-Häme 240 114 47.5
Pirkanmaa 750 399 53.2
Päijät-Häme 295 164 55.6
Kymenlaakso 249 106 42.6
South Karelia 179 100 55.9
South Savo 210 89 42.4
North Savo 357 190 53.2
North Karelia 235 133 56.6
Central Finland 399 196 49.1
South Ostrobothnia 273 145 53.1
Ostrobothnia 244 141 57.8
Central Ostrobothnia 100 65 65.0
North Ostrobothnia 615 321 52.2
Kainuu 106 54 50.9
Lapland 253 138 54.5
Major region
Helsinki-Uusimaa 2,210 1,116 50.5
Southern Finland 1,632 840 51.5
Western Finland 1,976 1,047 53.0
Northern and Eastern Finland 1,877 991 52.8
Urban-rural classification
Inner urban area 2,530 1,260 49.8
Outer urban area 2,046 991 48.4
Peri-urban area 885 485 54.8
Local centres in rural areas 420 219 52.1
Rural areas close to
550 303 55.1
urban areas
Rural heartland areas 844 503 59.6
Sparsely populated rural areas 402 233 58.0
Education
At most basic education or not known 1,781 773 43.4
Secondary education 3,381 1,654 48.9
Lowest level tertiary education 763 495 64.9
Lower tertiary level 912 539 59.1
Higher tertiary level or doctorate 858 533 62.1
Source: Finnish Gambling 2019 population study
For detailed descriptions of the data for 2007, 2011 and 2015, see the basic reports for
each year (Aho & Turja 2007, Turja et al. 2012, Salonen & Raisamo 2015). In 2015, a lower
socio-economic status was associated with a lower response rate, which may cause bias
while studying the gambling behaviour of socio-economically vulnerable individuals
(Kontto et al. 2019). Significant challenges that undermine comparability were associated
with using the research data from 2003 (Ilkas & Turja 2003), and they were thus excluded.
The weighting of the research data is based on a calibration method, in which the
estimated distributions of selected variables are calibrated based on distributions in the
population. This method aims to reduce the bias caused by non-response and to improve
the efficiency of estimation.
27
THL – Statistical report 9/2020Finnish Gambling 2019
In the 2019 study, the age/gender distribution of the sampling frame (November 2019)
(age classes 15 to 19, 20 to 24, 25 to 34, 35 to 49, 50 to 64, 65 to 74) and regional
distributions (region, 18 classes, and urban/rural classification, 7 classes) were used to
calibrate the weights. Other factors potentially affecting the non-response rate, including
education and employment status, were not taken into account. Design weights were
calibrated using the CALMAR2 macro based on the raking ratio distance function. The
weight variations were restricted at the lower and upper end. The method used to
calculate the weights of the research data for 2007, 2011 and 2015 is described in the basic
reports for each year. For the respondents’ background information by respondent group,
see Table 3.
Table 3. Respondents by respondent group in 2019 (%)
Unweighted data Weighted data
n % n %
Total 3,994 100.0 3,994 100.0
Gender
Women 1,964 49.2 1,995 50.0
Men 2,030 50.8 1,994 50.0
Age group
15 to 17 144 3.6 176 4.4
18 to 24 297 7.4 395 9.9
25 to 34 562 14.1 647 16.2
35 to 44 584 14.6 623 15.6
45 to 54 684 17.1 679 17.0
55 to 64 805 20.2 743 18.6
65 to 74 918 23.0 731 18.3
Region
Uusimaa 1,101 27.6 1,159 29.0
Southwest Finland/Satakunta 538 13.5 512 12.8
Päijät-Häme/Kanta-Häme 278 7.0 276 6.9
Pirkanmaa 399 10.0 387 9.7
Central Finland 196 4.9 208 5.2
Kymenlaakso/South Karelia 206 5.2 220 5.5
South and North Savo/Northern
412 10.3 417 10.4
Karelia
Ostrobothnia, Central
Ostrobothnia, South 351 8.8 319 8.0
Ostrobothnia
North
513 12.8 496 12.4
Ostrobothnia/Kainuu/Lapland
Source: Finnish Gambling 2019 population study
Both calibrated expansion weights and analysis weights derived from them were formed
for the data. The calibrated expansion weights bring the data up to the level of the
population. The sum of the expansion weights corresponds to the size of the population
aged 15 to 74. In 2019, there were 3,722,323 people aged 15 to 74. The average of the
expansion weights, or 932, thus indicates the average number of persons each person in
the research data represents. The standard deviation of the expansion weights is 188 and
the range [582,1477]. The sum of analysis weights, on the other hand, equals the number
of respondents in the survey data. This gives the average of analysis weight of one. In 2019,
the standard deviation of the analysis weights was 0.20 and the range [0.62,1.58].
In order to enable cross-sectional comparisons, the research data for 2019 was combined
with an SPSS matrix containing the data for 2007, 2011 and 2015. To ensure that previous
28
THL – Statistical report 9/2020Finnish Gambling 2019
research data are consistent with the classifications used in the 2019 study, the variables
to be compared were merged and reclassified. The key indicators to be examined were
given uniform names.
The statistical analyses were mainly carried out using the SPSS program. Regional
analyses and the examination of gambling expenditure accumulation were produced
using the R program. To calculate the statistical significance of change over time (p), the
Chi-squared test was used to compare years 2007 and 2019, and 2015 and 2019. The
comparisons were mainly made at the population level. As an exception to this policy
should be mentioned the examination of gambling expenditure and the severity of
problem gambling by participation in gambling and game types gambled. Non-monopoly
gambling was only examined for this subgroup.
Validity and accuracy of data
The interview form was tested by researchers from Statistics Finland and the Finnish
Institute for Health and Welfare. The questionnaire is available in Finnish and Swedish on
the website of the Finnish Gambling study. The interviews were conducted by
approximately 130 trained interviewers from Statistics Finland. Self-study material, which
included instructions for conducting the study, the letters and the form were sent to the
interviewers. The interviewers participated in training on data collection and conducted
practice interviews in pairs. While the field work was in progress, the interviewers were e-
mailed every week with some additional instructions and more detailed operating
methods as well as information on the progress of the data collection and answers to
questions received from the interviewers.
The interviewers liaised with their immediate supervisors and data collection coordinators
to varying degrees. Based on these contacts, it appeared that the most challenging part
was finding telephone numbers and reaching respondents. Reaching respondents has
become more difficult year by year in all surveys. The interviewers noted that while the
media attention received by gambling at the beginning of the data collection period
seemed to increase interest in participation, as time went on, it also had the adverse effect.
The length of the interview also made attracting respondents challenging.
The 2019 interview data was checked by Statistics Finland and corrections were made to it.
The data sets were then reviewed by the Finnish Institute for Health and Welfare. The data
includes 14 interviews which, albeit they were interrupted, progressed to quite an
advanced point. Interrupted interviews have also been included in the data in previous
years.
Availability and transparency/clarity of data
The research data are available and openly accessible for researchers and the scientific
community in the Finnish Society Science Data Archive (FSD). Statistics Finland will submit
the 2019 data, excluding the register data linked to them, to FSD as soon as all the key
results of the study have been published. Personal data are not transferred to non-EU/EEA
countries. The privacy notice for scientific research used in 2019 can be found on the study
website.
Comparability of statistics
In order to ensure cross-sectional comparability, an effort was made to ensure that the
design and questions of the data collection remain as similar as possible throughout the
time series. The surveys of 2015 and 2019 were conducted in cooperation with Statistics
Finland, before which the data collection was carried out by Taloustutkimus. The
response rate has varied in different years: the highest rate was recorded in the data set
for 2015 (62%). In addition, the data for 2007 and 2015 were collected in the spring,
whereas the data for 2011 and 2019 were collected in autumn/winter. Any missing data in
the original sets have been substituted using slightly different methods, but efforts have
been made to harmonise these practices for the purposes of this report.
There was no upper age limit in the sample of 2007. In other years, the target population
has been those aged between 15 and 74 living in Mainland Finland (household population).
For 2007, only respondents aged between 15 and 74 were included in this statistical report.
29
THL – Statistical report 9/2020You can also read