Estimating the Prevalence of Autism Spectrum Conditions in Adults
←
→
Page content transcription
If your browser does not render page correctly, please read the page content below
Estimating the Prevalence of
Autism Spectrum
Conditions in Adults:
Extending the 2007 Adult Psychiatric
Morbidity Survey

Brugha T, Cooper SA, McManus S, Purdon S, Smith J, Scott FJ, Spiers N, Tyrer F

A survey carried out for The NHS Information Centre for Health and Social care by the University of
Leicester, the Leicestershire Partnership NHS Trust, the National Centre for Social Research, and
the University of Glasgow.

            Copyright © 2012, The Health and Social Care Information Centre. All Rights Reserved.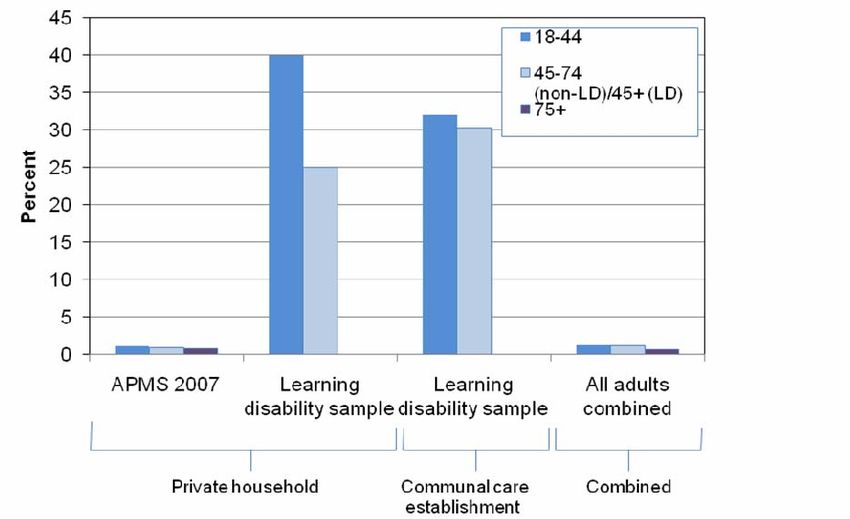
The NHS Information Centre is England’s central,
authoritative source of health and social care
information.

Acting as a ‘hub’ for high quality, national, comparative
data, we deliver information for local decision makers, to
improve the quality and efficiency of care.

www.ic.nhs.uk

Author: The NHS Information Centre, Community and Mental Health Team

Responsible Statistician: David Lloyd, Senior Service Manager; Prescribing & Primary Care
Services

Version: 1

Date of Publication: 31st January 2012

Acknowledgements
This study was funded by the Department of Health. The report and supporting documents were
published by The NHS Information Centre. The authors would like to thank them for their expert
steerage during the study. We also thank all participants, carers, managers and other staff for
generously giving their time to take part. The data collection was carried out by Jane Smith and
colleagues at the Department of Health Sciences, University of Leicester and the commentary was
prepared by Freya Tyrer (Research Fellow in Epidemiology, Department of Health Sciences,
University of Leicester). Dr Nicola Spiers (Research Fellow in Medical Statistics, Department of
Health Sciences, University of Leicester) conducted the statistical analysis.

 2           Copyright © 2012, The Health and Social Care Information Centre. All Rights Reserved.

Contents
Contents                                                                                                  3
Executive Summary                                                                                         5
Notes                                                                                                     7
1. Introduction                                                                                           8
 1.1.      Autism                                                                                     8
 1.2.      Background and existing evidence                                                           8
 1.3.      Aims and objectives of the study                                                           8

2. Study design and methods                                                                           10
 2.1.      Study participants                                                                     10
 2.1.1.    Sampling from private households                                                       10
 2.1.2.    Sampling from communal care establishments                                             11
 2.2.      Questionnaires and topic coverage                                                      12
 2.3.      Fieldwork procedures                                                                   13
 2.3.1.    Interviewers                                                                           13
 2.3.2.    Making contact                                                                         13
 2.4.      Survey response                                                                        14
 2.4.1.    Response for first interview                                                           14
 2.4.2.    Response for second interview                                                          15
 2.5.      Estimating autism prevalence among adults aged 18 years and over                       16
 2.5.1.    Calculation of combined prevalence estimates                                           16
 2.5.2.    Sensitivity analysis                                                                   16

3. Results                                                                                            18
 3.1.      Prevalence of autism among all adults aged 18 years and over                           18
 3.2.      Autism in private households and communal care establishments                          19
 3.3.      Autism by age, sex and site in private households and communal care establishments 21
 3.4.      Autism by other characteristics                                                        23
 3.4.1.    Ethnicity                                                                              23
 3.4.2.    Predicted verbal IQ and severity of learning disability                                24
 3.5.      Sensitivity analyses                                                                   25
 3.6.      Validation study                                                                       26

4. Discussion                                                                                         27
5. Conclusion                                                                                         28
6. References                                                                                         29

          Copyright © 2012, The Health and Social Care Information Centre. All Rights Reserved.   3
Supporting documents
Reference data tables                                         www.ic.nhs.uk/pubs/autism11

Data quality and methodology document                         www.ic.nhs.uk/pubs/autism11

Appendices                                                    www.ic.nhs.uk/pubs/autism11

 4      Copyright © 2012, The Health and Social Care Information Centre. All Rights Reserved.
Executive Summary
This report, “Estimating the prevalence of autism in adults: Extending the 2007 Adult Psychiatric
Morbidity Survey”, presents the prevalence of autism among adults aged 18 years and over. Data
from the 2007 Adult Psychiatric Morbidity Survey (APMS 2007)1 has been combined with data from a
new study of the prevalence of autism among adults with learning disabilities living in private
households and communal care establishments in Leicestershire, Lambeth and Sheffield. For this
latter study, 290 adults were recruited between August 2010 and April 2011. The overall response
rate for the new survey was 20 per cent in private households (83 interviews). Sixty four per cent of
communal care establishments approached took part in the study. Among these, the response rate
for individual participants was 69 per cent (207 interviews).

The study comprised a relatively small sample with limited geographical coverage and did not include
other institutional populations, such as prisons; the strength of the national level conclusions about
the learning disabled population is limited by this. However, sensitivity analysis showed that the
figures for overall national prevalence of autism were relatively insensitive to any inaccuracies
caused by these limitations. This study does however include people in communal care
establishments and people with learning disabilities, two non-mutually exclusive populations which
were not covered by the APMS 2007.

People with learning disabilities are a key group to study because they could not take part in the
APMS 2007 and have been found to have an increased risk of autism. This is important because in
order to improve the lives of people with autism, there is a need to be able to estimate the number of
people with this condition.

The original intention of this study was to carry out interviews in three geographical areas with
differing demographic profiles. In combination these three areas are a reasonable match for the
national profile however it proved difficult to achieve the intended number of interviews in Lambeth
and Sheffield. This resulted in a final sample which over represented patients of South Asian
ethnicity. Although there is no known link between Autism and ethnicity there is equally no evidence
that the reverse is true.

Key facts
   •   The overall prevalence of autism, combining data from the APMS 200712 and learning
       disability study, was 1.1 per cent (95 per cent confidence interval 0.3 per cent to 1.9 per cent).
           o The prevalence of autism was higher in men (2.0 per cent) than women (0.3 per cent).
   •   In the learning disability study it was found that the prevalence of autism increased with
       greater severity of learning disability/lower verbal IQ.
   •   Among adults with learning disabilities living in private households whose learning disability
       was sufficiently severe that they could not have taken part in the APMS 200712, the
       prevalence of autism was 35.4 per cent (95 per cent confidence interval 24.7 per cent to 46.2
       per cent). Among adults with mild or severe learning disabilities living in communal care
       establishments, the prevalence of autism was 31.0 per cent (95 per cent confidence interval
       23.9 per cent to 38.0 per cent).
           o Sex differences were less marked in adults with learning disabilities compared with the
                rest of the general population (APMS 200712).

   1
    Brugha T, McManus S, Meltzer H, Smith J, Scott FJ, Purdon S, Harris J, Bankart J. Autism
   Spectrum Disorders in adults living in households throughout England. Report from the Adult
   Psychiatric Morbidity Survey 2007. England: The NHS Information Centre for health and social
   care, 2009.

         Copyright © 2012, The Health and Social Care Information Centre. All Rights Reserved.    5
•   The estimated prevalence of autism changed very little when the data were re-analysed to
         take into account that the prevalence of autism might be higher or lower in other settings,
         such as prisons or defence establishments. Using assumptions based on different scenarios
         to take these into account, the overall prevalence of autism was estimated at between 1.1 per
         cent and 1.2 per cent.

This study has demonstrated that autism is common among people with a learning disability, whether
they live in communal care establishments or in private households. This fact is important for service
planning and provision. Taking account of the higher rate of autism present among people with
learning disability means that our best estimate of the overall prevalence of autism in England is 1.1
per cent. This compares with a previous estimate of 1.0 per cent in the APMS (2007).

 6           Copyright © 2012, The Health and Social Care Information Centre. All Rights Reserved.
Notes
1. The prevalence of autism in this report is presented as percentages to one decimal place, which
is equivalent to reporting rates per thousand.
2. The following conventions have been used in tables:
- no observations (zero value)
3. Row or column percentages may not add exactly to 100 per cent due to rounding.
4. A percentage may be quoted in the text for a single category that combines two or more of the
percentages shown in a table. The percentage for a single category may, because of rounding,
differ from the sum of the percentages in the table.
5. In general, missing values have been omitted from the tables and analyses. Missing values
occur for a number of reasons, including refusal or inability to answer a particular question.
6. The term ‘significant’ refers to statistical significance. Unless otherwise stated, any reported
differences have been found to be statistically significant at the 5 per cent level (i.e. p1. Introduction 1.1. Autism Autism, including childhood autism and Asperger syndrome, is a neurodevelopmental disorder. Childhood autism and Asperger syndrome were first described in the 1940s2-4 and now fall within the concept of a broader spectrum of autism5-6. Since the 1960s, there appears to have been a steady increase in the number of children with autism7-11, believed to be a result of improved diagnostic methods, widening of diagnostic criteria, less stigmatisation of the condition and increased awareness from health professionals and families 8. 1.2. Background and existing evidence In March 2010, the then Government published a new national strategy for autism and guidance for the condition1, with the view to improving the quality of services provided to adults with autism in England. Such improvements can only be achieved if the number of people with recognised and unrecognised autism in the general population is quantified. The most recent population-based Adult Psychiatric Morbidity Survey (APMS 2007) set out to determine the prevalence of autism among adults living in private households in England12. The prevalence of autism had never previously been studied in the general population. The survey involved 7,403 adults living in private households in England. Adults were interviewed with between two and four validated autism questionnaires: the AQ-20 (A 20-item version of the Autism-Spectrum Quotient or AQ13), the Autism Diagnostic Observations Schedule Module 4 (ADOS-4)14, the Diagnostic Interview for Social and Communication Disorders (DISCO)15 and the Autism Diagnostic Interview Revised (ADI-R)16 together with a clinical consensus judgement procedure. The case definition of autism was based on an ADOS-4 score of 10 or greater and was validated against 56 DISCO and ADI-R assessments along with a consensus exercise involving six clinicians experienced in assessing adults with possible autism17. Results from the APMS 2007 revealed an overall prevalence of 1.0 per cent (95 per cent CI 0.3 per cent to 1.7 per cent) for autism in adults12,18. There were two limitations to the APMS 200712 in relation to the measurement of autism. First, the prevalence of 1.0 per cent for autism was based on adults who were living in private households. It is likely that autism is more prevalent in some populations that were not sampled in the household survey. For example, people who live in communal care establishments, such as residential homes and nursing homes, and those in other communal establishments, such as prisons, have been found to have a higher prevalence of autism19,20. Secondly, people with learning disabilities (defined by a significant intellectual impairment with onset before adulthood and deficits in skills needed for daily functioning21-23) could not take part in the APMS 2007 because the consent forms, questionnaires and assessments were designed for people with full decision-making capacity. This group has an increased risk of autism; current evidence suggests that the prevalence of autism in adults with learning disabilities is between 7 per cent and 20 per cent24,25, perhaps higher still among those in residential homes26. Therefore the published APMS 2007 estimated prevalence of autism that covered adults in private households was likely to be an underestimate for the population as a whole. It is important to know about any variations in this population because it will substantially impact on service requirements for people with learning disabilities. It may also have an impact on the estimate of prevalence of autism for the total population. 1.3. Aims and objectives of the study The aim of the current study was to extend the existing prevalence estimate of autism in adults to include adults with learning disabilities. The objectives of the current study were: 8 Copyright © 2012, The Health and Social Care Information Centre. All Rights Reserved.
i.   To identify a representative group of adults with learning disabilities (in terms of age, sex, and
     place of residence) who were either: (a) living in private households but not able to participate
     in the APMS 200712 due to learning disability; or (b) living in communal care establishments
     and thus not included in the APMS 2007 sample.
ii. To interview the adults with learning disabilities living in private households who would not
     have been able to participate in the APMS 200712 with the validated clinical assessment
     ADOS-114, to determine the prevalence of autism in this population.
iii. To interview the adults with learning disabilities living in communal care establishments with
     the validated clinical assessment ADOS-1 or ADOS-414, to determine the prevalence of
     autism in this population.
iv. To interview a sub-sample of adults with learning disabilities with the clinical assessments,
     DISCO15 and ADI-R16, to calibrate the ADOS-114.
v. To combine the estimated prevalence rates of autism in adults with learning disabilities who
     live in private households and who live in communal care establishments with the prevalence
     of autism in adults without learning disabilities living in private households (from the APMS
     200712) and communal care establishments (extrapolated) to derive an overall prevalence
     estimate for autism in adults.
vi. To perform sensitivity analyses of the combined prevalence estimate to take into account
     adults without learning disability who live in communal care establishments.

      Copyright © 2012, The Health and Social Care Information Centre. All Rights Reserved.      9
2. Study design and methods
2.1. Study participants
Participants for this study were sampled from selected regional learning disability case registers in
England living in both private households and communal care establishments. Three learning
disability registers located in Leicestershire, Lambeth, and Sheffield, were used as the sampling
frames (populations from which the samples were drawn). The adult prevalence of learning
disabilities using the registers at the three sites was within the expected range (4.9, 4.3, and 5.4 per
thousand of the population of Leicestershire, Lambeth and Sheffield respectively30); these registers
have been used extensively for research27-29. Potential participants were sampled in June 2010
(Leicestershire), November 2010 (Lambeth) and January 2011 (Sheffield). Data collection took place
between August 2010 and April 2011.
Inclusion Criteria
(i) All adults (aged 18+ years) who lived in private households (e.g. independently, with family, in
supported living accommodation) who would not have been able to participate in a survey
interview owing to communication difficulties/lack of capacity to decide whether to participate
(ii) All adults (aged 18+ years) with learning disabilities who lived in communal care
establishments (e.g. residential homes, nursing homes)
Exclusion Criteria
(i) Participants who lacked capacity and whose carers could not speak English (since all
assessments were validated in the English language only)
(ii) More able participants (i.e. eligible for the ADOS-4) in communal care establishments who
could not understand or speak English (since all assessments were validated in the English
language only)
(iii) Participants who were in communal care establishments in Leicestershire and Sheffield with
fewer than four residents with learning disabilities, and participants in communal care
establishments in Lambeth with fewer than three residents with learning disabilities (owing to
an insufficient number of establishments with four or more residents in the Lambeth borough) –
see Section 2.1.2 for more details.
A sample of 500 from the three areas in Leicestershire, Lambeth, and Sheffield was chosen for this
study. From these set samples, three-fifths of the set sample (300 participants) was chosen from
Leicestershire and one fifth each from Lambeth and Sheffield (100 participants each). A larger
sample was selected from Leicestershire due to the higher expected response rate and resource
implications (research interviewers were all based in Leicestershire).
2.1.1. Sampling from private households
A random sample of participants from private households was selected, stratified by age, sex and
type of residence. In addition, at the request of the Lambeth local authority lead, adults who were
sampled but who had profound and multiple learning disabilities were not invited to take part in this
study (4 people from private households and 13 from communal care establishments).
Adults from private households were only eligible for the study if they could not have taken part in the
APMS 200712. Interviewers initially made this judgement over the telephone and again when visiting
the potential participant in their own home (if they had not already been excluded following the initial
telephone conversation). Participants were excluded if they were judged to be sufficiently able to
have taken part in the APMS 2007.
10 Copyright © 2012, The Health and Social Care Information Centre. All Rights Reserved.2.1.2. Sampling from communal care establishments
For Leicestershire and Sheffield, the study adopted a two stage sampling design for communal care
establishments. The first stage involved randomly selecting establishments with four or more
residents, with selection probabilities proportional to the number of eligible residents. The second
stage involved randomly selecting 4 participants from each of the chosen communal care
establishments stratified by sex and age. For Lambeth, which had fewer communal care
establishments, all establishments with 3 or more residents were chosen and all residents were
sampled.
This strategy aimed to reduce the burden on establishment managers and allowed sufficient time to
obtain the necessary permission for the research team to carry out the interviews.
Copyright © 2012, The Health and Social Care Information Centre. All Rights Reserved. 112.2. Questionnaires and topic coverage
Table 2A: Questionnaires and assessments used in the study
Target Completed
Name of Assessment/ Target Individuals Number Assessments
Questionnaire N* (per cent) N* (per cent)
Autism Diagnostic Observations All participants 500 (100) 290 (100)
Schedule (ADOS)14
Module 1 239 (82)
Module 4 37 (13)
Not assessable 14 (5)
31
Vineland II caregiver rating form All participants 500 (100) 278 (96)
Modified APMS All participants 500 (100) 290 (100)
Diagnostic Interview for Social Random 60 participants who 60 (12) 58 (20)
and Communication Disorders score high (n=30) and low
(DISCO)15 (n=30) in the ADOS14.
Autism Diagnostic Interview- Random 60 participants who 60 (12) 58 (20)
Revised (ADI-R)16 score high (n=30) and low
(n=30) in the ADOS14.
* N = Number
Table 2A shows a summary of questionnaires and assessment measures used. At first interview, all
participants were assessed with the ADOS-1 or ADOS-414. The ADOS-1 is designed for individuals
who do not consistently use phrase speech and was applicable for the majority of adults who took
part in this study. The ADOS-4 is designed for verbally fluent adults and was sometimes appropriate
for those in communal care establishments (adults in private households were not assessed with the
ADOS-4 as they would have been sufficiently able to take part in the APMS 200712). A threshold
score of 12+ in the ADOS-1 and 10+ in the ADOS-4 was use to define an autism case.
Carers were also asked to complete the Vineland II caregiver rating form31 to give a measure of the
severity of the participant’s learning disability and a semi-structured questionnaire comprising key
questions from the APMS 200712 and some additional questions relevant to this client group (see
supporting appendices for a copy of the questionnaire and show cards).
A random sample of 30 carers of individuals who scored high in the ADOS-1 (≥7) 14 and a random
sample of 30 carers of individuals who scored low in the ADOS-1 (2.3. Fieldwork procedures
2.3.1. Interviewers
Fieldwork was carried out between August 2010 and April 2011 by research interviewers at the
University of Leicester. Interviews comprised a structured assessment with ADOS-1 or ADOS-414,
the Vineland Adaptive Behaviour Scales (Vineland II) caregiver rating form31 and a modified version
of the APMS 2007 questionnaire12.
Interviews with primary caregivers for the DISCO15 and ADI-R16 validation study were carried out by a
senior research psychologist who had also conducted the DISCO and ADI-R interviews for the APMS
200712.
2.3.2. Making contact
Participants, carers or managers were sent a letter of invitation, a care information sheet, a
‘participant easy read’ information sheet and consent form, and a copy of the Vineland II caregiver
rating form31. Potential participants in Lambeth and Sheffield were also sent an invitation card (see
supporting appendices for relevant fieldwork documents)
Participants in Leicestershire were telephoned by the research team unless they contacted the
research team in receipt of the advance letter to say that they did not wish to participate in the study.
Carers and participants in Lambeth and Sheffield contacted the research team if they wished to take
part in the study.
Copyright © 2012, The Health and Social Care Information Centre. All Rights Reserved. 132.4. Survey response
2.4.1. Response for first interview
290 interviews were carried out with participants and their carers; 246 adults from Leicestershire, 34
adults from Lambeth and 10 adults from Sheffield.
Table 2B: Response rate for first interviews with adults living in private households and
communal care establishments
Learning disability APMS
study 2007
(per (per
Private households N* N*
cent) cent)
Leicestershire
Eligible individuals approached 223 (100) -
Interviews 78 (35) -
All sites
Eligible individuals approached 410 (100) 13,171 (100)
Interviews 83 (20) 7,461* (57)
Communal care establishments
Leicestershire
Eligible establishments approached 65 (100) -
Participating establishments 58 (89) -
Eligible individuals approached from participating
221 (100) -
establishments
Interviews 168 (76) -
All sites
Eligible establishments approached 118 (100) -
Participating establishments 75 (64) -
Eligible individuals approached from participating
300 (100) -
establishments
Interviews 207 (69) -
* 58 interviews were proxy interviews (reasons for proxy were not systematically recorded), and 129 interviews were with
participants aged 16 and 17 years and were excluded from the autism study. Hence N=7274 is quoted elsewhere in this
report.
N = Number.
Data source: Tables 1a and 1b from the supporting reference data tables.
Table 2B shows the response rates for first interviews in private households and communal care
establishments.
As expected, response rates were much higher in Leicestershire under the opt-out procedure (see
ethical approval section in supporting data quality and methodology document) than for Lambeth and
Sheffield.
Response rates were higher in communal care establishments. Very few family carers of adults
living in private households in Lambeth and Sheffield responded, which highlights the difficulties in
adopting opt-in procedures for prevalence studies. In Leicestershire, we found that many family
carers had a lifetime of caring behind them, were elderly or weary and simply did not have the
additional energy to take part in a research study. They had also been overwhelmed by calls about
the television switchover to digital, which was being offered free of charge to people with learning
14 Copyright © 2012, The Health and Social Care Information Centre. All Rights Reserved.disabilities during the study time period. In addition, we found that we could not contact a significant
proportion (15 per cent) of individuals.
The characteristics of participants compared with the learning disability registers are shown in the
supporting data quality and methodology document. In Leicestershire, the age, sex and ethnicity
profile of adults who took part in the study was similar to those on the Leicestershire Learning
Disability Register. In Lambeth, the age profile was similar, but more women were interviewed than
expected (65 per cent vs. 44 per cent expected) (see Table 9b of the supporting reference data
tables). Numbers were too small in Sheffield to report. Table 2B includes 14 participants for whom
an interview was completed, but who were classified as not assessable on the ADOS-1. These
individuals were excluded from the data analysis.
2.4.2. Response for second interview
60 carers were approached to take part in a second interview with the DISCO15 and ADI-R16 to
validate the ADOS-1 assessments14 used for the prevalence estimate (the ADOS-4 assessment was
validated as part of the APMS 200712,17).
Table 2C: Response rate for second interviews with DISCO and ADI-R to validate ADOS-1
assessments and response rates for APMS 2007 12 validation of ADOS-4 assessments
Learning disability APMS
study 2007
All sites N* (per cent) N* (per cent)
Set sample of adults 60 (100) 60 (100)
No contact 2 (3) 4 (7)
Total interviews carried out 58 (97) 56 (93)
* N = Number
Data source: Table 1c from the supporting reference data tables
A total of 58 carers were contactable and agreed to take part (Table 2C). More than half (53 per
cent) of interviews were carried out with parents (N=21; 36 per cent) or other relatives (N=10; 17 per
cent). The remaining interviews (N=27; 47 per cent) were carried out with paid carers (see Table 1d
of the supporting reference data tables).
Copyright © 2012, The Health and Social Care Information Centre. All Rights Reserved. 152.5. Estimating autism prevalence among adults aged 18
years and over
2.5.1. Calculation of combined prevalence estimates
Overall prevalence estimates for autism were calculated by combining results from the APMS 2007 12
with results from the learning disability study of adults in private households and communal care
establishments. People aged 16 and 17 years from the APMS 2007 were excluded prior to combining
the estimates.
Figure 2A: Calculation of combined autism prevalence estimate
The first stage of the data analysis was to estimate prevalence of autism in those with learning
disability, from the learning disability sample. Next, this sample was combined with the assessments
of autism from the APMS 2007 12, to estimate the overall prevalence of autism in the entire
population aged 18 years and over (Figure 2A). Please refer to the supporting data quality and
methodology document for more details.
2.5.2. Sensitivity analysis
In order to estimate the overall prevalence of autism in adults aged 18 years or over, it was
necessary to combine data from different sources to build a picture of the population by age, sex,
type of residence, and learning disability. This calculation involved a number of assumptions.
Source data included the most recent census data available (2001). Since then, a significant
proportion of people have moved out of long-stay hospitals and into community settings in line with
policy directives. Sources also included information on the prevalence of learning disability from the
case registers, giving an incomplete picture nationally. Since no observations were made of autism
prevalence in the majority of the population in communal establishments who were not on the
learning disabilities case registers, it was necessary to assume autism prevalence for this group.
16 Copyright © 2012, The Health and Social Care Information Centre. All Rights Reserved.In order to explore the effect of our assumptions on the final results, we carried out a sensitivity
analysis. This involved looking at the effect of the overall prevalence of autism if the prevalence were
different in three key areas: (i) among adults with learning disabilities nationally; (ii) among adults
living in communal care establishments; (iii) among adults living in other communal establishments,
such as defence, prison or educational establishments. We re-calculated the prevalence rate, using
plausible upper and lower limits for the prevalence in these different settings to see how this affected
the overall prevalence of autism.
Please refer to the supporting data quality and methodology document for more information on the
sensitivity analysis.
Copyright © 2012, The Health and Social Care Information Centre. All Rights Reserved. 173. Results
3.1. Prevalence of autism among all adults aged 18 years and
over
The overall prevalence of autism, combining the APMS 200712 and the learning disability study, using
a threshold score of 12 or more on the ADOS-1 and 10 or more on the ADOS-4 to indicate a positive
case, was 1.1 per cent (95 per cent confidence interval 0.3 per cent to 1.9 per cent) (Table 3B). This
represents approximately 450,000 adult cases of autism nationally.
Calculation of overall prevalence involved assumptions about the overall prevalence of learning
disability, and the proportion of people resident in communal care establishments, defence, prison
and educational establishments, and their corresponding autism prevalence. The sensitivity analysis
showed that varying these assumptions did not affect the results substantially.
The prevalence of autism among adults living in private households with learning disabilities sufficient
to have excluded them from the APMS 200712 was 35.4 per cent (95 per cent confidence interval
24.7 per cent to 46.2 per cent). Among adults with learning disabilities living in communal care
establishments, autism prevalence was 31.0 per cent (95 per cent confidence interval 23.9 per cent
to 38.0 per cent). A total of 89 cases were identified in the learning disability samples (Table 3B).
18 Copyright © 2012, The Health and Social Care Information Centre. All Rights Reserved.3.2. Autism in private households and communal care
establishments
One of the criteria for exclusion from private households was where participants would have been
able to take part in the APMS 200712. We would therefore expect to observe a difference in autism
prevalence between adults living in private households and communal care establishments, as
people with severe and profound learning disabilities (by implication more prevalent in the private
household sample) have been found to have a greater prevalence of autism25.
Table 3A: Severity of learning disability* among adults with learning disabilities living
in private households and communal care establishments included in the sample
Private Communal care
households establishments
Learning disability severity* N (per cent) N (per cent)
Total 77† (100) 187† (100)
Borderline/Mild 9 (12) 38 (20)
Moderate 9 (12) 25 (13)
Severe 23 (30) 35 (19)
Profound 36 (47) 89 (48)
31
* measured using the Vineland II caregiver rating form
†
excludes 2 people with missing severity data in private households and 10 people in communal care
establishments; 14 people could not be assessed with the ADOS-1 (all had profound learning disabilities).
Data source: Table 1e from the supporting reference data tables
Table 3A shows learning disability severity by type of accommodation. As expected, a smaller
proportion of adults assessed in private households had mild learning disabilities, as people living in
private households were excluded if they could have taken part in the APMS 200712. The majority of
adults (77 per cent in private households and 66 per cent in communal care establishments) had
severe or profound learning disabilities.
Copyright © 2012, The Health and Social Care Information Centre. All Rights Reserved. 19Table 3B: Prevalence of autism (ADOS-1 12+, ADOS-4 10+) in Leicestershire and in the
entire sample in private households/communal care establishments
Number of Prevalence
participants per cent
Adults with learning disabilities* in Leicestershire (N=237)
Private households 74 36.5
Communal care establishments 163 30.1
Adults with learning disabilities* all sites (N=276†)
Private households 79 35.4
Communal care establishment 197 31.0
Adults in England in private households (N=7274)
All 1.0
All adults (N=7550‡)
All 1.1‡
* Private households: learning disability sufficient to exclude from the APMS 200712
Communal care establishments: all on case register
†
This total excludes 14 individuals who could not be assessed with the ADOS-1.
‡
Reweighted estimate to represent the English population age 18 and over by age, sex and residence. Adults
resident in communal care establishments with no learning disabilities are assumed to have prevalence of autism
identical to adults without learning disabilities in private households.
Data source: Table 2 from the supporting reference data tables.
Table 3B shows the prevalence of autism among adults with learning disability living in private
households and communal care establishments. As expected, the rate was higher among adults in
private households because they had more severe learning disabilities.
20 Copyright © 2012, The Health and Social Care Information Centre. All Rights Reserved.3.3. Autism by age, sex and site in private households and
communal care establishments
In the combined prevalence estimate, the rate of autism among men (2.0 per cent) was higher than
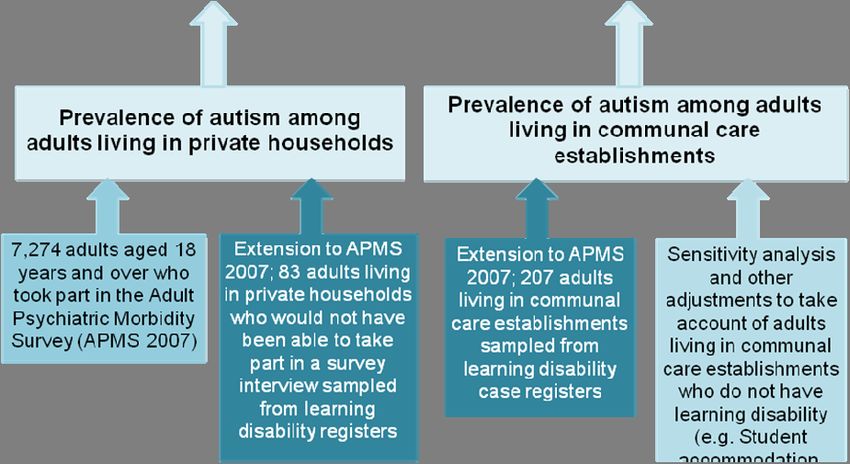
among women (0.3 per cent), the difference being statistically significant (pFigure 3B: Prevalence of autism (ADOS-1 12+, ADOS-4 10+) by age and type of residence (private household/communal care establishment) Data source: Table 3 from the supporting reference data tables. The prevalence of autism reported from the APMS 200712 was presented in wide age bands in order to address the small number of positive cases in the sample. For consistency and comparisons, ages have been grouped in the same way. Due to the presence of small numbers of assessed participants aged 75 years and over in the learning disability sample (n=4), these were combined with those aged 45-74 years (Figure 3B). 22 Copyright © 2012, The Health and Social Care Information Centre. All Rights Reserved.
3.4. Autism by other characteristics

3.4.1. Ethnicity
The majority of adults interviewed for this study were of white ethnic origin. As numbers were small in
the other ethnic categories, prevalence is only reported for those of White and South Asian origin.

Figure 3C: Prevalence of autism (ADOS-1 12+, ADOS-4 10+) among adults (combined sample)
and among adults with learning disabilities, by ethnicity

Data source: Table 4a from the supporting reference data tables.

Figure 3C shows the prevalence of autism by ethnic origin for the learning disability sample and the
combined general population sample. Overall autism prevalence was 1.2 per cent in Whites and 0.8
per cent in those of South Asian origin, with no statistically significant difference in prevalence by
ethnic origin.

         Copyright © 2012, The Health and Social Care Information Centre. All Rights Reserved.   23
3.4.2. Predicted verbal IQ and severity of learning disability Predicted verbal IQ was collected in the APMS 200712 and was combined with severity of learning disability for the current study in order to assess any differences in autism prevalence. Figure 3D: Prevalence of autism (ADOS-1 12+, ADOS-4 10+) among men and women (combined sample) by predicted verbal IQ/learning disability severity. Bord LD = Borderline LD Data source: Table 4b from the supporting reference data tables. Figure 3D shows the prevalence of autism by sex and severity of learning disability/predicted verbal IQ from the combined sample. There is a clear gradient in autism prevalence, with highest prevalence among those with the most severe intellectual ability. 24 Copyright © 2012, The Health and Social Care Information Centre. All Rights Reserved.
3.5. Sensitivity analyses
The sensitivity analysis involved recalculating the prevalence of autism, taking into account plausible
extreme upper and lower limits for this prevalence in settings that were not studied such as prisons
and student accommodation, to see whether this affected the overall prevalence of autism (see
Section 2.5.2). The choice of extreme upper and lower limits was based on the available literature,
but was to some extent arbitrary. This is particularly relevant for the prison population, given the lack
of evidence on autism prevalence in this setting. The supporting data quality and methodology
document provides more information on the process of plausible limit selection.

Using the lower limits, the overall prevalence of autism was estimated at 1.1 per cent. Using the
higher limits, the prevalence of autism was estimated at 1.2 per cent (see Table 8b in the supporting
reference data tables). This suggests that uncertainty in the overall estimate attributable to the
assumptions made in the calculation was minor compared to uncertainty owing to sampling variation
in the two studies, indicated by the width of the confidence intervals (see glossary in supporting
appendices). More details of the sensitivity analysis are provided in the supporting data quality and
methodology document.

         Copyright © 2012, The Health and Social Care Information Centre. All Rights Reserved.    25
3.6. Validation study
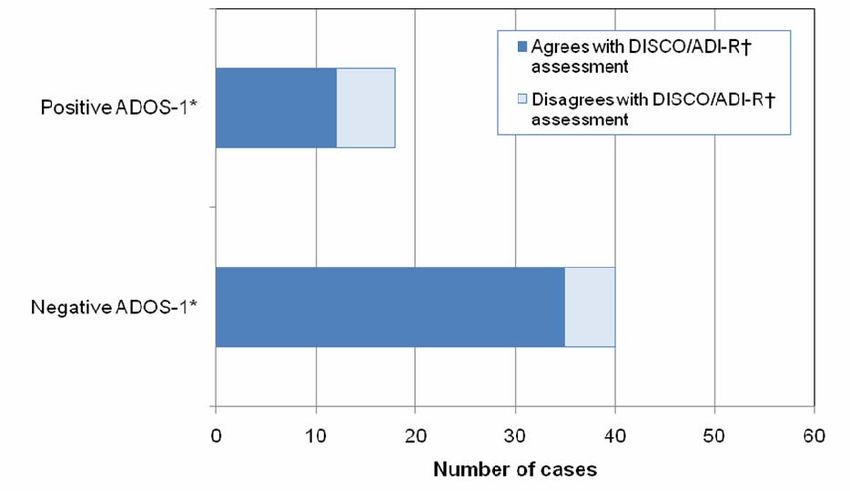
Of the 58 people taking part in the validation study, a total of 18 positive autism cases were identified
using both the DISCO15 and ADI-R16 (agreement was 100 per cent between the two interviews).
Figure 3E: Comparison of DISCO/ADI-R interviews and ADOS-1 assessments
*
ADOS-1
=
Autism
14
Diagnostic Observations Schedule (module 1) . Positive cases were identified using an ADOS-1 threshold score ≥12.
15
† Autism diagnoses were determined using the Diagnostic Interview for Social and Communication Disorders (DISCO)
16
and Autism Diagnostic Interview – Revised (ADI-R)
Data source: Table 5 from supporting reference data tables.
Figure 3E shows how the ADOS-114 compared with the identified positive autism cases. Twelve of
the eighteen positive autism cases had a threshold score of 12 or more in the ADOS-1. In other
words, the sensitivity of the ADOS-1 for detecting autism in this study was found to be 67 per cent.
Similarly, 35 of the 40 negative cases for autism (as measured using the DISCO/ADI-R) had a score
of 11 or below in the ADOS-1. In other words, the specificity of the ADOS-1 for detecting autism was
88 per cent. In total, 47 of 58 individuals were correctly identified as having/not having autism using
the ADOS-1, giving 81 per cent accuracy. This is comparable to the APMS 2007 validation study of
the ADOS-4 where 49 of 56 (88 per cent) were correctly identified as having/not having autism using
the ADOS-4 threshold of 10 or more17. However, sensitivity was much higher in the latter study (100
per cent), which suggests that the ADOS may not be as accurate in the learning disability population.
26 Copyright © 2012, The Health and Social Care Information Centre. All Rights Reserved.4. Discussion
In the APMS 200712, the overall prevalence of autism in adults was 1.0 per cent (95 per cent
confidence interval 0.3 per cent to 1.7 per cent). By extending the survey to include adults with
learning disabilities in private households who could not have taken part in the original survey and
adults with learning disabilities in communal care establishments, the prevalence estimate increased
to 1.1 per cent (95 per cent confidence interval 0.3 per cent to 1.9 per cent).
The prevalence of autism was calculated among adults living in private households and among
adults with learning disabilities in communal care establishments. Adults living in communal care
establishments who did not have learning disabilities and adults living in other communal
establishments were not included in this study. However, a sensitivity analysis, exploring the effect
on the overall prevalence of autism allowing for higher and lower prevalence in these settings
revealed very little change in the overall estimate.
Combined prevalence rates of autism were higher in men than women, a result that is consistent with
the APMS 200712; however, differences between the sexes were less apparent when the sample was
limited to adults with learning disabilities in both private households and communal care
establishments. No association in the prevalence of autism with age was found in people with
learning disabilities, which is also consistent with the APMS 2007. However, the sample size within
each age group was too small to draw robust statistical conclusions relating to age differences.
We found a steady increase in the prevalence of autism as a person’s level of intellectual functioning
decreased, which is in line with previous learning disability studies24, 25 and the general population12.
We also found that some adults’ learning disabilities were so profound that they could not be
assessed for autism. Given that an autism diagnosis can have little bearing on the support that these
individuals receive it is arguable whether such a diagnosis is beneficial.
The population from which the learning disability sample was drawn is known to have a higher
proportion of ethnic minorities than in England as a whole. On limiting the study to the white
population only, the prevalence estimate did not change significantly (1.2 per cent; 95 per cent
confidence interval 0.0 per cent to 2.1 per cent).
Copyright © 2012, The Health and Social Care Information Centre. All Rights Reserved. 275. Conclusion This study has demonstrated that autism is common among people with a learning disability, whether they live in communal care establishments or in private households. This fact is important for service planning and provision. Taking account of the higher rate of autism present among people with learning disability means that our best estimate of the overall prevalence of autism in England is 1.1 per cent. In other words, just over one in 100 adults in the population have autism. This revised rate replaces the previous estimate of 1.0 per cent. 28 Copyright © 2012, The Health and Social Care Information Centre. All Rights Reserved.
6. References
 1. Department of Health. Fulfilling and rewarding lives: the strategy for adults with autism in
    England. London: Department of Health, 2010

 2. Asperger H. Die 'Autistischen Psychopathen' im Kindesalter. Archiv fur Psychiatrie und
    Nervenkrankheiten 1944;117:76-136

 3. Frith U. Autism and Asperger Syndrome. Cambridge: Cambridge University Press, 1991.

 4. Kanner L. Autistic Disturbances of Affective Contact. Nervous Child 1943;2:217-50.

 5. Gillberg C, Grufman M, Persson E, Themner U. Psychiatric disorders in mildly and severely
    mentally retarded urban children and adolescents: epidemiological aspects. British Journal of
    Psychiatry 1986;149:68-74.

 6. Wing L, Gould J. Severe impairments of social interaction and associated abnormalities in
    children: epidemiology and classification. Journal of Autism and Developmental Disorders
    1979;9:11-29.

 7. Baird G, Simonoff E, Pickles A, Chandler S, Loucas T, Meldrum D, Charman T. Prevalence of
    disorders of the autism spectrum in a population cohort of children in the South Thames: the
    special needs and autism project (SNAP). Lancet 2006;368:210-15.

 8. Baron-Cohen S, Scott FJ, Allison C, Wiilliams J, Bolton P, Matthews FE, Brayne C.
    Prevalence of autism-spectrum conditions: UK school-based population study British Journal
    of Psychiatry 2009;194:500-09.

 9. Filipek PA, Accardo PJ, Baranek GT, Cook EH Jr, Dawson G, Gordon B, Gravel JS, Johnson
    CP, Kallen RJ, Levy SE, Minshew NJ, Ozonoff S, Prizant BM, Rapin I, Rogers SJ, Stone WL,
    Teplin S, Tuchman RF, Volkmar FR. The screening and diagnosis of autistic spectrum
    disorders. Journal of Autism and Developmental Disorders 1999;29:439-84.

 10. Fombonne E. The epidemiology of autism: a review. Psychological Medicine 1999;29:76-86.

 11. National Audit Office. Supporting people with autism through adulthood. London: NAO, 2009.

 12. Brugha T, McManus S, Meltzer H, Smith J, Scott FJ, Purdon S, Harris J, Bankart J. Autism
     Spectrum Disorders in adults living in households throughout England. Report from the Adult
     Psychiatric Morbidity Survey 2007. England: The NHS Information Centre for health and
     social care, 2009.

 13. Baron-Cohen S, Wheelwright S, Skinner R, Martin J, Clubley E. The autism-spectrum
     quotient (AQ): evidence from Asperger syndrome/high-functioning autism, males and
     females, scientists and mathematicians. Journal of Autism and Developmental Disorders
     2001;31:5-17.

 14. Lord C, Risi S, Lambrecht L, Cook EH Jr, Leventhal BL, DiLavore PC, Pickles A, Rutter M.
     The autism diagnostic observations schedule – generic: a standard measure of social and
     communication deficits associated with the spectrum of autism. Journal of Autism &
     Developmental Disorders 2002;30:205-23.

 15. Wing L, Leekam SR, Libby SJ, Gould J, Larcombe M. The diagnostic interview for social and
     communication disorders: Background, inter-rater reliability and clinical use. Journal of Child
     Psychology and Psychiatry 2002;43:307-25.

      Copyright © 2012, The Health and Social Care Information Centre. All Rights Reserved.   29
16. Lord C, Rutter M, Le Couteur A. Autism Diagnostic Interview-Revised: a revised version of a
diagnostic interview for caregivers of individuals with possible pervasive developmental
disorders. Journal of Autism and Developmental Disorders 1994;24:659-85.
17. Brugha TS, McManus S, Smith J, Scott FJ, Meltzer H, Purdon S, Berney T, Tantam D,
Robinson J, Radley J, Bankart J. Validating two survey methods for identifying cases of
Autism Spectrum Disorder among adults in the community [In Press]. Psychological Medicine
2012.
18. Brugha TS, McManus S, Bankart J, Scott F, Purdon S, Smith J, Bebbington P, Jenkins R,
Meltzer H. Epidemiology of Autism Spectrum Disorders in Adults in the Community in
England. Archives of General Psychiatry 2011;68:459-65.
19. Anckarsater H, Nilsson T, Saury JM, Rastam M, Gillberg C. Autism spectrum disorders in
institutionalized subjects Nordic Journal of Psychiatry 2008;62:160-67.
20. Cashin A, Newman C. Autism in the criminal justice detention system: A review of the
literature. Journal of Forensic Nursing 2009;5:70-75.
21. Department of Health. Valuing People. A new strategy for Learning Disability for the 21st
century. White Paper. London: HMSO, 2001.
22. American Psychiatric Association. Diagnostic and statistical manual of mental disorders (4th
ed). Washington, DC: APA, 1994.
23. World Health Organisation [WHO]. The ICD-10 classification of mental and behavioural
disorders. Geneva: WHO, 1992.
24. Bhaumik S, Tyrer F, McGrother C, Ganghadaran SK. Psychiatric service use and psychiatric
disorders in adults with intellectual disability. Journal of Intellectual Disability Research
2008;52:986-95.
25. Cooper SA, Smiley E, Morrison J, Williamson A, Allan L. Mental ill-health in adults with
intellectual disabilities: prevalence and associated factors. British Journal of Psychiatry
2007;190:27-35.
26. Emerson E, Baines S. The estimated prevalence of autism among adults with learning
disabilities in England: Improving Health and Lives.: Learning Disabilities Observatory, 2010.
27. Roeleveld N, Zielhuis, G.A., Gabreels, F. The prevalence of mental retardation: a critical
review of recent literature. Developmental Medicine & Child Neurology 1997;39:125-32.
28. Institute of Public Care. Estimating the prevalence of severe learning disability in adults
(working paper). Oxford: Institute of Public Care via Projecting Adult Needs and Service
Information (PANSI), 2009.
29. Parrott R, Emerson E, Hatton C, Wolstenholme J. Future demand for residential provision for
people with learning disabilities. . Manchester: Hester Adrian Research Centre, University of
Manchester, 1997.
30. National Statistics. Mid-year population statistics 2010. Durham: NOMIS, 2010.
31. Sparrow SS, Cicchetti DV, Balla DA. Vineland Adaptive Behavior Scales: Second Edition
(Vineland II), Survey Interview Form/Caregiver Rating Form. Livonia, MN: Pearson
Assessments, 2005.
30 Copyright © 2012, The Health and Social Care Information Centre. All Rights Reserved.Published by the NHS Information Centre for health and social care
Part of the Government Statistical Service
ISBN 978-1-84636-632-1
This publication may be requested in large print or other formats.
Responsible Statistician
David Lloyd, Senior Service Manager, Prescribing & Primary Care Services
For further information:
www.ic.nhs.uk
0845 300 6016
enquiries@ic.nhs.uk
Copyright © 2012 The Health and Social Care Information Centre, Community and Mental Health
Team.
All rights reserved.
This work remains the sole and exclusive property of the Health and Social Care Information Centre
and may only be reproduced where there is explicit reference to the ownership of The Health and
Social Care Information Centre.
This work may be re-used by NHS and government organisations without permission.
This work is subject to the Re-Use of Public Sector Information Regulations and permission for
commercial use must be obtained from the copyright holder.
Copyright © 2012, The Health and Social Care Information Centre. All Rights Reserved. 31You can also read